Background: Chronic kidney disease (CKD) is considered the popular disorder throughout the world. It associates with abnormalities of mineral metabolism such as calcium, phosphorus and parathyroid hormone. Objectives: The study aimed to evaluate the alteration of serum levels of Ca, Ph and PTH in hemodialysis patients in in Zawia Kidney Center, Western Libya and determining the relationship of age with the levels of these parameters. Materials and Methods: One hundred subjects were included in the present study. Out of which 50 cases were dialysis patients collecting from AZ-Zawia kidney center and 50 subjects were health individuals used as control divided into male and female, mean age was 47.03±14.14 years. Five ml of venous blood was collected from each participant for estimating the serum levels of PTH, Ca and Ph. Results: The result showed that the level of PTH was higher than normal, where the mean level of PTH in dialysis patients was 421.64±391.30 and 44.59±12.32 pg/ml in the control. Ca level in dialysis patient was slightly lower than normal while Ph is nearly similar to control subjects. The level of PTH was high in young patient (580.6±440.4) and decreases with increase in age, where recorded its mean level in age group >60 year, was 240.3±321.0 and there was a significant negative correlation between age and the serum level of PTH (r= -0.3 P=0.03). However, the results showed that none significant correlation between age and the serum levels of Ca and Ph, p-value =0.461 and 0.701, respectively. In addition. the percentage of the patients who had a serum iPTH level of <150 pg/mL was 32% while that of patients with iPTH of >300 pg/mL was 46 %. Hypocalcemia and hypophosphatemia were observed in 66% and 46% of the patients, respectively. Moreover, 28%, 22% and 42% of the patients, respectively, reached the K/DOQI target range of Ca, P and iPTH. Conclusion: It can be concluded that hyperparathyroidism is a common disorder in hemodialysis patients and parathyroid hormone is decreasing whenever increase patient age. Percentage of dialysis patients, in Az-Zawia, who their serum of PTH and Ca and Ph in within target range recommending by K/DQOI was lower in comparing with non-target rang. Therefore, it is recommended that patients should consider and have attention about their health by having proper medication to adjust the level of mineral metabolism and parathyroid hormone.
Keywords
Hemodialysis
Serum
Parathyroid Hormone
Calcium
Phosphorus
Zawia
Kidneycenter
INTRODUCTION
Chronic kidney disease which named CKD nowadays is considered the popular disorder throughout the world. This because it is associated with other systemic disorder including mineral and bone metabolism [1]. This disorder lines are showed by either one or combination of biochemical abnormalities such as abnormal of calcium, phosphors, parathyroid hormone (PTH) and vitamin D metabolism. Also, leading to abnormal of bone, vascular tissue and calcification of soft tissue [2]. In addition, chronic kidney disease can cause cardiovascular disease, kidney failure and premature death. According to studies conducted in united state, poor outcome and high cost are one reason that led to the prevalence of early stage of CKD [1]. Recognizing of spreading of early stage of disease among population and ascertainment of the trend over time is essential to planning to prevent this disease [3]. Among of plans is observing prevalence increased obesity, diabetes and hypertension and risk factors leading to chronic kidney disease. Discovering early stage of CKD is depended on recognizing of kidney damage and function by measuring of the glomerular filtration rate (GFR) and detecting the percentage of albumin in urine [3]. Generally, CKD becomes obvious in stage 3 that characterized by glomerular filtration rate between 30 and 59ml/min per 1.73 m2 and progress to end stage renal disease (GFR of <15mL/min per 1.73m2).
The process that helps to eradicate of extra water and waste product is named dialysis. It is considering an effective artificial replacement for kidney function, particularly to patients who are suffering from renal failure [4].
Objectives
The present study aimed to evaluate the alterations in levels of serum parathyroid hormone, calcium and phosphorus in hemodialysis patients Zawia Kidney Center, Western Libya.
MATERIALS AND METHODS
Method
The study was performed in Zawia kidney center in Zawia city, Western Libya. 50 patients, who were treated with dialysis, was included in this study. During the period from January to April, 2019. Also, there was other 50 subjects who were not suffering from chronic kidney disease (healthy individuals), collected from Alfa Laboratory in Az-Zawia (Libya) and used as control.
Collection of Blood Samples
The blood samples were withdrawn from venous blood before the start of dialysis, by sterile syringes there capacity 2 ml , blood has been transfusion to special tubes free from anticoagulants (plain tubes ) and left in laboratory temperature for about (10-30 ) minutes in order to clot, the samples were centrifuged at 3000 rpm (round per minute) for 3 minutes to separate out the serum , the required tests were carried out on a number of samples while the rest of the samples were stored in special containers at -25°C to -35°C in the refrigerator until required for analysis.
Determination of Parathyroid Hormone
Immunoassay for the in vitro quantitative determination for intact PTH using microparticle Electrochemiluminescence immunoassay of the serum on Cobas e411 analyser that employs a sandwich test principle in which a biotinylated monoclonal antibody reacts with the N- terminal fragment and a monoclonal antibody labeled with a ruthenium complex reacts with the C-terminal fragment. The total duration of the assay was approximately 18 min (15 to 20 minutes).
1st Incubation
By Using 50μl of the sample, a biotinylated monoclonal PTH-specific antibody and monoclonal PTH-specific antibody labeled with a ruthenium complex form a sandwich complex.
2nd Incubation
After addition of streptavidin-coated microparticles, the complex becomes bound to the solid phase via interaction of biotin and streptavidin. The normal range of PTH: 15.0-65.0pg/mL.
Determination of Calcium
By Colorimetric method, Calcium with O-cresolphtaleine complex compound, at alkaline pH, yields a red colored complex, which intensity is proportional to the calcium concentration (Table 1).
Table 1: Procedure of Calcium Estimation
Parameters
Blank (cuvate)
Standard (Cuavte)
Sample (cuvate)
Standard
-
20µl
-
Sample
-
-
20µl
Word solution
1ml
1ml
1ml
Reagent 1
2-Amino-2-methyl 500 mmol/l
Buffer solution 1- propanol
Reagent 2
Gresolphtaleine compl. 0.62 mmol/l
Chromogen8-hydroxyquinoleine 69 mmol/l Solution
Reagent 3
Calcium standard10 mg/dl
Standard 100 mg/l
2,5 mmol/l
Working solution is mixing one part of Reagent1 with one part Reagent 2.
After that, samples were mixed and waited for 5 min at room temperature and then read it at wavelength 570 nm.
Calculation: OD sample/OD standard x n
Normal Range: 8.2-10.2 mg/dL.
Determination of Phosphorus
By UV Method: Inorganic phosphorus reacts with ammonium molibdate in presence of sulfuric Acid to form a phosphomolibdate complex.
The absorbance of this complex at 340 nm is proportional to the phosphorus concentration (Table 2).
Table 2: Procedure of phosphorus estimation
Parameters
Reagent blank
Standard
Sample
Standard
-
10 μl
-
Sample
-
-
10 μl
W.R.
1ml
1ml
1ml
Reagents Used
Reagent 1:
Sulfuric Acid 200 mmol/l
Ammonium 0.40 mmol/l
Molibdate Detergent 0.S
Reagent 2
Standard 5 mg/dl
50 mg/dl
1.61 mmol/l
Mixed, waited for 5 min and read at 340 nm.
Calculation: OD sample / OD standard x n
Normal Range: 4.5 to 7.7 mg/dL
RESULTS
In this study a total of 100 participants of age ranging between 22-75 years, the mean age was 47.03±14.14 years. These participants were 50 hemodialysis patients (25 males and 25 females) while the rest (50 subjects) were healthy individuals. The hemodialysis patients were divided into three age groups 20-39, 40-59 and >60 years old. In addition, based on the questionnaires prior to this research, all hemodialysis groups (males and females) were taking some relative drugs such as calcium carbonate and one-Alpha (100%).
Mean Levels of PTH, CA and Ph in Normal and Dialysis Participants
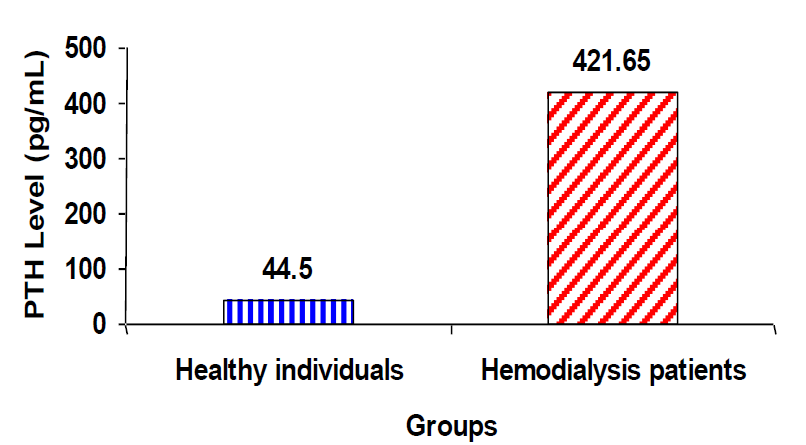
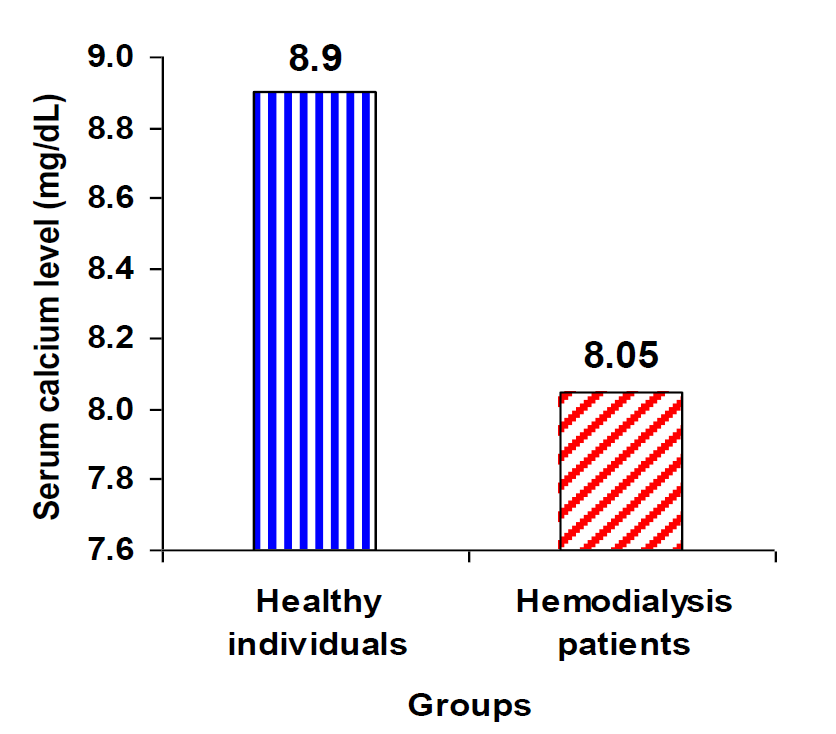
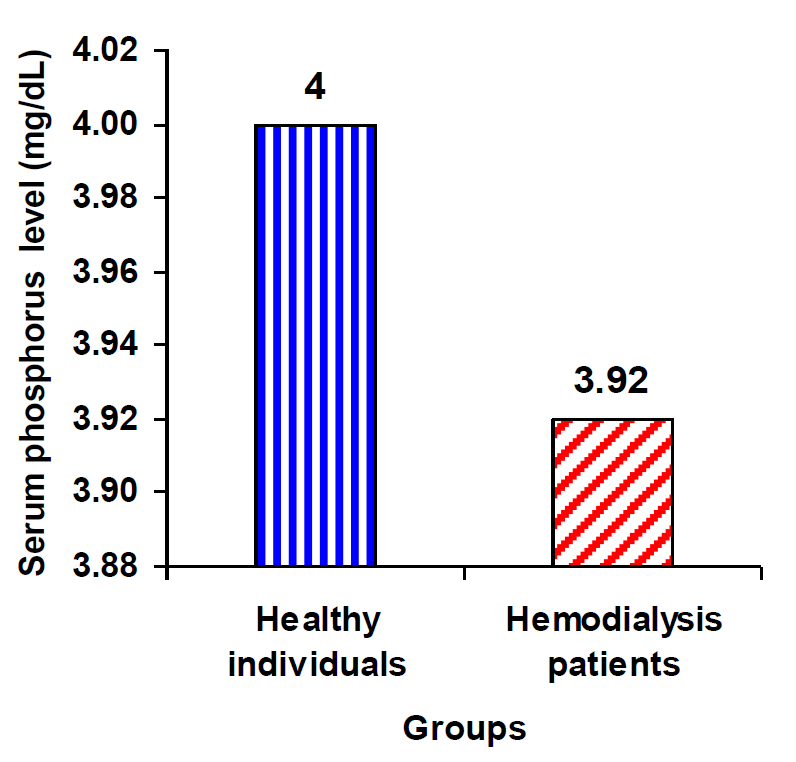
The level of parathormone in dialysis patient was much higher than control cases, where mean level of serum PTH was 421.6±391.3 and 44.5980±12.3, respectively. Moreover, calcium level in dialysis patient was slightly lower than normal group, since the mean level of Ca was 8.0±1.0 in dialysis and 8.9±0.2 in normal. However, there was no much difference between the level of Ph in both dialysis and normal where the mean was 3.9±1.4 in dialysis patients and 4.0±0.7 in the normal group (Table3).
Table 3: Mean level of PTH, Ca and Ph in the control group and dialysis patients
Cases
PTH
Ca
Ph
Normal
44.59±12.32
8.9 ±0.2
4.0±0.7
Dialysis
421.64±391.30
8.05± 1.0
3.9±1.4
The serum PTH level in the control group is (44.59dl) in comparison to the dialysis patients, PTH level in dialysis patient was much higher than control (421.6±391.3g/dl) (Figure 1).
Figure 1: The mean of serum PTH level in healthy individuals and hemodialysis patients.
However, the level of Ca and Ph were nearly the same, where the Ca was 8.9±0.2 for the control group and 8.05±1.0 for the hemodialysis group (Figure 2) and Phosphorus was 4.0±0.7 for the control group and 3.9±1.4 for the dialysis group (Figure 3).
Figure 2: The mean of serum calcium level in healthy individuals and hemodialysis patients.
Figure 3: The mean of serum phosphorus level in healthy individuals and hemodialysis patients
Correlation of PTH with Ca and PH in Dialysis Patient
Table 4 shows that there was a negative correlation between PTH and Ca but not significant, where person correlation (r) was 0.224 and p value was 0.118. in contrast, no significant positive correlation was between PTH and Ph, where was r=0.039 and P= 0.790). Moreover, there was a significant positive correlation between Ca and Ph, where p value was 0.09 and r was 0.66.
Table 4: The correlation between PTH level with calcium and phosphorus levels in hemodialysis patient
Parameters
Ca
Ph
PTH
Pearson Correlation
-0.224
0.039
Sig. (2-tailed)
0.118
0.790
Correlation is significant at the 0.05 level
The mean serum levels of PTH, Ca and Ph in different age groups for the hemodialysis patients
Table 1 below shows the mean level of parathyroid hormone, calcium and phosphorus and also the correlation of these parameters between each other in three different age groups (20-39, 40-59 and >60 years). It appears that the level of PTH in young individuals is higher than other groups, where mean level was 580.6±440.4. Whereas its level in elderly >60 was 240.3±321, which is lower than in the middle age group that was 392.6±361.3.
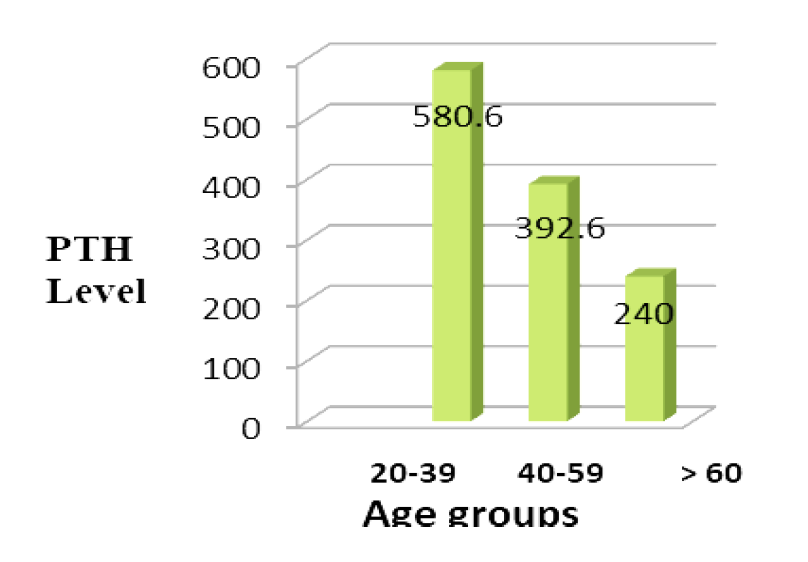
Interestingly, the PTH levels is decreased with increase the dialysis patient age, where in the age group 20-39 the PTH level was 580.6±440.4 then dropped to 392.6±361.3 in the age group 40-59 and decreased to 240.3±321 in the age group >60. As a result of this there was a significant negative correlation between PTH and the age groups, where r = - 0.304 and p value = 0.03.
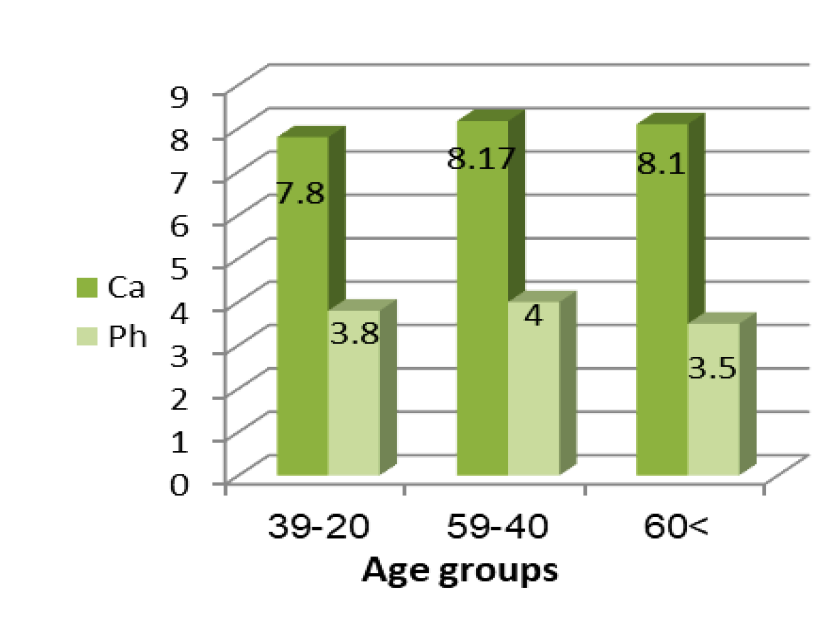
On the other hand, the levels of Ca and Ph were nearly similar in the dialysis patient’s different age groups, except that in the middle age (40-59) the Ca and Ph level were the highest among other age groups 8.17±1.0 and 4.0±1.3 respectively. Consequently, there was no significant relation between Ca and the dialysis patient’s age groups (p= 0.461) (Table4).
Group who their age from 20 to39 years old have highest blood level of PTH than other groups and the mean level of this hormone in this group was 580.6 pg/dl. In 40-59 age group, the PTH level was 392.6pg/dl, while in >60 group the PTH level was 240pg/dl (Figure 4).
Figure 4: The mean serum PTH level in different age groups in hemodialysis patients
In addition, calcium in group age 20-39 was slightly lower than group 40-49 and >60 where its level was 7.8mg/dl. Calcium level in group 40- 59 and >60 was similar 8.17mg/dl and 8.10mg/dl, respectively. Moreover, phosphorus level in group 20-39 was 3.8md/dl, whereas in 40-59 was 4.0 mg/dl. Ph in elderly group (>60) was 3.5mg/dl (Figure 5).
Figure 5: The mean serum calcium and phosphorus levels in different age groups in hemodialysis patients
Percentage of Dialysis Patients who have PTH, Ca and Ph within the Target Range Recommended by K/DOQI
Table 5 below displays the distribution of the national value of serum calcium, phosphorus and intact parathyroid hormone (iPTH) levels that classified by the ranges recommended by the K/DOQI guidelines. The result in this study demonstrates that 22.0% of dialysis patient their serum PTH was within the target range (150-300), while the majority of the dialysis patients was 46% their serum PTH was >300, which is above the recommended level (150-300).
Table 5: Mean levels of PTH, Ca and Ph in different age groups for the dialysis patients and the P value
Age Groups
PTH
Ca
Ph
20-39
580.6±440.4
7.8 ±1.2
3.8±1.9
40-59
392.6 ±361.3
8.17±1.0
4.0±1.3
>= 60
240.3±321.0
8.10±0.90
3.5±0.90
Person correlation
-0.304*
0.107
- 0.056
P value
0.032
0.461
0.701
*Correlation is significant at the 0.05 level (5-tailed)
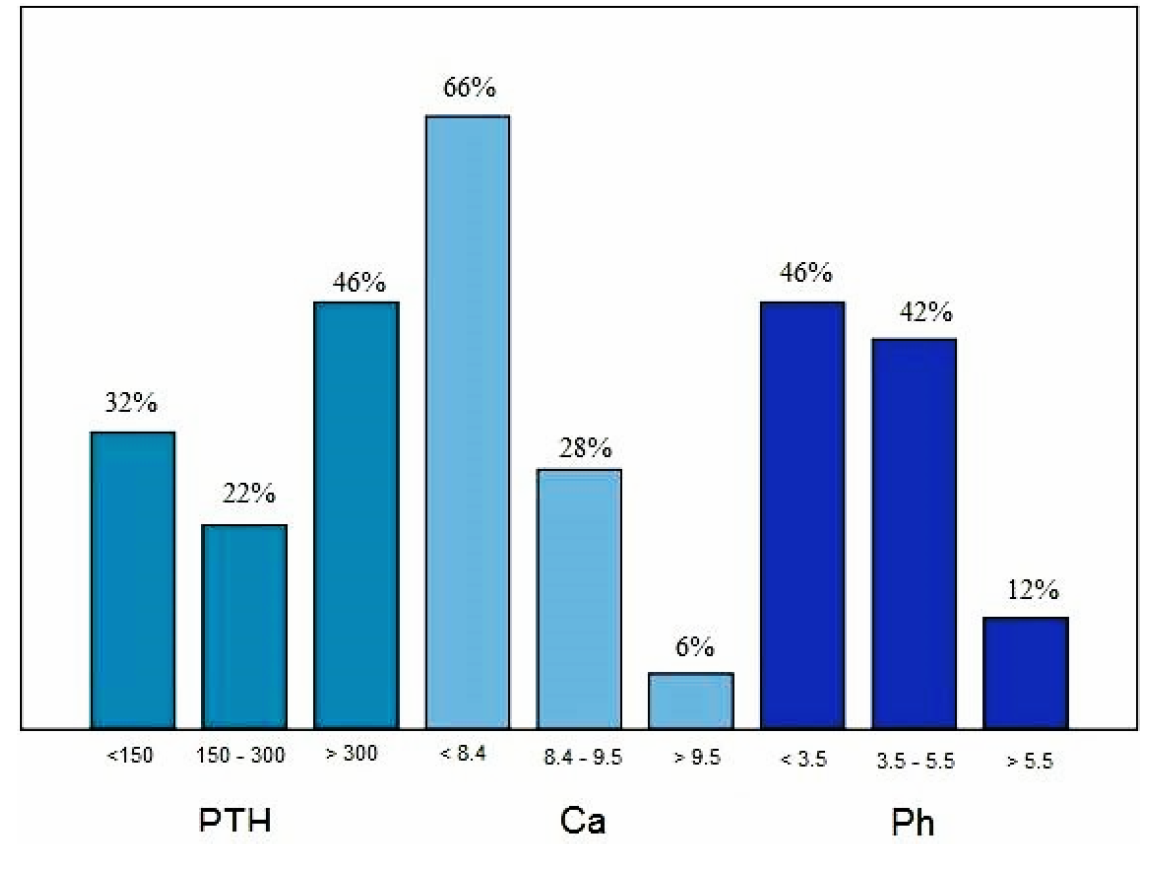
In phosphorus, there was 42% of hemodialysis patients within target level (3.5-5.5 mg/dl) and 46% were (<3.5mg/dl) which is below target level that recommended by K/DQOI. In addition, about 28% of dialysis patients had calcium level within the target range (8.4-9.5 mg/dl) and the 66% of hemodialysis patients were less than the target (>8.4mg/dl) (Table 6).
Table 6: The percentage of dialysis patients who having PTH, Ca and P within target range recommended by K/DOQI
Percent
Frequency
Range
Parameters
32
16
<150
Below the target
PTH
22
11
150-300
Within the target
46
23
>300
Above the target
46
23
<3.5
Below the target
Ph
42
21
3.5-5.5
Within the target
12
6
>5.5
Above the target
66
33
<8.4
Below the target
Ca
28
14
8.4-9.5
Within the target
6
3
>9.5
Above the target
Percentage of dialysis patients who having serum PTH within recommended range (150-300) was 22% while about 46% of these patients their serum level of PTH above 300pg/mmol and the rest of patients (32%) had serum hormone less than 150. Moreover, high percentage of dialysis patients (66%) had Ca level <8.4 and 28% of patients within target range (8.4-9.5) whereas small proportion of dialysis patients had serum Ca more than 9.5md/dl. In addition, percentage of dialysis patients who have serum Ph within range (3.5-5.5mg/dl) was 42% while their percentage below 3.5mg/dl was highest about 66%. Small percent of patients have serum level Ph more than 5.5mg/dl (Figure 6).
Figure 6: Percentage of hemodialysis patients who serum of PTH and Ca and Ph within, below and above the target range
DISCUSSION
The aim of this study was to investigate levels of parathyroid hormone, calcium and phosphorus in dialysis patients and normal individuals. According to the results of this study the parathormone level was much higher in dialysis patient than normal individuals. This result is agreed with the study of Du et al. [5] who reported that the mean iPTH level of the dialysis patients was 560.1±494.2 which is higher than in the control group which was 62.4±29.9. However, other study showed that the level of PTH in CKD patients remain controversial, because the majority of dialysis patients are taking Cinacalcet drug which decreases levels of PTH in the body [6].
The result of the present study showed that calcium level in dialysis patients was 8.0±1.0 which is slightly lower than normal group 8.9±0.2. The result of the current study is supported by a study conducted in Iran which stated that the level of Ca in the dialysis patients was lower than in the normal group in the CKD patients because the calcium level is reduced in blood due to a decrease in synthesis of active vitamin D [7]. However, this result is in discrepancy with other studies which pointed out that the calcium levels in the dialysis group was nearly identical with the calcium level in the normal group. This might be as a result of the Ionized Calcium Carbonate that obtained by CKD patients [8].
In the present study the mean level of Ph shows similar results, where in the dialysis patients was 3.9±1.4 and control group 4.0±0.7. This study is not in line with Tentori et al. [9] who demonstrated that the distributions of mineral metabolism particularly phosphorus are low in dialysis patients and this is observed in the most recent phase of Dialysis Outcomes and Practice Patterns Study (DOPPS). On the other hand, study was conducted in Nigeria showed that dialysis patients were diagnosed with hyperphosphatemia, where they have higher level of serum Ph and the mean level was 1.8±0.62mmol/l.
The correlation between PTH and Ca among the dialysis patients in the current study was not significant (p-value=0.1). This finding is in agreement with other studies which found that a significant relation between the PTH and ALP in the dialysis patients, but between the PTH and Ca was not significant [10]. Kim et al. [11] reported that a positive significant correlation was seen between the PTH and Ph in the hemodialysis patients (p<0.05), this is in contrary with our study, where the result showed a positive non-significant relation between PTH and Ph (p=0.790).
The results concerning the mean levels of PTH, Ca and Ph in different age groups for the dialysis patients showed that younger dialysis patients (20-39) had the highest level of the PTH in comparison to the other age groups. It is notably that in the current study the correlation between PTH and the age groups was a significant negative (p value = 0.03), where the PTH levels is decreased with increase the dialysis patients age, where in young patients the PTH level was 580.6±440.4 then dropped in the age group 40-59 to 392.6±361.3 and fell to 240.3±321 in the elderly >60. This result is agreed with Li and Zhang study [12] which showed that level of PTH in elderly group (143±112.9) was lower than non-elderly group (216.3±133.4) where the correlation of PTH with age was significant (p<0.01). However, the levels of Ca and Ph were almost similar in different age groups of dialysis patients, except that in the middle age (40-59) the Ca and Ph level were the slightly higher than other age groups 8.17±1.0 and 4.0±1.3, respectively. Consequently, there was no significant correlation between the levels of Ca and Ph and age in dialysis patient’s age groups, P value of Ca between three groups was 0.461 while Ph was 0.70. Our result is in accordance with the study of Li and Zhang [12], in which appeared that there was not significant correlation of Ca and Ph between elderly and non-elderly group.
In comparison of percentage of dialysis patients who have serum level of Ca, P and PTH in target range with levels recommended by K/DQOI where Ca level should be 8.4-9.5mg/dl, P is 3.5-5.5mg/dl and PTH 150-300pg/mmol. Our results showed that only a small percentage of hemodialysis patients reach all the target ranges of serum Ca, Ph and PTH levels. Overall, about 28%, 42% and 22% of the patients reached the target ranges of Ca, P and iPTH recommended by K/DOQI. In DOPPS, 2016 study, 55.8%, 54.2% and 31.8% of the patients met the target ranges of Ca, P and iPTH recommended by K/DOQI [13]. The results of a multicenter study conducted, by Kim et al. [11], in Korea showed that 58.7%, 51% and 30.8% of the patients met the target ranges of Ca, P and iPTH, while in Iran displayed about 51.7%, 61.3% and 24.7% of the patients reached the target ranges of Ca, Ph and PTH. In comparison with mentioned studies, our finding indicated that the target range of P is much lower met in Az-Zawia (Libya). However, PTH levels in our study were largely in line with DOPPS 2011 in Canada where 63% for Ca, 55.3%for Ph and 22.1% for PTH.
CONCLUSION
It can be concluded that the development of hyperthyroidism (PTH) in patients with CKD is influenced by several risk factors, including the sex of males and females, low calcium levels and normal (independent) levels of phosphorus expression, possibly HPT due to complex interactions between these factors. Early identification of the risk factors is useful for the prevention and treatment of CKD. Therefore, early analysis of the level of PTH in patients with renal failure is recommended to determine which changes may occur and increase the risk factors in patients with CKD conditions.
REFERENCE
Levin, A. et al. “Prevalence of abnormal serum vitamin D, PTH, calcium and phosphorus in patients with chronic kidney disease: results of the study to evaluate early kidney disease.” Kidney International, vol. 71, no. 1, 2007, pp. 31-38, https://doi.org/10.1038/sj.ki.5002009.
Moe, S. et al. “Definition, evaluation and classification of renal osteodystrophy: a position statement from kidney disease: Improving Global Outcomes (KDIGO).” Kidney International, vol. 69, 2006, pp. 1945-1953.
Coresh, J. et al. “Prevalence of chronic kidney disease in the United States.” Journal of the American Medical Association, vol. 298, 2007, pp. 2038-2047.
Vadakedath, S. and V. Kandi. “Dialysis: a review of the mechanisms underlying complications in the management of chronic renal failure.” Cureus, vol. 9, no. 8, 2017, https://doi.org/10.7759/cureus.1603.
Du, J. et al. “Analysis of the parathyroid function in maintenance hemodialysis patients from Changchun, China.” Chronic Diseases and Translational Medicine, vol. 3, no. 3, 2017, pp. 181-185.
Akizawa, T. et al. “PTH-dependence of the effectiveness of cinacalcet in hemodialysis patients with secondary hyperparathyroidism.” Scientific Reports, vol. 6, 2016, pp. 1-11, https://doi.org/10.1038/srep19612.
Afaghi, E. et al. “Parathyroid gland function in dialysis patients.” Journal of Parathyroid Disease, vol. 2, no. 1, 2014, pp. 33-37.
Block, G.A. et al. “Mineral metabolism, mortality and morbidity in maintenance hemodialysis.” Journal of the American Society of Nephrology, vol. 15, 2004, pp. 2208-2218.
Tentori, F. et al. “Mortality risk for dialysis patients with different levels of serum calcium, phosphorus and PTH: the Dialysis Outcomes and Practice Patterns Study (DOPPS).” American Journal of Kidney Diseases, vol. 52, 2008, pp. 519-530.
Saravani, R. et al. “Correlation between serum level parathormone, alkaline phosphatase, calcium and phosphorus of patients hemodialysis in Zahedan.” Journal of Medical Sciences, vol. 7, no. 1, 2007, pp. 154-157.
Kim, G.H. et al. “Serum calcium and phosphorus levels in patients undergoing maintenance hemodialysis: a multicentre study in Korea.” Kidney Research and Clinical Practice, vol. 33, no. 1, 2014, pp. 52-57, https://doi.org/10. 1016/j.krcp.2013.12.003.
Li, W. and S. Zhang. “Risk factors of parathyroid dysfunction in elderly patients with chronic kidney disease undergoing hemodialysis.” Advances in Clinical and Experimental Medicine, vol. 24, no. 6, 2015, pp. 1007-1012, https://doi.org/10.17219/acem/23439.
Arbor Research Collaborative for Health (ARCH). The DOPPS Annual Report. 2016, http://www.dopps.org/ annualreport/.
Recommended Articles
Research Article
It Remains Unproven That the Variant M.8231C>A Causes Coronary Atherosclerosis
Finsterer J
Published: 15/07/2020
Download PDF
Research Article
Vision for a Brighter Kangra: Unmasking the Truth about Pink Eye – A Comprehensive Study on Types, Symptoms, and Proactive Prevention in Himachal Pradesh’s Kangra District
Deepti ,
...
Garima
Published: 11/11/2023
Download PDF
Research Article
Leigh Syndrome Should Not Be Diagnosed Exclusively Upon Cerebral MRI
Finsterer J
Published: 15/07/2020
Download PDF
Research Article
Bioactive ingredients screening and antibacterial activity of Citrus aurantifolia leaf extract against some enteric isolates
Abdallah M.S,
Kabiru Sama’ila
Published: 10/08/2020
Download PDF
PO Box 101, Nakuru
Kenya.
Email: office@iarconsortium.org
Editorial Office:
J.L Bhavan, Near Radison Blu Hotel,
Jalukbari, Guwahati-India
Ebsaim, M., Lagha, E., Yahya, R. A. M., Aboharba, R., Hyedi, T., Aldeeb, A. & Almjdoob, K. (2021). Alterations in the Serum Levels of Parathyroid Hormone, Calcium and Phosphorus in Haemodialysis Patients in Zawia Kidney Centre, Western Libya. IAR Journal of Medical Sciences, 2(1), 1-7.
MLA
Ebsaim, Mohamed, et al. "Alterations in the Serum Levels of Parathyroid Hormone, Calcium and Phosphorus in Haemodialysis Patients in Zawia Kidney Centre, Western Libya." IAR Journal of Medical Sciences 2.1 (2021): 1-7.
Chicago
Ebsaim, Mohamed, Ettiyeb Lagha, Rabia A. M. Yahya, Rabeaa Aboharba, Tasnem Hyedi, Aya Aldeeb and Kariman Almjdoob. "Alterations in the Serum Levels of Parathyroid Hormone, Calcium and Phosphorus in Haemodialysis Patients in Zawia Kidney Centre, Western Libya." IAR Journal of Medical Sciences 2, no. 1 (2021): 1-7.
Harvard
Ebsaim, M., Lagha, E., Yahya, R. A. M., Aboharba, R., Hyedi, T., Aldeeb, A. and Almjdoob, K. (2021) 'Alterations in the Serum Levels of Parathyroid Hormone, Calcium and Phosphorus in Haemodialysis Patients in Zawia Kidney Centre, Western Libya' IAR Journal of Medical Sciences 2(1), pp. 1-7.
Vancouver
Ebsaim M, Lagha E, Yahya RAM, Aboharba R, Hyedi T, Aldeeb A, Almjdoob K. Alterations in the Serum Levels of Parathyroid Hormone, Calcium and Phosphorus in Haemodialysis Patients in Zawia Kidney Centre, Western Libya. IAR Journal of Medical Sciences. 2021 Jan;2(1):1-7.


 Download PDF
 Download XML