Background: As COVID-19 has become the recent major concern all over the world; as this virus was able to paralyze most of the human beings’ activities, an urgent solution to eradicate and control the spread of this disease is needed. It is known that both Ferritin: Albumin and Monocyte: Lymphocyte ratios are increased in COVID-19 infection. In our study, we primarily investigated the dynamic effects of Hydroxychloroquine+Azithromycin+High dose Vit C or immuno-enhancing nutrients (IENs) on this innovated combined ratio across six studied groups. Methods: This was a single-center randomized, controlled, open label study was conducted on 48 eligible patients in the COVID-19 isolation department at Queen Alia Military Hospital, Royal Medical Services, Amman/Jordan over 7 weeks. Age≥16 years and positive RT-PCR are considered the major inclusion criteria. An ANOVA+Tukey Kramer post-hoc multiple comparison and Chi square analyses were primarily used in this study. Result: Our total study population was 48, 79.2% were males and 20.8% were females. The age of the total sample was 31.35+14.67 years. The hospital length of stay, variation in body temperature, up-trending in R:rR was significantly lowest in groups that include IENs followed by high dose Vitamin C than groups without them. There is insignificant role of antibiotic in mild cases of COVID-19 infected patients with pulmonary infiltration. Conclusion: The existing approved COVID-19 drugs of Hydroxychloroquine with or without Azithromycin are likely ineffective without our immune system support and the IENs likely improve the clinical outcomes at least dynamically in the worst scenario.
Keywords
Azithromycin
COVID-19
Directional Movement Index
Economical Impacts
Hydroxychloroquine
Immuno-Enhancing Nutrients
Lymphocyte
Monocyte Ratio
Ferritin
Albumin Ratio
Ratio to Reverse Ratio
Vitamin C
INTRODUCTION
The pandemic COVID-19 originated from Wuhan, China. The clinical presentation varies from asymptomatic or mild respiratory symptoms to critical ARDS. Some patients experienced dyspnea and/or hypoxemia one week after the onset of the disease. In severe cases, patients quickly progressed to develop acute respiratory syndrome, septic shock, metabolic acidosis and coagulopathy [1]. Worst outcomes are seen in patients of older age having comorbidities such as cardiovascular, diabetes mellitus, cerebrovascular and kidney diseases [2]. COVID-19 has a huge attention due to its novel pathogenesis and its reputation of being a fatal virus, SARS-COV-2 have upgraded itself due to the special feature that Corona viruses have as they have several highly active RNA processes that aren’t found in any other RNA viruses [3].
The pathogenesis of SARS-COV-2 is distinctive due to long incubation period that ranges from 2-14 days and the inclusion of not only the respiratory system, but also other many systems in the body. There are many theories that explain the involvement of various systems in the body, the first one is the “Hyper-inflammatory and Cytokine Storm” and the second is the “Hyper-Oxidative-Radical Storm”. Both of these theories show a clear evidence of the immune system participation and its role and function in either eradicating the virus or exacerbating the disease status [4]. The newest theory “Hyper-Oxidative-Radical Storm” proposed that the pathogenesis maybe due to RBCs invasion by the virus. COVID-19 is a positive-strand RNA virus could attack the ß chain of hemoglobin (Hgb) releasing iron to the blood causing iron overload. This iron overload pose harmful effects on the body as iron is a strong oxidizing agent [5].
Serum ferritin level can be influenced by iron status and it is elevated due to secondary hemophagocytic lymphohistiocytosis (sHLH) which exhibits a compensatory hyperimmune status [6,7]. It is also a potential diagnostic and prognostic marker in SARS-CoV-1 infection given its accessibility and correlation with a remarkable inflammatory response secondary to infection [8]. As well as, hyperferritinemia (ferritin as a positive acute phase reactant) and hypoalbuminemia (albumin as a negative acute phase reactant) are associated with increased severity and poorer long term prognosis [9,10].
NLR and MLR have taken both the levels of neutrophil and monocyte to lymphocyte into account and have been proposed as a new, Reliable, Applicable, Cost-Effective and Affordable Infectious Indicators for early discrimination clinical bacterial infectious from clinical viral and non-infectious statuses. A special feature about COVID-19 that it is opposite to other viral infection in the elevation of lymphocytes, in this virus most of the patients have shown lymphopenia and increase in monocytes which is misleading to the over prescription of unneeded antibiotics. Since there is an increased rate of RBCs rupture and release of iron, monocytes play a vital role in iron homeostasis and decrease iron toxicity by a process called erythrophagocytosis [11,12]. MLR declining would constitute a more adequate clinical biomarker to monitor the evolution of COVID-19 infection and its prognosis with respect to other less specific parameters, such as NLR and PLR value [13].
The search for treatment regimens has taken the world by storm. While there has been a great attempt at finding a definitive treatment, much of the care provided to patients is supportive [1]. Up to date, there is no effective antiviral therapy available for COVID-19. Yet there is another aspect, that hasn’t been formally regarded as a modifiable tool in the fight against COVID-19 which is: the inherent strength of a patient’s immune system [14]. Generally, high percentage of hospitalized patients have wasting syndromes and this affects the immunity negatively. So, it is rational to suggest immunonutrition in clinical practice. Immunonutrition is the specific nutrients and micronutrients in amounts higher than the amounts taken in diet which have modulatory effect on immune system activities and the effects on the patient immunity activation. Glutamine, arginine, anti-oxidants, Ꞷ-3 poly unsaturated fatty acids (Ꞷ3-PUFAs) and nucleotides are considered as immunonutrients [15].
ArgiMent ® is a new specialized ready to mix (RTM) Modular Formula (MF) available in our institution and is recently introduced in our nutritional formulary list. When one sachet of ArgiMent ® (42.75 g) reconstituted with 120 ml water is yielded approximately a moderate caloric density of 1.2 Cal/ml and very high protein density of 15 g/100 Cal (≈30% from glutamine ≈30% from arginine and ≈40% from whey protein) in addition to other Immuno-enhancing and wound healing nutrients of vit C, Zinc and Cupper. Taking into consideration, the lymphodepleting nature of the COVID-19 infection and the stress it further puts on the body by creating a pro-inflammatory state, all measure should be taken to contain such an infection [16]. Subsequently, we propose the use of an Immunoenhancing Nutrients (IENs) composed of arginine, glutamine, zinc, copper and vitamin C as a supportive measure in addition to the standard COVID-19 management protocol in our country.
MATERIALS AND METHODS
This was a single-center randomized, controlled, open label study conducted in the COVID-19 isolation department at Queen Alia Military Hospital, Royal Medical Services, Amman, Jordan. This study was conducted over 7 weeks between 5 Apr 2020 to 21 May 2020 after it was approved by our Institutional Review Board (IRB).
Initial triaging, stratification and diagnosis of COVID-19 infection were primarily based on patient history of communication, clinical and radiological features. Age≥16 years and positive RT-PCR are considered the major inclusion criteria while severe liver diseases, stage IV-V renal diseases, retinopathy problems, pregnancy/lactation and risk of QT prolongation are the primary exclusion criteria in our study. All the 48 eligible confirmed COVID-19 infected patients were randomly allocated into one of the six tested groups (Group I-VI) using a computer-generated list.
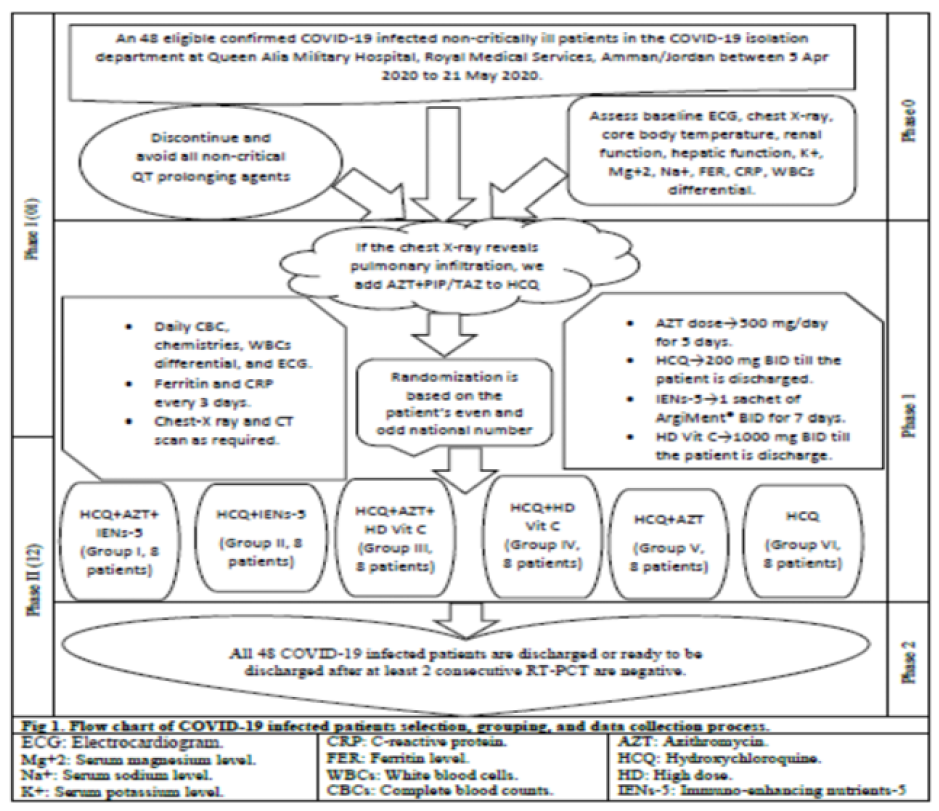
As it is known that both Ferritin: Albumin and Monocyte: Lymphocyte ratios are increased in COVID-19 infection. In our study, we innovated a new indicator combine these two ratios as Ferritin: ALB ratio (FER: ALB) to the reverse Monocyte: Lymphocyte ratio (LMR) and investigated this innovated ratio to reverse ratio (R:rR) dynamically by using the economic indicators of positive Directional Movement Index (+DMI), negative directional movement index and Adjusted Directional Movement Index (ADMI) in order to determine the direction and strength of R:rR trending. Analysis values were compared among the six tested groups by using ANOVA for continuous variables and Chi square test for nominal data in which the continuous variables of all patients were expressed as Mean±SD and nominal data were expressed as numbers with percentages. Tukey Kramer post-hoc multiple comparison analysis was only used for +DMI, – DMI, %∆CRP: ALB 01 and %∆ CRP: ALB 12. All statistical analyses were performed using IBM SPSS ver. 25 (IBM Corp., Armonk, NY, USA), p-values ≤0.05 were considered statistically significant. Flow chart of COVID-19 infected patient’s selection, grouping and data collection process is fully illustrated in Figure 1.
Figure 1: Flowchart Illustrating the Enrollment, Randomization, Treatment Grouping and Data Collection Process for COVID-19 Infected Patients
RESULTS
Our total study population was 48; 79.2% were males and 20.8% were females. The age of the total sample was 31.35±14.67 years. The overall hospital length of stay (LOS) was 9.94±2.15 days with significantly lowest in COVID-19 infected patients who were on HCQ+IENs (Group II) and highest in COVID-19 infected patients who were on HCQ monotherapy without Vit C or IENs (Group VI), 7.50±0.76 days’ vs 12.13±0.84 days, respectively. There were no significant differences in age, sex, body weight, CrCl and Charlson comorbidity indexes between the six tested groups. Although there was insignificant difference between Group I-VI regarding the average core body temperatures from day 4 till discharge day (T2), the variation in T2 (%Tvar2) was significantly lowest in Group I and highest in Group VI, 4.9%±0.7% vs 10.7%2.1%, respectively.
According to our institutional COVID-19 management protocol, if there is radiologically evidence of pulmonary infiltration, Azithromycin (AZT) and Piperacillin/Tazobactam (PIP/TAZ) is simultaneously initiated with HCQ.
In our study, the changes in NLR during phase II (%∆NLR12) was significantly higher in Group II compared with Group I with Mean±SD of -85%±4.8% vs -80%±4.7% in contrast to the other tested groups which are significantly lower in non AZT+PIP/TAZ group (Group IV and Group VI) compared with AZT+PIP/TAZ groups (Group III and Group VI), -37%±4.3% and -17%±3.9% vs -42%±7.3% and -28%±4.4%, respectively.
Dynamically, the +DMI of R: rR is significantly highest in Group VI followed by Group V, Group IV, Group III, Group I and Group II with Mean±SD of 42.13±0.27, 38.28±0.16, 37.89±0.08, 31.29±0.17 and 31.58±0.08, respectively. While the DMI is significantly highest in Group II followed by Group I, Group III, Group IV, Group V and Group VI with Mean±SD of 35.37±0.17, 35.09±0.08, 28.77±0.08, 28.38±0.16 and 24.53±0.27.
All tested groups have up-trending direction except when the IENs is included (Group I and Group II). In case of up-trending direction in Group III-VI, the strength of this direction is stronger in non-Vit C groups (Group V-VI) than Vit C groups (Group III-IV). The baseline and follow-up comparison data of the study’s COVID-19 infected patient’s groups (Group I-VI) are summarized in Tables1-3.
Table 1: Comparison of Baseline and Followed Data Among the Six Tested Groups
Variables
Total
(N = 48)
Group I
(N = 8)
Group II
(N = 8)
Group III
(N = 8)
Group IV
(N = 8)
Group V
(N = 8)
Group VI
(N = 8)
p-value
Age (Yrs)
31.35±14.67
29.50±8.88
30.50±5.39
34.25±22.46
40.25±17.61
20.25±5.12
33.38±15.67
0.142 NS
Sex
F
10 (20.8%)
1 (12.5%)
2 (25.0%)
1 (12.5%)
2 (25.0%)
3 (37.5%)
1 (12.5%)
0.773 NS
M
38 (79.2%)
7 (87.5%)
6 (75.0%)
7 (87.5%)
6 (75.0%)
5 (62.5%)
7 (87.5%)
BW (Kg)
68.24±11.83
67.70±13.95
57.12±16.31
67.00±11.12
72.63±7.52
73.64±5.57
71.38±7.63
0.052 NS
T1 (°C)
38.07±0.75
38.60±0.54
38.02±0.50
37.90±0.50
37.99±0.36
37.69±0.68
38.22±0.47
0.000 S*
%Tvar1
5.1%±3.4%
6.8%±1.4%
6.9%±1.4%
0.9%±0.2%
9.3%±1.6%
0.7%±0.2%
5.9%±1.4%
0.000 S*
T2 (°C)
37.60±0.53
37.51±0.45
37.92±0.49
37.45±0.58
37.49±0.34
37.34±0.66
37.91±0.47
0.106 NS
%Tvar2
6.6%±2.5%
4.9%±0.7%
5.3%±0.3%
5.7%±1.5%
6.1%±1.6%
6.7%±2.4%
10.7%2.1%
0.000 S*
CrCl avg (ml/min)
81.1±20.8
81.5±20.4
84.2±24.7
93.4±24.5
81.1±21.2
70.2±15.7
76.1±14.8
0.351 NS
UO avg (ml/day)
2064±509
2369±474
2062±433
2197±189
2029±195
1852±456
1873±468
0.001 S*
BUN:SCr 1
14.1±2.33
14.9±3.15
15.7±2.44
12.0±0.76
12.7±0.67
13.6±1.52
15.4±1.94
0.001 S*
BUN:SCr 2
16.1±2.7
17.3±3.1
18.3±2.9±
15.7±1.5
14.6±1.6
14.9±1.7
15.7±3.7
0.046 S*
RBC1 (×106 Cells/ml)
3.48±0.27
3.56±0.19
3.48±0.16
3.67±0.08
3.58±0.09
3.45±0.27
3.12±0.34
0.000 S*
Hgb 1 (g/dl)
11.56±1.11
11.72±1.56
11.14±1.28
12.62±0.61
12.03±0.62
11.05±1.84
10.77±2.35
0.000 S*
RBC2 (×106 Cells/ml)
4.39±0.42
4.12±0.13
4.15±0.09
4.19±0.08
5.08±0.49
4.28±0.12
4.54±0.38
0.000 S*
Hgb 2 (g/dl)
12.31±1.38
12.16±1.98
12.44±1.66
13.38±0.48
12.85±0.66
11.73±1.87
11.32±2.35
0.000 S*
CCI
0
38 (79.2%)
4 (50.0%)
8 (100.0%)
6 (75.0%)
6 (75.0%)
6 (75.0%)
8 (100.0%)
0.264
NS
1
5 (10.4%)
3 (37.5%)
0 (0.0%)
1 (12.5%)
1 (12.5%)
0 (0.0%)
0 (0.0%)
2
1 (2.1%)
1 (12.5%)
0 (0.0%)
0 (0.0%)
0 (0.0%)
0 (0.0%)
0 (0.0%)
3
1 (2.1%)
0 (0.0%)
0 (0.0%)
0 (0.0%)
0 (0.0%)
1 (12.5%)
0 (0.0%)
4
1 (2.1%)
0 (0.0%)
0 (0.0%)
0 (0.0%)
0 (0.0%)
1 (12.5%)
0 (0.0%)
5
1 (2.1%)
0 (0.0%)
0 (0.0%)
0 (0.0%)
1 (12.5%)
0 (0.0%)
0 (0.0%)
6
1 (2.1%)
0 (0.0%)
0 (0.0%)
1 (12.5%)
0 (0.0%)
0 (0.0%)
0 (0.0%)
Admission day(s)
9.94±2.15
8.63±0.92
7.50±0.76
9.75±2.25
9.88±1.55
11.75±1.83
12.13±0.84
0.000 S*
Data are presented as either Mean±SD by using ANOVA test or as number (%) by using chi square test (at p-value≤0.05).
Group I: COVID-19 infected patients who are taking Hydroxychloroquine+Azithromycin+Immuno-5, Group II: COVID-19 infected patients who are taking Hydroxychloroquine+Immuno-5, Group III: COVID-19 infected patients who are taking Hydroxychloroquine+Azithromycin+high dose Vit C, Group IV: COVID-19 infected patients who are taking Hydroxychloroquine+High dose Vit C, Group V: COVID-19 infected patients who are taking Hydroxychloroquine+Azithromycin, Group VI: COVID-19 infected patients who are taking Hydroxychloroquine+Azithromycin+Immuno-5.
01: Phase I which encompasses the average data from baseline to the first 3 days after admission, 12: Phase II which encompasses the average data from day 1-3 after admission to day 4-discharge day, 0: Baseline data before the drugwith/without Immuno-5 are initiated, 1: The average first 3 days data, 2: The average data from day 4 to discharge day, BW: Body Weight, T: Temperature, Var: Variation, Avg: Average, BUN: SCr; Blood Urea Nitrogen to Serum Creatinine Ratio, F: Female, M: Male, UO: Urine Output, CrCl: Creatinine Clearance Based on Jelliffe Equation, BUN:S Cr; Blood Urea Nitrogen to Serum Creatinine Ratio, RBC: Red Blood Cells, Hgb: Hemoglobin, CCI: Charlson Comorbidity Index
Table 2: Comparison of Baseline and Followed Data Among the Six Tested Groups
Variables
Total
(N = 48)
Group I
(N = 8)
Group II
(N = 8)
Group III
(N = 8)
Group IV
(N = 8)
Group V
(N = 8)
Group VI
(N = 8)
p-value
NLR 0
3.57±1.23
2.34±0.50
2.56±0.47
4.70±1.79
3.96±0.10
4.11±0.68
3.73±1.06
0.001 S*
NLR 1
9.91±3.18
12.03±2.71
10.98±2.02
12.19±4.65
8.61±1.89
8.88±2.03
6.75±0.26
0.000 S*
NLR 2
4.71±2.21
2.44±0.94
1.76±0.87
6.77±1.78
5.33±0.83
6.37±1.38
5.61±0.45
0.000 S*
%∆NLR 01
223%±219%
471%±305%
372%±269%
163%±69%
118%±46%
120%±58%
92%±42%
0.000 S*
%∆NLR 12
-48%±26%
-80%±4.7%
-85%±4.8%
-42%±7.3%
-37%±4.3%
-28%±4.4%
-17%±3.9%
0.000 S*
MLR 0
0.45±0.15
0.29±0.08
0.32±0.07
0.56±0.22
0.48±0.01
0.52±0.06
0.49±0.09
0.000 S*
MLR 1
0.59±0.19
0.71±0.18
0.63±0.13
0.75±0.28
0.54±0.08
0.53±0.09
0.40±0.03
0.000 S*
MLR 2
0.35±0.16
0.32±0.09
0.27±0.07
0.43±0.13
0.34±0.04
0.39±0.08
0.34±0.04
0.000 S*
%∆MLR 01
59%±129%
192%±199%
129%±176%
35%±33%
12%±15%
2.4%±20%
-18%±10%
0.002 S*
%∆MLR 12
-49%±31%
-86%±8.7%
-93%±8.0%
-41%±6.5%
-37%±4.5%
-26%±5.1%
-14%±5.2%
0.000 S*
PIP/TAZ
Yes
24 (50%)
8 (100%)
0 (0%)
8 (100%)
0 (0%)
8 (100%)
0 (0%)
0.000 S*
No
24 (50%)
0 (0%)
8 (100%)
0 (0%)
8 (100%)
0 (0%)
8 (100%)
Data are presented as either Mean±SD by using ANOVA test or as number (%) by using chi square test (at p-value≤ 0.05).
Group I: COVID-19 infected patients who are taking Hydroxychloroquine+Azithromycin+Immuno-5, Group II: COVID-19 infected patients who are taking Hydroxychloroquine+Immuno-5, Group III: COVID-19 infected patients who are taking Hydroxychloroquine+Azithromycin+high dose Vit C, Group IV: COVID-19 infected patients who are taking Hydroxychloroquine+High dose Vit C, Group V: COVID-19 infected patients who are taking Hydroxychloroquine+Azithromycin, Group VI: COVID-19 infected patients who are taking Hydroxychloroquine+Azithromycin+Immuno-5, 01: Phase I which encompasses the average data from baseline to the first 3 days after admission, 12: Phase II which encompasses the average data from day 1-3 after admission to day 4-discharge day, 0: Baseline data before the drug with/without Immuno-5 are initiated, 1: The average first 3 days data, 2: The average data from day 4 to discharge day, NLR: Neutrophil to Lymphocyte Ratio, MLR: Monocyte to Lymphocyte Ratio, PIP/TAZ: Piperacillin/Tazobactam.
Table 3: Comparison of Baseline and Followed Data Among the Six Tested Groups
Variables
Total
(N = 48)
Group I
(N = 8)
Group II
(N = 8)
Group III
(N = 8)
Group IV
(N = 8)
Group V
(N = 8)
Group VI
(N = 8)
p-value
CRP:ALB 0
7.44±3.66
9.99±5.02
8.28±2.15
4.89±0.60
5.43±0.56
8.25±5.97
7.77±1.66
0.040 S*
CRP:ALB 1
42.36±26.58
33.72±19.22
42.25±16.13
23.46±8.30
31.58±8.91
44.83±26.62
78.32±33.85
0.000 S*
CRP:ALB 2
24.61±21.22
11.16±6.66
12.47±4.88
14.37±4.05
19.02±5.86
31.92±19.06
58.71±24.91
0.000 S*
%∆CRP:ALB 01
472%±272%
222%±163%
384%±171%
366%±120%
473%±94%
531%±283%
858%±266%
0.000 S*
%∆CRP:ALB12
-45.4%±21%
-71.4%±13%
-71.4%±3.8%
-35.9%±12%
-40.0%±1%
-28.9%±4%
-24.7%±1%
0.000 S*
FER:ALB 0
7.44±3.66
9.99±5.02
8.28±2.15
4.89±0.60
5.43±0.56
8.25±5.97
7.77±1.66
0.040 S*
LMR 0
2.53±1.14
3.81±1.55
3.37±1.44
1.91±0.41
2.08±0.03
1.95±0.26
2.07±0.37
0.000 S*
R:rR 0
3.17±1.35
3.12±1.67
2.81±0.98
2.68±0.66
2.61±0.27
4.05±2.41
3.74±0.19
0.156 NS
FER:ALB 1
42.36±26.58
33.72±19.22
42.25±16.14
23.46±8.30
31.58±8.91
44.83±26.62
78.32±33.85
0.000 S*
LMR 1
1.82±0.46
1.48±0.31
1.63±0.24
1.47±0.43
1.89±0.25
1.96±0.37
2.49±0.15
0.000 S*
R:rR 1
21.97±9.67
20.93±10.53
24.81±8.76
16.19±4.94
16.96±4.88
22.22±8.88
30.72±12.18
0.021 S*
FER:ALB 2
24.61±21.22
11.18±6.67
12.47±4.88
14.37±4.04
19.03±5.88
31.90±19.00
58.73±24.93
0.000 S*
LMR 2
2.97±1.19
3.08±2.39
3.71±2.23
2.44±0.53
2.99±0.38
2.66±0.64
2.94±0.34
0.055 NS
R:rR 2
6.69±2.23
3.63±1.85
3.36±1.45
5.92±1.21
6.33±1.47
11.62±4.07
19.33±6.72
0.000 S*
+DMI
38.06±5.66
31.29±0.17
31.58±0.08
37.89±0.08
38.28±0.16
42.13±0.27
47.15±0.98
0.000 S*
-DMI
28.61±5.66
35.09±0.08
35.37±0.17
28.77±0.08
28.38±0.16
24.53±0.27
19.52±0.98
0.000 S*
ADMI
17.96±12.79
6.12±0.51
5.26±0.23
13.68±0.23
14.85±0.49
26.40±0.81
41.44±2.93
0.000 S*
Trending Direction and Strength
DT_S
0 (0.0%)
0 (0.0%)
0 (0.0%)
0 (0.0%)
0 (0.0%)
0 (0.0%)
0 (0.0%)
DT_M
0 (0.0%)
0 (0.0%)
0 (0.0%)
0 (0.0%)
0 (0.0%)
0 (0.0%)
0 (0.0%)
DT_W
16 (33.3%)
8 (100.0%)
8 (100.0%)
0 (0.0%)
0 (0.0%)
0 (0.0%)
0 (0.0%)
UT_S
16 (33.3%)
0 (0.0%)
0 (0.0%)
0 (0.0%)
0 (0.0%)
8 (100.0%)
8 (100.0%)
UT_M
0 (0.0%)
0 (0.0%)
0 (0.0%)
0 (0.0%)
0 (0.0%)
0 (0.0%)
0 (0.0%)
UT_W
16 (33.3%)
0 (0.0%)
0 (0.0%)
8 (100.0%)
8 (100.0%)
0 (0.0%)
0 (0.0%)
Data are presented as either Mean±SD by using ANOVA test or as number (%) by using chi square test (at p-value≤ 0.05).
Group I: COVID-19 infected patients who are taking Hydroxychloroquine+Azithromycin+Immuno-5, Group II: COVID-19 infected patients who are taking Hydroxychloroquine+Immuno-5, Group III: COVID-19 infected patients who are taking Hydroxychloroquine+Azithromycin+high dose Vit C, Group IV: COVID-19 infected patients who are taking Hydroxychloroquine+High dose Vit C, Group V: COVID-19 infected patients who are taking Hydroxychloroquine+Azithromycin, Group VI: COVID-19 infected patients who are taking Hydroxychloroquine+Azithromycin+Immuno-5, 01: Phase I which encompasses the average data from baseline to the first 3 days after admission, 12: Phase II which encompasses the average data from day 1-3 after admission to day 4-discharge day.
CRP: C-Reactive Protein, ALB: Albumin Level, CRP: ALB: C-Reactive Protein to Albumin Ratio, %∆CRP: ALB: Percent Changes of C-Reactive Protein to Albumin Ratio, +DMI: Positive Directional Movement Index, -DMI: Negative Directional Movement Index, ADMI: Adjusted Directional Movement Index, MLR: Monocyte to Lymphocyte Ratio, LMR: Lymphocyte to Monocyte Ratio, FER: Ferritin Level, FER: ALB; Ferritin to Albumin Ratio, R:rR: Ratio to Reverse Ratio, R: Ferritin to Albumin Ratio, rR: Lymphocyte to Monocyte Counts Ratio, DT: Down-Trending, UT: Up-Trending, S: Strong, M: Moderate, W: Weak.
DISCUSSION
Glutamine and L-Arginine can be classified as a conditionally Essential Amino Acid (EAAs) in case of stress conditions like COVID-19 status. Both conditionally EAAs requirements seem to surpass the synthesis capacity of mammalian body thus leading to lower plasma and intracellular concentrations [17]. T cells are highly sensitive to nutritional state and T cell dysfunction is related to acute nutritional deficiencies [18]. A cochrane meta-analysis concluded there was moderate evidence that glutamine supplementation could reduce the infection rate and days on mechanical ventilation in critically ill or surgical patients [19]. Interestingly, many pulmonary disease and infections are associated with increased arginase activity and an arginine deficiency and arginine levels could be 41% less than normal controls [17,20].
Moving to micronutrient role in infections and particularly viral infections. Strong immune responses need adequate level of micronutrients. Zinc, copper, vitamin A, vitamin D, vitamin C, vitamin E and other trace elements and vitamins, all of them are described as micronutrient. Many of them are important to derive an effective immune response [21]. Innate immune defenses, including phagocytosis, natural killer cell activity, cytokine production and complement pathway activation, require adequate zinc levels [22]. Low zinc levels are often reported in elderly individuals, which may increase their susceptibility to infectious pathogens and increase the risk of pneumonia and mortality [23]. Cell culture studies found that increased levels of zinc ions intracellularly inhibits replication of RNA-viruses [24]. Deficient states of copper are usually also associated with deficiencies in other important trace elements like zinc. Such a deficiency can manifest as reduced IL-2 and decreased T-cell proliferation. As a result, this can lead to ineffective immune response to infections, as well as, increased viral virulence which is concerning during a time of a viral pandemic [25]. In large meta-analysis of 30 randomized clinical trials, vitamin C has revealed benefits in prevention of viral respiratory tract infections such as common cold especially in cold stress subjected patients. Vitamin C strengthens the neutrophil and monocytes activity. Plus, it has antioxidant effects and increase glutathione production [26].
Acute Phase Reactants (APRs) are inflammatory markers and mediators that either increase or decrease in case of tissue damage or inflammatory state. If they increase, they are classified positive APRs and if decrease then negative APRs. Positive APRs mostly includes C- Reactive Protein (CRP) and FER. Negative APR mostly includes albumin, transferrin and retinol binding protein [27]. Mentioning that CRP has higher sensitivity than ESR toward inflammatory status we can rely on CRP to determine and predict the severity of hyperinflammatory-cytokines conditions, especially when it is indexed to serum albumin (CRP: ALB) [28,29]. A linear relationship between ferritin concentration and acute phase reactants is seen in inflammatory status but presence of iron dysregulated metabolism pathway as seen in COVID-19 FER: ALB can be deviated from CRP: ALB. High CRP: ALB, FER:ALB, all indicates poor prognosis and can predict progression to critical illness in COVID-19 [30].
As previously mentioned, the R: rR combines four variables and two ratios in one indicator. The aim of this innovated combining is to assess the clinical impacts of the tested pharmacological and nutritional therapies on COVID-19 and to track these impacts dynamically by investigating the directional trending of this R: rR and its strength. In our study, all tested patients are non-critically ill and the overall sample size is small to statistically detect the clinical impacts of investigational therapies on the tested variables. By combining the clinically related variables and calculating the trending and its strength, we may sense the differences dynamically regardless it is clinically significant or insignificant. Generally, as the DMI is increased, its trending strength is increased and if the + DMI is higher than - DMI, the trending is up and vice versa. In our study, we divided the admission days into two phases, before the 4th day of admission (Phase I) or not (Phase II). So, as the +DMI of R:rR is increased, the Systemic Inflammatory Response Syndrome (SIRS) is higher than the Compensatory Anti-Inflammatory Response Syndrome (CARS) and the COVID-19 infected patients clinical status is at least dynamically worsed. In contrast, as the -DMI of R:rR is increased, the CARS is higher than the SIRS and the CONID-19 infected patients is at least dynamically improved. In this study, the lowest statistically significant Mean difference±SEM of +DMI is between Group I vs Group VI (-15.85±0.21) followed by Group I vs Group V (-10.84±0.21), Group I vs Group IV (-6.99±0.21) and Group I vs Group III (-6.59±0.21). while in case of -DM, the highest statistically significant Mean difference±SEM is between Group I vs Group VI (+15.85±0.21) followed by Group I vs Group V (+10.84±0.21), Group I vs Group IV (+6.99±0.21) and Group I vs Group III (+6.59±0.21). Regarding %∆CRP: ALB12, it is relatively followed the same pattern and sequence of DMI with Mean difference±SEM of-46.81%±3.77%, -42.59%±3.77%, -35.58%±3.77%, and-31.42%±3.77% for Group I vs Group VI followed by Group I vs Group V, Group I vs Group III and Group I vs Group IV. The Multiple comparisons for +DMI/- DMI of R: rR and %∆CRP: ALB during phase I and II across Group I-VI are fully illustrated in Table 4.
Table 4: Multiple Comparisons for +DMI/- DMI of R: rR and %∆CRP:ALB During Phase I and II Across Group I-VI
+ DMI
Group I
Group II
-0.29±0.21 (NS)
% ∆ CRP:ALB 01
Group I
Group II
-162.51%±97.85% (NS)
Group III
-6.59±0.21(S*)
Group III
-144.69%±97.85% (NS)
Group IV
-6.99±0.21 (S*)
Group IV
-251.21%±97.85% (NS)
Group V
-10.84±0.21 (S*)
Group V
-309.18%±97.85% (S*)
Group VI
-15.85±0.21 (S*)
Group VI
-636.44%±97.85% (S*)
Group II
Group III
-6.31±0.21 (S*)
Group II
Group III
17.82%±97.85% (NS)
Group IV
-6.70±0.21 (S*)
Group IV
-88.71%±97.85% (NS)
Group V
-10.55±0.21 (S*)
Group V
-146.68%±97.85% (NS)
Group VI
-15.57±0.21 (S*)
Group VI
-473.93%±97.85% (S*)
Group III
Group IV
-0.39±0.21 (NS)
Group III
Group IV
-106.52%±97.85% (NS)
Group V
-4.24±0.21 (S*)
Group V
-164.49%±97.85% (NS)
Group VI
-9.25±0.21 (S*)
Group VI
-491.75%±97.85% (S*)
Group IV
Group V
-3.85±0.21 (S*)
Group IV
Group V
-57.97%±97.85% (NS)
Group VI
-8.86±0.21 (S*)
Group VI
-385.23%±97.85% (S*)
Group V
Group VI
-5.01±0.21 (S*)
Group V
Group VI
-327.26%±97.85% (S*)
- DMI
Group I
Group II
0.29±0.21 (NS)
% ∆ CRP:ALB 12
Group I
Group II
-0.06%±3.77% (NS)
Group III
6.59±0.21(S*)
Group III
-35.58%±3.77% (S*)
Group IV
6.99±0.21 (S*)
Group IV
-31.42%±3.77% (S*)
Group V
10.84±0.21 (S*)
Group V
-42.59%±3.77% (S*)
Group VI
15.85±0.21 (S*)
Group VI
-46.81%±3.77% (S*)
Group II
Group III
6.31±0.21 (S*)
Group II
Group III
-35.52%±3.77% (S*)
Group IV
6.70±0.21 (S*)
Group IV
-31.36%±3.77% (S*)
Group V
10.55±0.21 (S*)
Group V
-42.54%±3.77% (S*)
Group VI
15.57±0.21 (S*)
Group VI
-46.76%±3.77% (S*)
Group III
Group IV
0.39±0.21 (NS)
Group III
Group IV
4.16%±3.77% (NS)
Group V
4.24±0.21 (S*)
Group V
-7.02%±3.77% (NS)
Group VI
9.25±0.21 (S*)
Group VI
-11.24%±3.77% (NS)
Group IV
Group V
3.85±0.21 (S*)
Group IV
Group V
-11.18%±3.77% (NS)
Group VI
8.86±0.21 (S*)
Group VI
-15.39%±3.77% (S*)
Group V
Group VI
5.01±0.21 (S*)
Group V
Group VI
-4.22%±3.77% (NS)
Data are presented as Mean differences ±SEM and are analyzed by using Tukey Kramer post-hoc multiple comparison analysis.
Group I: COVID-19 infected patients who are taking Hydroxychloroquine+Azithromycin+Immuno-5, Group II: COVID-19 infected patients who are taking Hydroxychloroquine+Immuno-5, Group III: COVID-19 infected patients who are taking Hydroxychloroquine+Azithromycin+high dose Vit C, Group IV: COVID-19 infected patients who are taking Hydroxychloroquine+High dose Vit C, Group V: COVID-19 infected patients who are taking Hydroxychloroquine+Azithromycin, Group VI: COVID-19 infected patients who are taking Hydroxychloroquine+Azithromycin+Immuno-5, 01: Phase I which encompasses the average data from baseline to the first 3 days after admission, 12: Phase II which encompasses the average data from day 1-3 after admission to day 4-discharge day, +DMI: Positive Directional Movement Index, -DMI: Negative Directional Movement Index, R:rR: Ratio to Reverse Ratio, R: Ferritin to Albumin Ratio, rR: Lymphocyte to Monocyte Counts Ratio, %∆CRP: ALB: Percent Changes of C-Reactive Protein to Albumin Ratio
CONCLUSION
Since there is no approved effective coronavirus drug therapy or vaccine, any potentially beneficial intervention should be made for COVID-19 patients. In our study, we conclude that the existing approved COVID-19 drugs of Hydroxychloroquine with or without Azithromycin is likely ineffective without our immune system support and the IENs likely improve the clinical outcomes at least dynamically in the worst scenario. Since the economic situations worldwide are on edge and the pressure on health care systems’ resources is increasing day by day it is important to using IENs in an attempt to restore the positivity and hope to our lives.
REFERENCES
Yi, Y. et al. “COVID-19: What has been learned and to be learned about the novel coronavirus disease.” International Journal of Biological Sciences, vol. 16, no. 10, 2020, pp. 1753–1766, https://doi.org/10.7150/ijbs.45134.
Thiel, V. et al. “Mechanisms and enzymes involved in SARS coronavirus genome expression.” Journal of General Virology, vol. 84, 2003, pp. 2305–2315, https://doi.org/10.1099/vir.0.19424-0.
Prompetchara, E. et al. “Immune responses in covid-19 and potential vaccines: Lessons learned from SARS and MERS epidemic.” Asian Pacific Journal of Allergy and Immunology, 2020, https://doi.org/10.12932/AP-200220-0772.
Warimwe, G.M. et al. “The ratio of monocytes to lymphocytes in peripheral blood correlates with increased susceptibility to clinical malaria in Kenyan Children.” PLoS ONE, vol. 8, no. 2, 2013, https://doi.org/10.1371/journal.pone.0057320.
Velavan, T.P. and C.G. Meyer. “Mild versus severe COVID-19: Laboratory markers.” International Journal of Infectious Diseases, 2020, https://doi.org/10.1016/j.ijid.2020.04.061.
Corral, J. et al. “COVID-19 Polymerase chain reaction testing before endoscopy: An economic analysis.” Gastrointestinal Endoscopy, 2020, https://doi.org/10.1016/j.gie.2020.04.049.
Kalantar-Zadeh, K. et al. “Serum ferritin is a marker of morbidity and mortality in hemodialysis patients.” American Journal of Kidney Diseases, vol. 37, no. 3, 2001, pp. 564–572, https://doi.org/10.1159/000478735.
Chakraborty, B. et al. “Lipoprotein(a), ferritin and albumin in acute phase reaction predict severity and mortality of acute ischemic stroke in north Indian patients.” Journal of Stroke and Cerebrovascular Diseases, vol. 22, no. 7, 2013, pp. e159–e167, https://doi.org/10.1016/j.jstrokecerebrovasdis.2012.10.013.
Tan, L. et al. “Lymphopenia predicts disease severity of covid-19: A descriptive and predictive study.” Signal Transduction and Targeted Therapy, vol. 5, no. 1, 2020, https://doi.org/10.1038/s41392-020-0148-4.
Haschka, D. et al. “Classical and intermediate monocytes scavenge non-transferrin-bound iron and damaged erythrocytes.” JCI Insight, vol. 4, no. 8, 2019, https://doi.org/10.1172/jci.insight.98867.
Yang, A. et al. “The diagnostic and predictive role of NLR, D-NLR and PLR in covid-19 patients.” International Immunopharmacology, vol. 84, 2020, pp. 106504, https://doi.org/10.1016/j.intimp.2020.106504.
Goh, K.J. et al. “Rapid progression to acute respiratory distress syndrome: Review of current understanding of critical illness from COVID-19 infection.” Annals of the Academy of Medicine, Singapore, 2020. Available at https://www.ncbi.nlm.nih.gov/pubmed/32200400.
Thijs, L.G. and C.E. Hack. “Time course of cytokine levels in sepsis.” Intensive Care Medicine, vol. 21, suppl. 2, 1995, https://doi.org/10.1007/BF01740764.
Morris, C.R. et al. “Acquired amino acid deficiencies: A focus on arginine and glutamine.” JPEN Journal of Parenteral and Enteral Nutrition, 2017, https://doi.org/10.1177/0884533617691250.
Ma, X. et al. “Protective Effects of functional amino acids on apoptosis, inflammatory response and pulmonary fibrosis in lipopolysaccharide-challenged mice.” Journal of Agricultural and Food Chemistry, vol. 67, no. 17, 2019, pp. 4915–4922.
McRae, M. “Therapeutic benefits of glutamine: An umbrella review of meta-analyses.” Biomedical Reports, vol. 6, no. 5, 2017, pp. 576–584.
Li, P. et al. “Amino acids and immune function.” British Journal of Nutrition, vol. 98, no. 2, 2007, pp. 237–252.
Gombart, A. et al. “A review of micronutrients and the immune system—Working in harmony to reduce the risk of infection.” Nutrients, vol. 12, no. 1, 2020, p. 236.
Gao, H. et al. “The Role of Zinc and Zinc Homeostasis in Macrophage Function.” Journal of Immunology Research, 2018, pp. 1–11.
Meydani, S. et al. “Serum zinc and pneumonia in nursing home elderly.” The American Journal of Clinical Nutrition, vol. 86, no. 4, 2007, pp. 1167–1173.
Te Velthuis, A.J.W. et al. “Zn²⁺ Inhibits coronavirus and arterivirus RNA polymerase activity in vitro and zinc ionophores block the replication of these viruses in cell culture.” PLoS Pathogens, 2010, https://doi.org/10.1371/journal.ppat.1001176.
Alpert, P. “The role of vitamins and minerals on the immune system.” Home Health Care Management & Practice, vol. 29, no. 3, 2017, pp. 199–202.
Kim, M.H. et al. “The C-reactive protein/albumin ratio as an independent predictor of mortality in patients with severe sepsis or septic shock treated with early goal-directed therapy.” PLoS ONE, vol. 10, no. 7, 2015.
Ho, K.M. et al. “C-Reactive protein concentration as a predictor of intensive care unit readmission: a nested case-control study.” Journal of Critical Care, vol. 21, no. 3, 2006, pp. 259–265, https://doi.org/10.1016/j.jcrc.2006.01.005.
Villacorta, H. et al. “C-reactive protein: An inflammatory marker with prognostic value in patients with decompensated heart failure.” Arquivos Brasileiros de Cardiologia, vol. 88, no. 5, 2007, pp. 585–589, https://doi.org/10.1590/S0066-782X2007000500014.
Artero, A. et al. “Prognostic factors of mortality in patients with community-acquired bloodstream infection with severe sepsis and septic shock.” Journal of Critical Care, vol. 25, no. 2, 2010, pp. 276–281, https://doi.org/10.1016/j.jcrc.2009.12.004.
Recommended Articles
Research Article
It Remains Unproven That the Variant M.8231C>A Causes Coronary Atherosclerosis
Finsterer J
Published: 15/07/2020
Download PDF
Research Article
Vision for a Brighter Kangra: Unmasking the Truth about Pink Eye – A Comprehensive Study on Types, Symptoms, and Proactive Prevention in Himachal Pradesh’s Kangra District
Deepti ,
...
Garima
Published: 11/11/2023
Download PDF
Research Article
Leigh Syndrome Should Not Be Diagnosed Exclusively Upon Cerebral MRI
Finsterer J
Published: 15/07/2020
Download PDF
Research Article
Bioactive ingredients screening and antibacterial activity of Citrus aurantifolia leaf extract against some enteric isolates
Abdallah M.S,
Kabiru Sama’ila
Published: 10/08/2020
Download PDF
PO Box 101, Nakuru
Kenya.
Email: office@iarconsortium.org
Editorial Office:
J.L Bhavan, Near Radison Blu Hotel,
Jalukbari, Guwahati-India
Younes, ". N. M. B., Obeidat, M. A. & Abeeleh, J. A. A. A. (2020). The Clinical Impacts of Immuno-Enhancing Nutrients-5 Novel Combination for Covid-19 Infection. IAR Journal of Medical Sciences, 1(1), 1-7.
MLA
Younes, "Moh'd N. M. B., Mohammed A. Obeidat and Jaafar A. A. A. Abeeleh. "The Clinical Impacts of Immuno-Enhancing Nutrients-5 Novel Combination for Covid-19 Infection." IAR Journal of Medical Sciences 1.1 (2020): 1-7.
Chicago
Younes, "Moh'd N. M. B., Mohammed A. Obeidat and Jaafar A. A. A. Abeeleh. "The Clinical Impacts of Immuno-Enhancing Nutrients-5 Novel Combination for Covid-19 Infection." IAR Journal of Medical Sciences 1, no. 1 (2020): 1-7.
Harvard
Younes, ". N. M. B., Obeidat, M. A. and Abeeleh, J. A. A. A. (2020) 'The Clinical Impacts of Immuno-Enhancing Nutrients-5 Novel Combination for Covid-19 Infection' IAR Journal of Medical Sciences 1(1), pp. 1-7.
Vancouver
Younes "NMB, Obeidat MA, Abeeleh JAAA. The Clinical Impacts of Immuno-Enhancing Nutrients-5 Novel Combination for Covid-19 Infection. IAR Journal of Medical Sciences. 2020 Jan;1(1):1-7.


 Download PDF
 Download XML