With the increasing importance of the digital economy, digital services trade has become a new focus of international trade competition. Based on the analysis of the current situation of global digital trade, this paper constructs an evaluation index system and uses the data of the DTE database to empirically measure the barriers to digital services trade of 34 countries. The research finds that the digital trade barriers of developing countries are stronger than those of developed countries and the level of barriers to cross-border data flows is increasing especially in BRICS.
Keywords
Digital Services Trade
Barriers to Cross-Border Data Flows
Data Limitation Index
INTRODUCTION
As the digital transformation of the global economy accelerates, the scale of digital services trade is growing rapidly and playing an increasingly important role in the development of the national economy. Digital services are distributed among the rest of the economy, their results can reconfigure traditional business models, enhance total factor productivity, promote industrial transformation and upgrading and give rise to more jobs [1]. According to statistics, in 2019, the world's digital services trade exported $3,192.59 billion, accounting for more than 50% of the services trade, with a growth rate of 3.75%, exceeding the growth rate of the world economy by 1.45% points in the same period, playing a vital role in promoting economic recovery and reshaping the country's competitive advantage. However, the use of data is also accompanied by problems such as leakage of personal information [2], transfer of national critical infrastructure data abroad and possible "economies of scale" arising from data centralization [3-5], some countries have erected barriers to digital trade, especially to cross-border data flows. The barriers to cross-border data flows constituted by data flow restriction measures are an important component of digital trade barriers in services. The existence of barriers to digital services trade restricts the rapid development of the global digital services trade. This paper aims to measure the barriers to digital services trade in major economies using an empirical approach to provide a basis for global digital services trade-related negotiations.
Global Digital Services Trade Development Status
The U.S. has the World's Largest Digital Services Trade Scale: In terms of export scale, global digital service trade exports showed an upward trend from 2011 to 2019, with a wide gap in export scale among different countries (Figure 1). Among them, the United States has a favorable situation in the field of digital services trade that is difficult to be surpassed by the rest of the countries and its digital services exports have been ranked first in the world during 2011-2019, far exceeding those of the United Kingdom and France. In 2019, China’s digital services export scale is closer to that of France, Japan and India and there is still a large gap with the United States, the United Kingdom and Germany but in general, after 10 years of development, China’s competitive strength has been increasing. From the perspective of different country categories, the digital trade exports of developed countries such as the U.S., Britain, Germany and Japan are significantly higher than those of China, Russia, Brazil and India. The developed economies are capital-rich, technologically advanced and have high-quality human capital, which is very suitable for the development environment required by the knowledge-intensive and capital-intensive digital services industry.
Figure 1: Digital Services Trade Exports of Major Global Economies, 2011-2019 ($ million)
Data Source: Based on data from the UNCTAD database
China’s Global Digital Services Trade Exports Grow Fastest
Countries with more developed traditional economies are developing more rapidly in digital services trade and BRICS countries, especially China and India, have also achieved significant growth. In the past 11 years, China’s export of digital services trade has increased by about three times. In 2008, China’s digital services trade exports were only $49.718 billion, while in 2019 it had grown to US$143.548 billion, one of the highest growth rates in the world. India’s digital services trade exports in 2019 were $149.226 billion, up to 86% from 2008. Comparing the development of digital services trade in the world’s major economies from 2008 to 2019, countries can be classified into four digital services trade growth rates, namely “Deep Development”, “Fast Development”, “Gradual Development” and “To Be Strengthened”, according to the growth rate of their digital services trade exports (Table 1). Nine countries, including China, Ireland and Poland have grown by more than 72% over the past 11 years, are “Deep development” countries; nine countries, including the United States, Estonia and the Czech Republic, are “Fast Development” countries with more developed economies; nine countries, including France, Austria and Denmark, are “Gradual Development” countries, especially the UK and France, whose past development of digital services trade is not ideal and seven countries, including Portugal, Latvia and Chile, whose development of digital services trade exports needs to be strengthened.
Countries have Different Aspirations for the Rules Construction of Digital Services Trade
Zhao [6] found that barriers to cross-border data flows show a trend of gradual increase and are significantly stronger in developing countries than in developed countries. Diverse forms of digital domestic restrictions are the cause of barriers to digital services trade. Countries can be divided according to their attitudes towards data restrictions: firstly, countries represented by the US, which support data flows as much as possible; secondly, countries represented by the EU, which advocate for reducing intraregional barriers and thirdly, countries represented by China, which impose strict regulation on data. The US has been the leading force behind the moratorium on taxation of cross-border data flows under the WTO framework and its policy attitude is closely linked to its interests.
The US is a global economic leader but as its domestic market is relatively saturated, its continued leadership in this area depends on access to the fastest-growing markets and an unrestricted environment for data flows and a global open digital trade policy environment is conducive to US internet companies entering emerging markets and gaining a competitive position. The EU’s digital trade policy takes a “data protection” approach. EU member states recognize that the Digital Single Market will enable them to pool resources, reduce barriers to data flows within Europe, share governance and create economic benefits while ensuring the protection of personal data. For other countries outside the EU, the EU is committed to using trade agreements to set rules for cross-border data flows and has adopted the General Data Protection Regulation to address new forms of digital protectionism.
International Rule System for Digital Trade in Services to be Explored
The underdeveloped regulatory framework at the international level leaves more space for countries to implement barriers to digital services trade. Currently, although an increasing number of regional and bilateral trade agreements are negotiating rules on trade in digital services, there is more disagreement than consensus among countries, failing to reach a unified system of trade rules [7,8]. WTO and GAT rules have failed to achieve the role of taking the lead and providing clear guidance, making it particularly difficult to achieve grievance resolution under the international framework settlement mechanism [9,10]. Countries led by the US and the EU are actively leading the formation of regional international digital trade rules, attempting to form a world system of digital services trade rules based on 'American' or 'European' trade rules by expanding the number of digital trade agreements signed with other countries [11], to integrate their demands into global digital trade rules. Most countries are relatively cautious in signing regional trade agreements involving trade in services with provisions on cross-border data flows and data localization [12]. Together, these issues have led to a sharp rise in barriers to digital services trade, mainly represented by barriers to cross-border data flows and exploring the construction of an international rule system for digital services trade has become a frontline issue in the trade field.
Table 1: Global Digital Services Trade Export Growth Rates 2008-2019
Country
Export Value in 2008
($ million)
Export Value in 2019
($ million)
Growth rate (%)
Development gradient (Ranking)
China
49717.841
143547.6432
189
Deep Development (Top 25%)
Ireland
78077.148
214154.9152
174
Poland
10776.3494
28907.28107
168
Korea
19408.6
41814.62085
115
Luxembourg
55654.336
103957.1529
87
India
80191.181
149226.398
86
Belgium
41543.716
76473.237
84
Japan
66546.7
117331.7956
76
Slovakia
2611.561
4510.780506
73
United States
313007
533939
71
Fast Development (25-50%)
Estonia
1698.902298
2896.775298
71
Czech Republic
7371.763919
12376.79044
68
Germany
129250.334
203626.4202
58
Hungary
7841.036044
12053.52078
54
Sweden
33381.60707
50205.18885
50
Finland
15122.277
22742.89992
50
Slovenia
1836.501
2722.325392
48
Australia
12204.6
17906.85001
47
France
104373.557
152304.9099
46
Gradual Development (50%-75%)
Austria
22238.957
30782.85265
38
Denmark
15645.97493
21118.96671
35
Brazil
16023.844
21507.071
34
New Zealand
2462.1
3273.220012
33
Switzerland
62961.586
82063.459
30
South Africa
2941.987
3809.707
29
Canada
43789.3
56637.38863
29
United Kingdom
239961.5785
308404.5033
29
Portugal
6512.037
8333.177407
28
To be strengthened (75-100%)
Latvia
1837.198
2333.213074
27
Chile
2336.8
2965.2446
27
Russia
19291.19
21439.14593
11
Italy
45465.358
48529.36323
7
Greece
4195.466
4443.193711
6
Norway
16602.644
17127.251
3
Source: Based on data from the UNCTAD database
Measurement of Barriers to Digital Services Trade
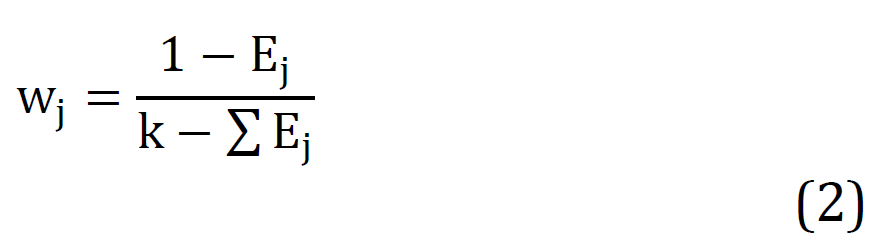
Measurement Methods and Data Resources: The current measurement of barriers to digital services trade is mainly based on two quantitative indicators, the Digital Trade Restrictiveness Index (DTRI) of ECIPE and the Digital Services Trade Restrictiveness Index (STRI) of OECD. Based on ECIPE's identification of restrictive measures on digital services trade, this paper further identifies restrictive measures according to data localization defined by USTR and data restriction defined by ECIPE, evaluate the level of barriers to cross-border data flows in different countries by collecting comparable information on relevant policies of data restriction between countries. The entropy method is used to determine the objective weight of the index by calculating the index variability. Generally, the lower the entropy value of an indicator, the greater the variability it is, the greater the role it can play in the overall assessment and the greater the indicator weight. Conversely, the higher the entropy value of the indicator, the lower the variability it is and the lower the corresponding weight. In terms of specific operations, firstly, the data should be standardised and since all indicators take values in [0, 1], the indicators should be normalized and then the information entropy of each indicator should be calculated with the formula:
Table 2: System of Data Restriction Index
Tier 1 indicators (weighting)
Tier 2 indicators (weighting)
Data limits (0.07)
Prohibition of data transfer or requirements relating to local processing (0.17)
Local storage requirements (0.19)
Conditional mobility mechanism (0.21)
Minimum data retention period (0.07)
Maximum data retention period (0.36)
Data privacy management (0.19)
Burdensome consent requirements for privacy subjects (0.27)
The right of privacy subjects to be forgotten(0.11)
Data protection impact assessment (0.19)
Data Protection Officer (0.15)
Data breach notification (0.15)
Government access to personal data (0.13)
Platform intermediary liability (0.18)
Safety liability agreement (0.03)
User identity requirements (0.26)
Monitoring requirements (0.33)
Are the notice and removal provisions too onerous (0.15)
Financial penalties for notification of non-compliance (0.23)
Network review (0.19)
Blocking web content (0.29)
Filtering web content (0.20)
Discriminatory use of licensing systems (0.51)
Broadband and net neutrality (0.15)
Deliberate slowing down of foreign sites (0.25)
Set network broadband priority for certain content (0.19)
Restriction rules for cloud computing (0.28)
Specific provisions for social networks (0.28)
Localised content (0.21)
Localised content requirements for business services (0.5)
Public procurement localisation content requirements (0.5)
where, i denotes the i-th sample, j denotes the j-th indicator, pij denotes the weight of the role played by the i-th sample in the j-th indicator and finally, the weight of each indicator is determined by the entropy value:
where, k is the total number of indicators. The final measures of barriers to digital services trade for each country and their weights are shown in Table 2. The data restriction index takes values in the range [0, 1], where a value of "0" means that the data flow is completely open and a value of "1" means completely restricted, with higher values representing higher levels of data flow restrictions.
This paper measures 34 countries' data restriction indices from 2008-2019 to compare their level of barriers to cross-border data flows, including 29 OECD countries and 5 BRICS countries: The OECD organization consists of 38 market economies, whose total digital services trade exports accounted for over 60% of the world's total exports in 2019; digital services trade in BRICS countries such as China and India has also grown relatively rapidly this year. Given the completeness of the data, nine countries with more serious trade data deficiencies were removed[1], leaving a final measurement range of 34 countries. At the same time, the ECIPE index system was used to measure three types of indices: Fiscal and market access limitation index, establishment restriction index and trade restriction index for comparative analysis. Information on digital trade restrictions implemented by countries was obtained from the Digital Trade Estimates (DTE) database, which covers all digital services trade measures implemented in the past in 64 economies.
ANALYSIS OF MEASUREMENT RESULTS
Developing Countries have more Stringent Restrictions on Trade Services: Overall, barriers to cross-border data flows in BRICS countries are generally higher than those in developed countries, with the top five countries ranked in the Data Restriction Index being all BRICS countries. In 2019, China's data restriction index reached 0.8717, ranking the country with the most restrictive measures on data flow, followed by India with 0.6126 and Latvia with the lowest restrictive index. National security has been a primary consideration in the implementation of China's policies and the country's underdeveloped market economy, laws and regulations increase the likelihood of its being compromised, hence China's preference for high data restrictions. India is attempting to bend the curve and break the bottleneck of domestic economic development through domestic digital economy development and innovation. The United States advocates reducing barriers to cross-border data flows, which helps the development of digital trade in the US, with a data restriction index of 0.2282. The UK, France and Germany tend to implement stricter data policies, seeking to ensure the protection of personal data while creating economic benefits, with their data restriction index ranging from 0.1 to 0.2 (Figure 2).
Digital Trade Barriers in Countries Other Than the US Show an Upward Trend
Table 3 shows that the global level of barriers to cross-border data flows has gradually increased since 2008, with its growth rate in emerging countries far exceeding developed countries. The level of barriers to cross-border data flows has increased at a compound average rate of 168.07 and 146.26% in Brazil and Austria from 2008-2019 and they are gradually increasing the regulatory measures imposed on data. Austria, France, the UK, Switzerland, Hungary, Poland, Slovakia, Finland, etc., although the average growth rate is high, the overall level of barriers to cross-border data flows is still low up to 2019. Probably due to national security protection considerations, China enacted relevant regulatory measures earlier, resulting in a higher level of barriers than other countries already in 2008, while the growth has slowed down since then, with an average annual growth rate of 96.86%. The US, on the other hand, has a compound average growth rate of -83.03%, with increasingly lax regulation of data flows.
Figure 2: Data Restriction Index for Major Countries in the World in 2019
Data source: Calculated and compiled in this paper
Table 3: Data Restriction Index and Annual Growth Rate of Major Countries in 2008-2019
Country
2008
2019
Average annual growth rate
Country
2008
2019
Average annual growth rate
Brazil
0
0.3032
168.07%
Denmark
0.0236
0.1155
113.15%
Austria
0
0.0665
146.26%
Norway
0.0054
0.0263
113.09%
India
0.0103
0.6126
144.76%
Korea
0.0718
0.2811
110.21%
France
0.0054
0.1516
134.97%
Chile
0.0049
0.0168
108.40%
Greece
0.0103
0.2621
133.72%
Germany
0.0738
0.1891
104.14%
Australia
0.0147
0.3004
130.96%
Luxembourg
0.0103
0.025
103.29%
UK
0.0054
0.1034
130.15%
Italy
0.0553
0.1157
100.81%
Russia
0.0247
0.3651
126.93%
Ireland
0.0054
0.0103
99.12%
South Africa
0.0339
0.3736
123.31%
Czech Republic
0.0054
0.0103
99.12%
Switzerland
0.0103
0.1093
122.84%
China
0.5115
0.8717
96.86%
Hungary
0.0103
0.0939
120.97%
New Zealand
0.0738
0.1246
96.66%
Poland
0.0103
0.0896
120.39%
Sweden
0.0488
0.0488
0.00%
Slovakia
0.0054
0.0429
119.26%
Slovenia
0.0201
0.0201
0.00%
Portugal
0.0147
0.1073
118.21%
Latvia
0
0
0.00%
Canada
0.0389
0.2489
116.57%
Estonia
0.0103
0.0103
0.00%
Japan
0.0532
0.2988
114.92%
Belgium
0.0173
0.0173
0.00%
Finland
0.0103
0.0523
113.63%
USA
0.2621
0.2282
-83.03%
Data source: Calculated and compiled in this paper
Countries Differ in Their Implementation of Barriers to Digital Services Trade
As shown in Figure 3, the digital trade restrictiveness index for each country in different categories has mostly shown an upward trend from 2008-to 2019.
China has maintained a high level of fiscal restrictions and market access, with the US overtaking China as the country with the highest level of this restriction in 2013 until Japan surpassed the United States in 2018. The level of fiscal restrictions and market access have increased significantly as the US seeks to maintain its leading position in the digital economy, for example by restricting the US sector from purchasing telecommunications equipment and IT systems produced by companies owned, directed or funded by the Chinese government, such as Huawei. Japan overtook the US as the country with the highest level of fiscal restrictions and market access in 2018 due to its discriminatory 8% tax on digital products and anti-dumping and countervailing investigations in the area of trade in digital services. In 2019, Japan, the US, India, China and Russia have relatively similar and high levels of restrictiveness, with fiscal restrictions and market access measures being widely applied across countries.
In terms of establishment restrictions, India has the highest and most increasing level of establishment restrictions, while the UK has the lowest level of it. India has the most stringent foreign investment and competition policies in place to discourage the establishment of foreign digital firms. The growth in establishment restrictions in Germany may stem from a concern to reverse the disadvantages of the digital economy, with a range of general restrictions on investment, intellectual property applications and price in the telecommunications sector. Larger increases in the level of establishment restrictions also exist in France and the US, with both countries being more concerned with national security reviews of investments, intellectual property rights and competition policy in the telecommunications sector.
In terms of restrictions on data, China is in first place with far higher data restrictions than any other country. The US shows a significant drop in data restriction levels in 2018 for the first time after experiencing growth and the rest of the countries have been on an increasing trend.
In terms of trading restrictions, the level of it in China has been trending upwards, with increases much higher than in India, Brazil and Russia. However, there has not been a significant increase in the level of trading restrictions in Europe and the US, which do not use trade policy as the main instrument for barriers to cross-border data flows.
Figure 3: Four Categories of Digital Trade Restriction Index for Major Countries in the World from 1998 to 2019
Data source: Calculated and compiled in this paper
CONCLUSION AND OUTLOOK
Currently, the scale of the global digital services trade is expanding, showing a high growth of digital services trade exports. This paper measures barriers to digital services trade in 34 countries with active digital services trade and finds that: (1) Developing countries have stricter services trade restrictions than developed countries and the top five in the data restrictions index are all BRICS countries; (2) Digital trade barriers in countries other than the US show an upward trend and the level of barriers to cross-border data flows in emerging countries grows much faster than developed countries (3) China and the US have maintained high levels in fiscal restrictions and market access, with Japan growing faster; India has the highest level of establishment restrictions and the greatest growth, while the UK has the lowest level; China has grown at a much higher rate and level in restrictions on data than other countries to rank first; China has maintained a high level of trading restrictions, with India growing more.
The digitization of global trade, including trade in services, is gradually accelerating and barriers to digital services trade represented by barriers to cross-border data flows are also increasing, which will have a significant impact on trade and economic development at the national and global levels. There is still no consensus on the effect and extent of the impact of barriers to cross-border data flows on the development of digital services trade and therefore their net impact needs to be further explored.
REFERENCE
Jiao, Y. “Digital Economy-Enabled Manufacturing Transformation: From Value Reshaping to Value Creation.” The Economist, no. 06, 2020, pp. 87-94.
Weber, R.H. “Internet of Things: Privacy Issues Revisited.” Computer Law & Security Review, vol. 31, no. 5, 2015, pp. 618-627.
Reuben, P. and J. Wright. “An Internet with BRICS Characteristics: Data Sovereignty and the Balkanisation of the Internet.” Proceedings of the 4th USENIX Workshop on Free and Open Communications on the Internet (FOCI 14), 2014.
Rika, C. and B.K. Lundvall. “Big Tech, Knowledge Predation and the Implications for Development.” Innovation and Development, 2020, pp. 1-28.
Cockburn, I.M. et al. “The Impact of Artificial Intelligence on Innovation.” National Bureau of Economic Research, 2019.
Zhao, J. “Policy Trends in Data Flow Barriers and Digital Transformation: An Analysis Based on European and OECD Digital Trade Restriction Indices.” International Trade, no. 2, 2021, pp. 72-81.
Wang, Y. “Challenges of the Digital Economy to Global Trade Governance and Institutional Responses.” International Economic and Trade Exploration, vol. 37, no. 1, 2021, pp. 99-112.
Dai, L. “Digital Economy Industry and Regulation of Data Flow Barriers: Current Situation, Challenges and China’s Response.” Research on Finance and Economics, no. 8, 2020, pp. 40-47.
Meltzer, P.J. “The Internet, Cross-Border Data Flows and International Trade.” Asia & the Pacific Policy Studies, vol. 2, no. 1, 2015, pp. 90-102.
Liu, C. “Internet Censorship as a Trade Barrier: A Look at the WTO Consistency of the Great Firewall in the Wake of the China-Google Dispute.” Georgetown Journal of International Law, vol. 42, 2010, p. 1199.
Chen, H. and N. Zhou. “Core Demands of U.S. Digital Trade Rules and Differences with China from USMCA.” International Economic and Trade Exploration, vol. 35, no. 6, 2019, pp. 104-114.
Chen, W. and K. Zhu. “Progress of Research on Digital Trade Theory and Rules.” Dynamics of Economics, no. 9, 2019, pp. 114-126.
Recommended Articles
Research Article
The Effect of Employer Attractiveness and Compensation on Job Persuit Intention to Fmcg Companies in Indonesia: Coporate Reputation as an Intervening Variable
Download PDF
Research Article
Country of Origin and Foreign Branding on Perceived Quality of Local Products in Indonesia: The Moderating Role of Consumer Ethnocentrism
Download PDF
Research Article
The Effect of Self-Efficacy and Working Environment on Work Achievement with Organizational Commitment as Mediation
Sri Wahyuni,
...
Veithzal Rivai Zainal
Download PDF
Research Article
The Effect of Beauty Vlogger on Purchase Decision for Local Skincare Products in Indonesia: Brand Image as a Mediating Variable
Download PDF
PO Box 101, Nakuru
Kenya.
Email: office@iarconsortium.org
Editorial Office:
J.L Bhavan, Near Radison Blu Hotel,
Jalukbari, Guwahati-India
Yinguo, D., Baixue, X. & Xiaocui, W. (2022). Measurement of Global Barriers to Digital Services Trade. Scientific Research Journal of Economics and Business Management, 2(1), 1-7.
MLA
Yinguo, Dong, Xiao Baixue and Wang Xiaocui. "Measurement of Global Barriers to Digital Services Trade." Scientific Research Journal of Economics and Business Management 2.1 (2022): 1-7.
Chicago
Yinguo, Dong, Xiao Baixue and Wang Xiaocui. "Measurement of Global Barriers to Digital Services Trade." Scientific Research Journal of Economics and Business Management 2, no. 1 (2022): 1-7.
Harvard
Yinguo, D., Baixue, X. and Xiaocui, W. (2022) 'Measurement of Global Barriers to Digital Services Trade' Scientific Research Journal of Economics and Business Management 2(1), pp. 1-7.
Vancouver
Yinguo D, Baixue X, Xiaocui W. Measurement of Global Barriers to Digital Services Trade. Scientific Research Journal of Economics and Business Management. 2022 Jan;2(1):1-7.



 Download PDF
 Download XML