Present research work to method development and validation of peptidase 4 (DPP-4) as inhibitory drug through RP-HPLC. It was validated for the estimation of Metformin HCL and Sitagliptin in tablet dosage form using HPLC Shimadzu Prominence with UV-Visible SPD 20A Detector and Phenominex C18 (250x4.6 mm, 5µ) column, injection of 20 µl is injected and eluted with the mobile phase of dipotassium hydrogen phosphate buffer and acetonitrile in the ratio 55:45, which was pumped at a flow rate of 1mL at 260 nm. The peak of Metformin HCL and Sitagliptin are found well separated at 4.285 and 7.485 respectively. The developed method was validated for various parameters as per ICH guidelines like Accuracy, Precision, Linearity, Specificity, Ruggedness, Robustness, LOQ and LOD. The analytical method validation of Metformin HCL and Sitagliptin by RP HPLC method was found to be satisfactory and could be used for the routine pharmaceutical analysis of Metformin HCL and Sitagliptin.
Keywords
RP-HPLC
Validation
Accuracy
Precision
Linearity
INTRODUCTION
Analytical chemistry may be defined as the science and art of determining the composition of materials in terms of the elements of composition contained. Pharmaceutical analysis is a bench of science that deals with the analytical procedures used to determine the purity, safety and quality of drugs and chemicals. It contains procedures to determine the identity, strength, quality and purity of new compounds. It also involves procedures for separating, identifying and determining the relative amount of the components in sample of matter [1,2].
Quality assurance plays a key role in finding the safety and efficiency of medicines. It has highly specific and sensitive analytical methods for the design, development, standardization and quality control of medicinal products. They are equally important for the pharmacokinetics and drug metabolism studies, both which are important for the assessment of bioavailability and clinical response. Modern physical method of analysis is extremely sensitive even for small amount of samples of materials. It can be rapidly applied and can readily amenable to automation. So it is widely used in the product development and in the control of manufacture, formulation and also in monitoring the use of drugs and medicines [3,4].
The term pharmaceutical analysis includes both quantitative and qualitative analysis of Drugs and pharmaceutical substances starting from bulk drugs to finished dosage forms. So it is used as diagnostic aids in the modern practice of medicine by the analysis of chemical constituents in the human body which may alter during the disease state [5].
If the quality of drug product is questioned by a physician, the pharmacist is responsible for taking necessary steps to determine if indeed the product is defective. This may be accomplished by contacting with drug manufacturer about the problem involving the product, analyzing the preparation in the laboratory, borrowing needed equipment from a clinical laboratory if necessary, sending the sample to a private laboratory for analysis, or a combination of all these steps. In any case, however, it remains the responsibility of analyst to solve problems relating to drug quality. The term ‘quality’ as applied to a drug product has been defined as the sum of all factors which contributes directly or indirectly to the safety, effectiveness and reliability of the product [6].
Significance of Quality Control
The pharmaceutical industry continues as a vital segment of the health care cycle in conducting research and manufacturing products which are life maintaining and life restoring. Modern medicines for human use are required to meet exacting standards which are related to their quality, safety and efficacy. The evaluation of safety, efficacy and their maintenance in practice is dependent up on the existence of adequate methods for the quality control of product [7].
Quantitative analysis reveals the chemical identity of species in the sample. Quantitative analysis establishes the relative amount of one or more of these species or analyte in numerical terms [8].
Analytical Techniques
The efficacy and safety of a medicinal product can only be assured by analytical monitoring of its quality. Therefore, the overall purity of a medicine must be assessed throughout its storage, distribution and use. The objective can possibly be achieved if the specification to be applied are based on validated procedure, which can demonstrate the relationship in quality between the substance under examination and that initially subjected to pharmaceutical, toxicological and pharmacological evaluation. These are the following techniques employed for estimation of different components in formulations.
Optical Methods
Some of the optical methods are:
X-ray spectroscopy
UV-Visible spectroscopy
Infrared spectroscopy
Atomic absorption spectroscopy
Flame photometry
Nuclear magnetic resonance spectroscopy
Nephlo-turbidimetry
Electron spin spectroscopy
MATERIALS AND METHODS
Drug Profile
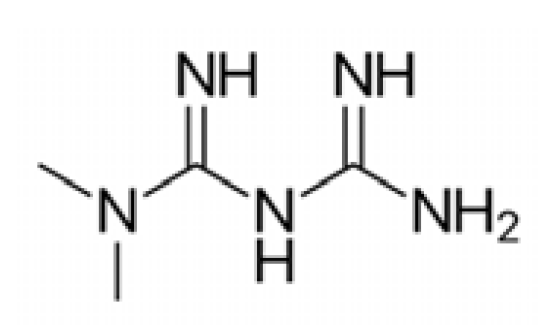
Metformin
Molecular Formula : C14H11N5.HCl
Molecular weight : 165.62g/mol
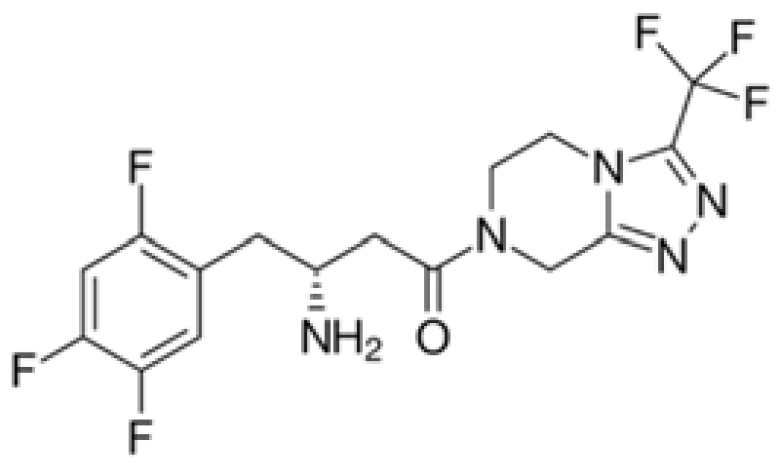
Sitagliptin
Molecular formula : C16H15F6N5O
Molecular Weight : 407.314
Optimization of Chromatographic Conditions
Selection of Wavelength for Detection of Components: Solution of Metformin HCL and Sitagliptin were scanned in the UV region and spectrum was recorded. The solvent used was 0.02M dipotassium hydrogen phosphate and acetonitrile in the ratio 55:45. It was seen that at 260nm all compounds have good absorbance, which can be used for the estimation of compounds by HPLC.
Selection of Chromatographic Method
Proper selection of the method depends on the nature of the sample (ionic or ionisable or neutral molecules), its molecular weight, pka value and stability. The drugs selected in the present study are polar and so reversed phase or ion exchange chromatography can be used. The reverse phase HPLC was selected for the initial separation because of its simplicity and suitability.
For the literature survey and with knowledge of properties of the selected drugs, Phenominex Gemini C18 (250 × 4.6mm) 5µ column was chosen as stationary phase and mobile phase with different compositions such as Acetonitrile was used. The separations were not observed so use of buffer was finalized. For all the data observed, obtained and available the initial separation condition was set to work around.
Initial Separation Condition
The following chromatographic conditions were fixed initially to improve the separation of both drugs:
Instrument : Shimadzu prominence
Column : Phenomenex Gemini C18 (250×4.6mm), 5µ
Column Oven Temperature : Ambient
Wavelength : 260nm
Flow Rate :1.2mL/min
Injection Volume : 20µL
Run Time : 10 min
Mobile Phase : Solvent A–Buffer, Solvent B-Methanol, Solvent C- Acetonitrile
Solvent Ratio : 30:35:35% V/V of A: B: C
Trails
Trail-1: The trail was performed using Mobile phase in the ratio 30:35:305 using Phenomenex C18 (250 x 4.6 mm, 5 μ) with flow rate of 1.2 mL/min. In this trail, the retention time of Metformin HCL and Sitagliptin peak was found to be 0.9 and 4.0 min respectively.
Trail-2
The trail 2 was performed using Mobile phase in the ratio 30:40:30 using Phenomenex C18 (250x 4.6 mm, 5μ) with flow rate of 1.2 mL/min. In this trail, the retention time of Metformin HCL and Sitagliptin peak was found to be 0.7 and2.4 min. respectively.
Trail-3
The trail 3 was performed using Mobile phase in the ratio 55:45 of using Phenomenex C18 (250 x 4.6 mm, 5 μ) with flow rate of 1 mL/min. In this trail, the retention time of Metformin HCL and Sitagliptin peak was found to be 4.28and 7.485min respectively.
Trial-4
The trail 4 was performed using Mobile phase in the ratio of 40:40:20 using Phenomenex (250 x 4.6 mm, 5 μ) with flow rate of 1 mL/min. In this trail, only two peaks were shown at 2 and 3.2 min. Out of 4 trails made in the lab, the 3th trail was selected for further studies because when compared to other trails, the 3th trail was found to be having less retention time and within the acceptance criteria.
Effect of Ratio of Mobile Phase
Under the chromatographic conditions mentioned above the different ratios of mobile phase were tried. The chromatograms where observed for each of the trials, out of which 30: 35:35 i.e.; 30 Buffer: 35 Methanol: 35 Acetonitrile was selected as the separation was achieved in minimum retention time.
Effect of pH of Mobile Phase
Several trials were made using different buffer solutions of pH range. The best separation was achieved when adjusted the pH to 4.5 with orthophosphoric acid.
Effect of Flow Rate on Separation
The mobile phase consisting of buffer: methanol: acetonitrile was used and the chromatograms were recorded at flow rates of 1mL/min, 1.2 mL/min. The sharpest peaks were obtained with 1.5 mL/min flow rate.
Effect of Column (Stationary Phase) on Separation
At the chromatographic conditions of mixed solutions, combination of Metformin HCL and Sitagliptin were injected and chromatograms were obtained using C-18 columns.
Reference Standards
Keeping all other above fixed conditions, external standard was used.
Optimized Condition
The following optimized parameters were used in a final method for the simultaneous estimation of Metformin HCL and Sitagliptin:
Mobile phase : Solvent A- Buffer Solvent B- Acetonitrile
Solvent Ratio : 55:45% V/V of A: B
Quantitation
Samples obtained from local market. Metformin HCL-500 mg Sitagliptin-50 mg
Preparation of Dipotassium Hydrogen Phosphate Buffer pH 4.5
Prepare about 0.02 M dipotassium hydrogen phosphate in a suitable conical flask and adjust the pH to 4.5 with orthophosphoric acid. (0.02 M of di potassium hydrogen phosphate is prepared by taking 1.3602 mg of dipotassium hydrogen phosphate in a volumetric flask and make up to 1L with water).
Preparation of Mobile Phase
Prepare a mixture of buffer 4.5 pH and acetonitrile in the ratio 55:45 filter through 0.45µ membrane filter and degas it.
Diluent Preparation
Buffer 4.5 pH and acetonitrile in the ratio 55:45.
Standard Preparation
Weigh accurately about 50 mg of Metformin, 50mg Sitagliptin working standard to a 100mL volumetric flask. Dissolve it completely and sonicate it. Make up to 100mL mobile phase. Take 3 mL from the above flask and make up to 50mL with mobile phase.
Sample Preparation
Weigh accurately 20 tablets equivalent to 92.4 mg to a 100 mL volumetric flask. Mobile phase to dissolve it completely and sonicate for 10 min with intermediate shaking Make up to 100 mL with mobile phase and filter through 0.45µ GHP filter. Further dilute 3mL with 50 mL mobile phase.
Calculation
Determine the % amount of Metformin HCL and Sitagliptin in tablets according to the following formula:
Where,
AT : Area in the test solution
AR : Area in the standard solution
WR : Weight of standard solution (mg)
WT : Weight of sample in test preparation (mg)
PR : Purity of working standard (%)
LA : Labeled amount of Metformin HCL and Sitagliptin per Tablets
RESULTS
Validation of the Developed Method Specificity
Specificity is the ability to measure accurately and specifically the analyte of interest in the presence of other components that may be expected to be present in the sample matrix. The other component may include excipients, impurities, degradation product etc. Peak purity test may be useful to show that the analyte chromatographic peak is not contributed by more than one component (e.g. diode array, mass, spectroscopy).
Standard Preparation
Weigh accurately about 50 mg of Metformin, 50 mg Sitagliptin working standard to a 100mL volumetric flask. Dissolve it completely and sonicate it. Make up to 100mL mobile phase. Take 3mL from the above flask and make up to 50 mL with mobile phase (Table 1).
Table 1: Percent Drug Content
Sample
Metformin HCL
Sitagliptin
Avg area
% Drug Content
Avg area
% Drug Content
Standard
352.914
100.18
440.46
99.67
Sample
354.469
436.16
Acceptance Criteria
There is no interference in the standard peak.
Linearity
Linearity is the ability of the method to elicit test results that are directly proportional to analyte concentration within a given range.
Linearity is generally reported as the variance of the slope of the regression line. Linearity should be evaluated by visual inspection of a plot of signal as a function of analyte concentration. The correlation coefficient, y- intercept, slope of the regression line and the residual sum of squares should be calculated.
Linearity of Metformin HCL and Sitagliptin
Weigh accurately about 50mg of Metformin, 50mg Sitagliptin working standard to a 100mL volumetric flask. Dissolve it completely and sonicate it. Make up to 100mL mobile phase. Take 3mL from the above flask and make up to 50 mL with mobile phase (Table 2).
Table 2: Linearity of Metformin HCL and Sitagliptin
Level
Metformin
Sitagliptin
80%
1773.542
164.743
90%
1996.980
1848.657
100%
2221.836
2053.140
110%
2466.998
2251.260
120%
2663.495
2478.061
Y–intercept
1548
1430
Slope
22.48
207.7
Correlation Coefficient
0.999
0.999
Linearity Graph
Range: Range is the interval between the upper and the lower levels of analyte that have been demonstrated to be determined with precision, accuracy and linearity using the method.
The range is normally expressed in the same unit as the test results obtained by the method. The ICH guideline specify a minimum of five concentration levels, along with certain minimum specified ranges. For assay tests the minimum specified range is 80–120%of the target concentration.
Preparation of Working Standard Solution
To get a concentration of 80 %, 100 %, 120 %, of drug, pipette out 4mL, 5mL, 6mL, of mixed standard stock solution into separate 100mL volumetric flask and volume is made up with mobile phase. Further dilute 3mL of the solution to 100mL of mobile phase.
Acceptance Criteria
The % RSD for the individual recoveries of each level and mean recovery should not be more than 2.0%
The % recovery at each level and mean recovery should be in between 98.0% to 102.0%
Limit of Detection (LOD)
The Limit of Detection (LOD) is defined as the lowest concentration of an analyte in a sample that can be detected, though not necessarily quantitated. It is a limit test that specifies whether or not an analyte is above or below a certain value.
ICH has recommended some method for determining the limit of detection. The method may be either instrumental or non-instrumental. They are:
Visual Evaluation
Signal–to–Noise ratio convention
Based on Standard deviation of the response and the slope of calibration curve
Limit of detection (LOD) based on standard deviation of the response and the slope of calibration curve (Table 3).
Table 3: Limit of Detection Study
LOD
Metformin HCL:(µg)
Sitagliptin(µg)
1.
1.05
7.12
LOD = 3.3 s / S
Where,
s: Standard deviation of the response
S: Slope of calibration curve
Limit of Quantitation (LOQ)
The limit of Quantitation (LOQ) is defined as the lowest concentration of the analyte in a sample that can be determined with acceptable precision and accuracy under the stated operational conditions of the method. Limit of Quantitation (LOQ) is also based on standard deviation of the response and the slope of calibration curve (Table 4).
Table 4: Limit of Quantitation Study
LOQ
Metformin HCL(µg)
Sitagliptin(µg)
1.
5.6
3.5
LOQ = 10 s/S
Where,
s: Standard deviation of the response
S: Slope of calibration curve
Precision
Precision is the measure of the degree of repeatability of an analyte method under normal operation and is normally expressed as percent relative standard deviation for a significant number of the samples. According to the ICH precision should be performed at three different levels: Repeatability, Intermediate precision, Reproducibility.
System Precision
The system precision was evaluated by measuring the peak response of Metformin HCL and Sitagliptin Hydrochlorothiazide, WS solution prepared as per the proposed method and chromatograms were recorded.
Determination
Weigh accurately about 50mg of Metformin, 50 mg Sitagliptin working standard to a 100mL volumetric flask. Dissolve it completely and sonicate it. Make up to 100mL mobile phase. Take 3mL from the above flask and make up to 50 mL with mobile phase (Table 5).
Table 5: Quantitative Analysis Results of Metformin and Sitagliptin
S. No
Metformin
Sitagliptin
1
2051.31
2218.08
2
2061.14
2228.22
3
2047.51
2230.72
4
2055.83
2229.53
5
2043.94
2212.8
6.
2039.57
2217.84
AVG
2049.88
2222.86
STD/%RSD
0.33/0.33
0.37/0.38
Method Precision
Weigh accurately 20 tablets equivalent to 92.4 mg to a 100mL volumetric flask. Mobile phase to dissolve it completely and sonicate for 10 min with intermediate shaking Make up to 100 mL with mobile phase and filter through 0.45µ GHP filter. Further dilute 3mL with 50mL mobile phase (Table 6,7).
Table 6: Method Precision for Metformin HCL
Sample. No
% Assay
Sample Preparation – 1
100.14
Sample Preparation – 2
100.1.8
Sample Preparation – 3
100.71
Sample Preparation – 4
100.76
Sample Preparation – 5
100.51
Sample Preparation – 6
100.56
Avg
100.76
SD
0.688
% RSD
0.70
Table 7: Method Precision for Sitagliptin
Sample. No
% Assay
Sample Preparation – 1
97.67
Sample Preparation – 2
98.60
Sample Preparation – 3
97.62
Sample Preparation – 4
98.65
Sample Preparation – 5
97.20
Sample Preparation – 6
97.24
Avg
97.80
SD
0.712
% RSD
0.730
Acceptance Criteria
The % RSD for the individual recoveries of each level and mean recovery should not be more than 2%
The % recovery at each level and mean recovery should be in between 98.0% to 102%
Accuracy
Accuracy is the measure of exactness of an analytical method, or the closeness of agreement between the measured value and the value that is accepted either as a conventional, true value or an accepted reference value. The accuracy may be determined by application of analytical method to an analyte of known purity (example: reference standard) and also by comparing the results of the method those obtained using an alternative procedure that has been already validated. To document accuracy, the ICH guideline on methodology recommends collecting data from a minimum of nine determinations over a minimum of three concentration levels covering the specified range.
Result
Refer range of calculations.
Preparation of Working Standard Solution
To get a concentration of 80%, 100%, 120% of drug, pipette out 4mL, 5mL, 6mL, of mixed standard stock solution into separate 100mL volumetric flask and volume is made with mobile phase. Further dilute 3mL this solution to 50mL with mobile phase.
Robustness
Robustness is the capacity of a method to remain unaffected by small deliberate variations in method parameters. The robustness of a method is evaluated by varying method parameters such as percent organic solvent, pH, ionic strength or temperature and determining the effect on the results of the method. Robustness tests were generally introduced to avoid problems in linear laboratory studies and to identify the potentially responsible factors.
Determination of Robustness
Robustness was performed by varying the PH & Flow rate (Table 8).
Table 8: Robustness Study for Metformin HCL and Sitagliptin
Robustness Criteria
RT of Metformin
RT of Sitagliptin
Change in flow +0.2
3.707
6.100
Change in flow -0.2
4.790
7.560
Change in wavelength by -PH
4.27
7.44
Change in wavelength by + PH
4.28
7.48
Acceptance Criteria
Shall comply the system suitability parameters
Measured variation to be reported with appropriate recommendations
Ruggedness
Ruggedness of analytical method is the degree of reproducibility of the results obtained by the analysis of the same samples under a variety of test conditions such as different laboratories, analysts, instruments, temperature, different days etc.
Determination of Ruggedness
The Ruggedness of an analytical method was determined by the analysis of aliquots from homogenous lots in different laboratories by different analysts using operational and environmental condition that may differ but are still within the specified parameters of the assay. The degree of reproducibility of the results is then determined as a function of assay variables. This reproducibility may be compared to the precision of assay under normal condition to obtain a measure of the ruggedness of the analytical method.
To determine the degree of reproducibility of the results by this method involved the studies of the analyst to analyst and day to day; that is to carry out precision study in six replicate of an assay of a single batch sample by two different analysts on two different days.
Acceptance Criteria
The % recovery at each level and mean recovery should be in between 98.0% to 102%
System Suitability
To verify whether the analytical system is working properly or it can give accurate and precise results, the system suitability parameters are to be set. Inject separately 20 µL each of the following solutions into the HPLC.
Standard Preparation
Weigh accurately about 50 mg of Metformin, 50 mg Sitagliptin working standard to a 100 mL volumetric flask. Dissolve it completely and sonicate it. Make up to 100mL mobile phase. Take 3mL from the above flask and make up to 50 mL with mobile phase (Table 9).
Table 9: Ruggedness Inter Day Analysis Study
Sample. No
% Assay of Metformin HCL
% Assay of Sitagliptin
Analyst – 1
98.9
102.0
Analyst – 2
99.2
100.1
Analyst – 3
99.7
101.4
Analyst – 4
99.6
101.3
DISCUSSION
The working condition for the RP-HPLC method was established for Metformin HCL and Sitagliptin then was applied on pharmaceutical dosage forms. A simple reverse phase liquid chromatographic method has been developed and subsequently validated [9,10].
The separation method was carried out by using a mobile phase consisting of 0.02 M dipotassium hydrogen phosphate and acetonitrile in the ratio 55:45 the detection was carried out by using UV – Visible SPD 20 A at 240 nm. The column was phenominex Gemini C18 (250×4.6mm×5µ). The flow rate was selected as 1mL/min.
The retention time of Metformin HCL and Sitagliptin was found to be4.285 and 7.485 respectively. The asymmetry factor or tailing 1.008 and 1.011 respectively, which indicates symmetrical nature of the peak. The number of theoretical plates of Metformin HCL and Sitagliptin was found to be 8840 and 12044 respectively, which indicates the efficiency performance of the column. From the linearity studies, specified concentration levels were determined. It was observed that Metformin HCL and Sitagliptin was linear in the range of 80% to 120 % for the target concentration. The linearity range of 10-50 mg/mL for Metformin HCL and Sitagliptin were found to obey linearity with a correlation coefficient of 0.999 and 0.999 respectively. The validation of proposed method was verified by recovery studies. The percentage recovery range was found to be satisfied which represent in results. The robustness studies were performed by changing the pH and wavelength. The ruggedness study was also performed. The analytical method validation was carried as per ICH guidelines and given below are the tables are the summary of the result [11-13].
CONCLUSION
RP-HPLC method was developed. It was validated for the estimation of Metformin HCL and Sitagliptin in tablet dosage form using HPLC Shimadzu Prominence with UV-Visible SPD 20A Detector and Phenominex C18 (250x4.6 mm, 5µ) column, injection of 20 µl is injected and eluted with the mobile phase of dipotassium hydrogen phosphate buffer and acetonitrile in the ratio 55:45, which was pumped at a flow rate of 1mL at 260 nm. The peak of Metformin HCL and Sitagliptin are found well separated at 4.285 and 7.485 respectively. The developed method was validated for various parameters as per ICH guidelines like Accuracy, Precision, Linearity, Specificity, Ruggedness, Robustness, LOQ and LOD. The analytical method validation of Metformin HCL and Sitagliptin by RP HPLC method was found to be satisfactory and could be used for the routine pharmaceutical analysis of Metformin HCL and Sitagliptin.
Amini et al. “Determination of ofloxacin in plasma by HPLC with UV detection.” Journal of Applied Sciences, vol. 5, no. 9, 2005, pp. 1655–1657.
Beckett, A.H. and J.B. Stenlake. Practical Pharmaceutical Chemistry. Vol. II, CBS Publishers and Distributors, 1997, pp. 157.
Berezkin, V.G. and E. Horwood. Chromatographic Adsorption Analysis. 1990.
Bhusari, K.P. et al. “Spectrophotometric methods developed for the estimation of ofloxacin and ornidazole simultaneously in tablet dosage form.” Asian Journal of Research in Chemistry, 2009, pp. 60–62.
Sekaran, C.B. and A. Prameela Rani. “Development and validation of spectrophotometric method for the determination of DPP-4 inhibitor sitagliptin in its pharmaceutical dosage.” International Journal of Pharmacy and Pharmaceutical Sciences, vol. 2, no. 4, 2010, pp. 138–142.
“ER reviewer guidance: Validation of chromatographic methods.” November 1994.
Chan, C.C. et al. Analytical Method Validation and Instrument Performance Verification, pp. 35–45.
Diaconu, D. et al. “Studies regarding the stability of pharmaceutical formulations released through association of beta-lactamic antibiotics: stability of an oral suspension powder containing cefadroxil and cefixime.” Annals of the Romanian Society for Cell Biology, vol. 2, no. 3, 2006, pp. 2773–2780.
Lee, D.C. et al. Pharmaceutical Analysis, pp. 1–44.
Watson, D.G. Pharmaceutical Analysis: A Textbook for Pharmacy Students and Pharmaceutical Chemists. 2nd ed., pp. 286.
Dharuman, J. et al. “RP-HPLC method development and validation for the simultaneous estimation of ofloxacin and tinidazole in tablets.” International Journal of PharmTech Research, vol. 1, April–June 2009, pp. 121–124.
Skoog, D.A. et al. Fundamentals of Analytical Chemistry. 7th ed., pp. 1–3, 628–641.
Recommended Articles
Research Article
Oral Manifestations of Myasthenia Gravis, Rheumatoid Arthritis, Pernicious Anemia, Graft Vs Host Disease, Linear IgA Disease and Chronic Bullous Disease of Childhood
Download PDF
Research Article
Socio-Demographic Characteristics, Classification, Management, Complication and Implant Status of Patients Undergoing Operative Treatment for the Thoraco-Lumbar Fracture at Tertiary Care Hospital.
Bahrat Bhushan,
...
Vineet Aggarwal
Published: 10/04/2022
Download PDF
Research Article
Tlics Score & Denis Scale and Their Association with Various Variables among Patients Undergoing Operative Treatment for the Thoraco-Lumbar Fracture at Tertiary Care Hospital
Bahrat Bhushan,
...
Vineet Aggarwal
Published: 10/04/2022
Download PDF
Research Article
Association of Maternal Age with Risk of Neonatal Sepsis: A Mono-Centric Retrospective Study in Lebanon
Imad Chokr,
...
Chawki Hammoud
Published: 29/12/2020
Download PDF
PO Box 101, Nakuru
Kenya.
Email: office@iarconsortium.org
Editorial Office:
J.L Bhavan, Near Radison Blu Hotel,
Jalukbari, Guwahati-India
Mishra, R., Bargode, R. S., Jain, S. & Patel, R. (2021). Reverse Phase Liquid Chromatographic Method Development and Validation of Peptidase-4 (Dpp-4) Inhibitory Drug. IAR-Medical Series, 2(2), 1-6.
MLA
Mishra, Ramanuj, et al. "Reverse Phase Liquid Chromatographic Method Development and Validation of Peptidase-4 (Dpp-4) Inhibitory Drug." IAR-Medical Series 2.2 (2021): 1-6.
Chicago
Mishra, Ramanuj, Ranjeet S. Bargode, Sourabh Jain and Rakeh Patel. "Reverse Phase Liquid Chromatographic Method Development and Validation of Peptidase-4 (Dpp-4) Inhibitory Drug." IAR-Medical Series 2, no. 2 (2021): 1-6.
Harvard
Mishra, R., Bargode, R. S., Jain, S. and Patel, R. (2021) 'Reverse Phase Liquid Chromatographic Method Development and Validation of Peptidase-4 (Dpp-4) Inhibitory Drug' IAR-Medical Series 2(2), pp. 1-6.
Vancouver
Mishra R, Bargode RS, Jain S, Patel R. Reverse Phase Liquid Chromatographic Method Development and Validation of Peptidase-4 (Dpp-4) Inhibitory Drug. IAR-Medical Series. 2021 Jul;2(2):1-6.



 Download PDF
 Download XML