Biochemical blood parameters in growing rats (Rattus norvegicus) fed different contents of Moringa oleifera Lam, 1785
Adama Koffi Amara
1
,
Frédéric Kouadio N’DIA
2
,
Mathieu Nahounou Bleyere
3
,
Paul Angoué Yapo
4
1
PhD Student, Physiology of Human Nutrition, Training and Research Unit of Nature Sciences/Laboratory of Physiology, Pharmacology and Pharmacopoeia, Nangui Abrogoua University, Côte d’Ivoire
2
Lecturer Animal Physiology and Pharmacology, Training and Research Unit of Nature Sciences/Laboratory of Physiology, Pharmacology and Pharmacopoeia, Nangui Abrogoua University, Côte d’Ivoire
3
Professor Physiopathology, Training and Research Unit of Nature Sciences/Laboratory of Physiology, Pharmacology and Pharmacopoeia, Nangui Abrogoua University, Côte d’Ivoire
4
Animal Physiology and Physiology of Nutrition, Training and Research Unit of Nature Sciences/Laboratory of Physiology, Pharmacology and Pharmacopoeia, Nangui Abrogoua University, Côte d’Ivoire
In order to explore the impact of different contents of Moringa oleifera (Moringaceae) leaf powder on blood biochemical parameters, daily administration of dietary formulations was carried out in rats of the species Rattus norvegicus for three months. In the first month of the dietary trials, a significant difference was observed between the different dietary formulations for total protein, albumin, blood glucose, total cholesterol, HDL cholesterol, total/HDL cholesterol, urea, chlorine, sodium and sodium/potassium. After two months of food consumption, albumin, globulin, albumin/globulin, triglycerides, AST, creatinine, calcium, sodium and sodium/potassium showed a significant difference between the foods tested. Three months of dietary trials reported only significant differences between foods for globulin, albumin/globulin, blood glucose, creatinine, urea and calcium. In the same vein, the study showed that the time of administration and the levels of Moringa oleifera leaf powder changed the levels of biochemical parameters in rats. Thus, the 50% content decreased the biochemical parameters the most compared to the controls. Conversely, the 100% content increased these biochemical parameters more. Consumption of Moringa oleifera leaf powder was more conducive to an increase in the level of biochemical parameters than to a decrease.
Keywords
Moringa Oleifera
Food
Rat Wistar
Biochemical Blood Parameters
INTRODUCTION
Food is central to any human society because of its biological necessity and the pivotal role it plays in social and cultural life [1]. Food supply is an extremely important part of consumption and involves environmental, socio-economic and ethical aspects. From an environmental perspective, the way humans eat is a major determinant of how natural resources are used [2]. The choice of foods we produce and consume, where they come from, the production, processing and distribution practices used, etc., have a significant impact on the state of the environment, our health and the social ties that bind us together. Despite this crucial and inescapable place of food in life, it is clear that more than 800 million people in the world suffer from undernourishment, including 200 million children under the age of 5. In addition, thousands of children die every day from infectious diseases severely aggravated by malnutrition [3]. In 2012, in Côte d'Ivoire, only 7% of children and infants benefited from a minimum quality diet in terms of both the diversity and frequency of meals [4]. In 2014, 20.5% of the population did not reach the minimum level of caloric intake and the diet remains poorly diversified in all age groups [5]. It is in a dynamic search for solutions against imbalance in the diet or malnutrition that this nutrition study was conducted on Wistar rats fed with food formulations made from local products supplemented with Moringa oleifera leaf powder at different levels to indicate the best level relative to the age of the rats through its effect on biochemical parameters. Previous work has described the nutritional composition of the plant [6,7], the exceptional nutritional qualities of M. oleifera leaves [8-11].
However, this work is still insufficient given the enormous marketing that is being done around this plant, the miracle plant that can cure a host of diseases. Moreover, in Côte d'Ivoire, no study has yet been conducted on the effect of a variation in the content of Moringa oleifèra leaf powder incorporated in a feed on biochemical blood parameters in rats (Rattus norvegicus) in breeding, hence the interest of this study. More specifically, the study focused on:
To determine the variation of some biochemical blood parameters related to nutrition between the different food formulations for each selected period of growth in rats
To reveal the impact of contents of Moringa oleifera powder and the duration of their administration on biochemical markers
To indicate the best contents of Moringa oleifera powder and duration of submission in rats
MATERIALS AND METHODS
Food Raw Materials
The ingredients used for the formulation of the different foods were: soybean powder, fish powder, dried and finely ground dead bread from bakeries commonly known as "godio bread" in Ivory Coast, cooking salt and crushed corn. In addition, Moringa oleifera leaves were also used. They were harvested in different cities of Côte d'Ivoire (Abidjan, Bouaké and Bondoukou) in September 2016.
Animals
The rats used in these experiments were white albino male and female rats of the species Rattus norvegicus and Wistar strain. These rats were four weeks old and had a mean body weight of 30.25±2.80 g. These young rats were acclimatised in cages ten days before the start of the experiment at the Laboratory of Physiology, Pharmacology and Pharmacopoeia (LPP) of the Natural Sciences Training and Research Unit (UFR-SN) of the University Nangui Abrogoua (Abidjan, Côte d'Ivoire). During the first ten days, all animals received the control feed (L3P) and water at will. They were subjected daily to room temperature, 12 hours of light and 12 hours of darkness. Rats of other strains or with apparent immobility and signs of parasitic disease (runny nose or lymph nodes) were not selected in this study. Male and female rats of 4 weeks of age or less were not selected in this study. The various experimental protocols were followed in accordance with the guidelines for the protection of experimental animals of the European Council of Legislation 87/609/EEC.
Food Formulations
The method used is that described by Lyimo et al. Leafy branches of Moringa oleifera were dried for 5 days at 18-20o C until they became crisp, brittle and crunchy. These dried leaves were finely pulverized with a RETSH electric mill, type SM 100 (Haan, Germany). The resulting powder was packed in small bags of about 5 kg to be used for food preparation. From the different ingredients, five diets were formulated. These were diets L3P, L3P25, L3P50, L3P75 and L3P100 where Moringa oleifera leaf powder was incorporated respectively at 0, 25, 50, 75 and 100% as a partial or total substitution to soybean meal according to the composition indicated in Table 1.
Table 1: Composition of Diets
Different diets
Ingredients (g)
L3P
L3P25
L3P50
L3P75
L3P100
Bread powder
44.50
44.50
44.50
44.50
44.50
Crushed maize
25
25
25
25
25
Fish powder
16
16
16
16
16
Soy powder
14
10.50
7
3.50
0
Moringa powder
0
3.50
7
10.50
14
Salt
0.50
0.50
0.50
0.50
0.50
Total
100
100
100
100
100
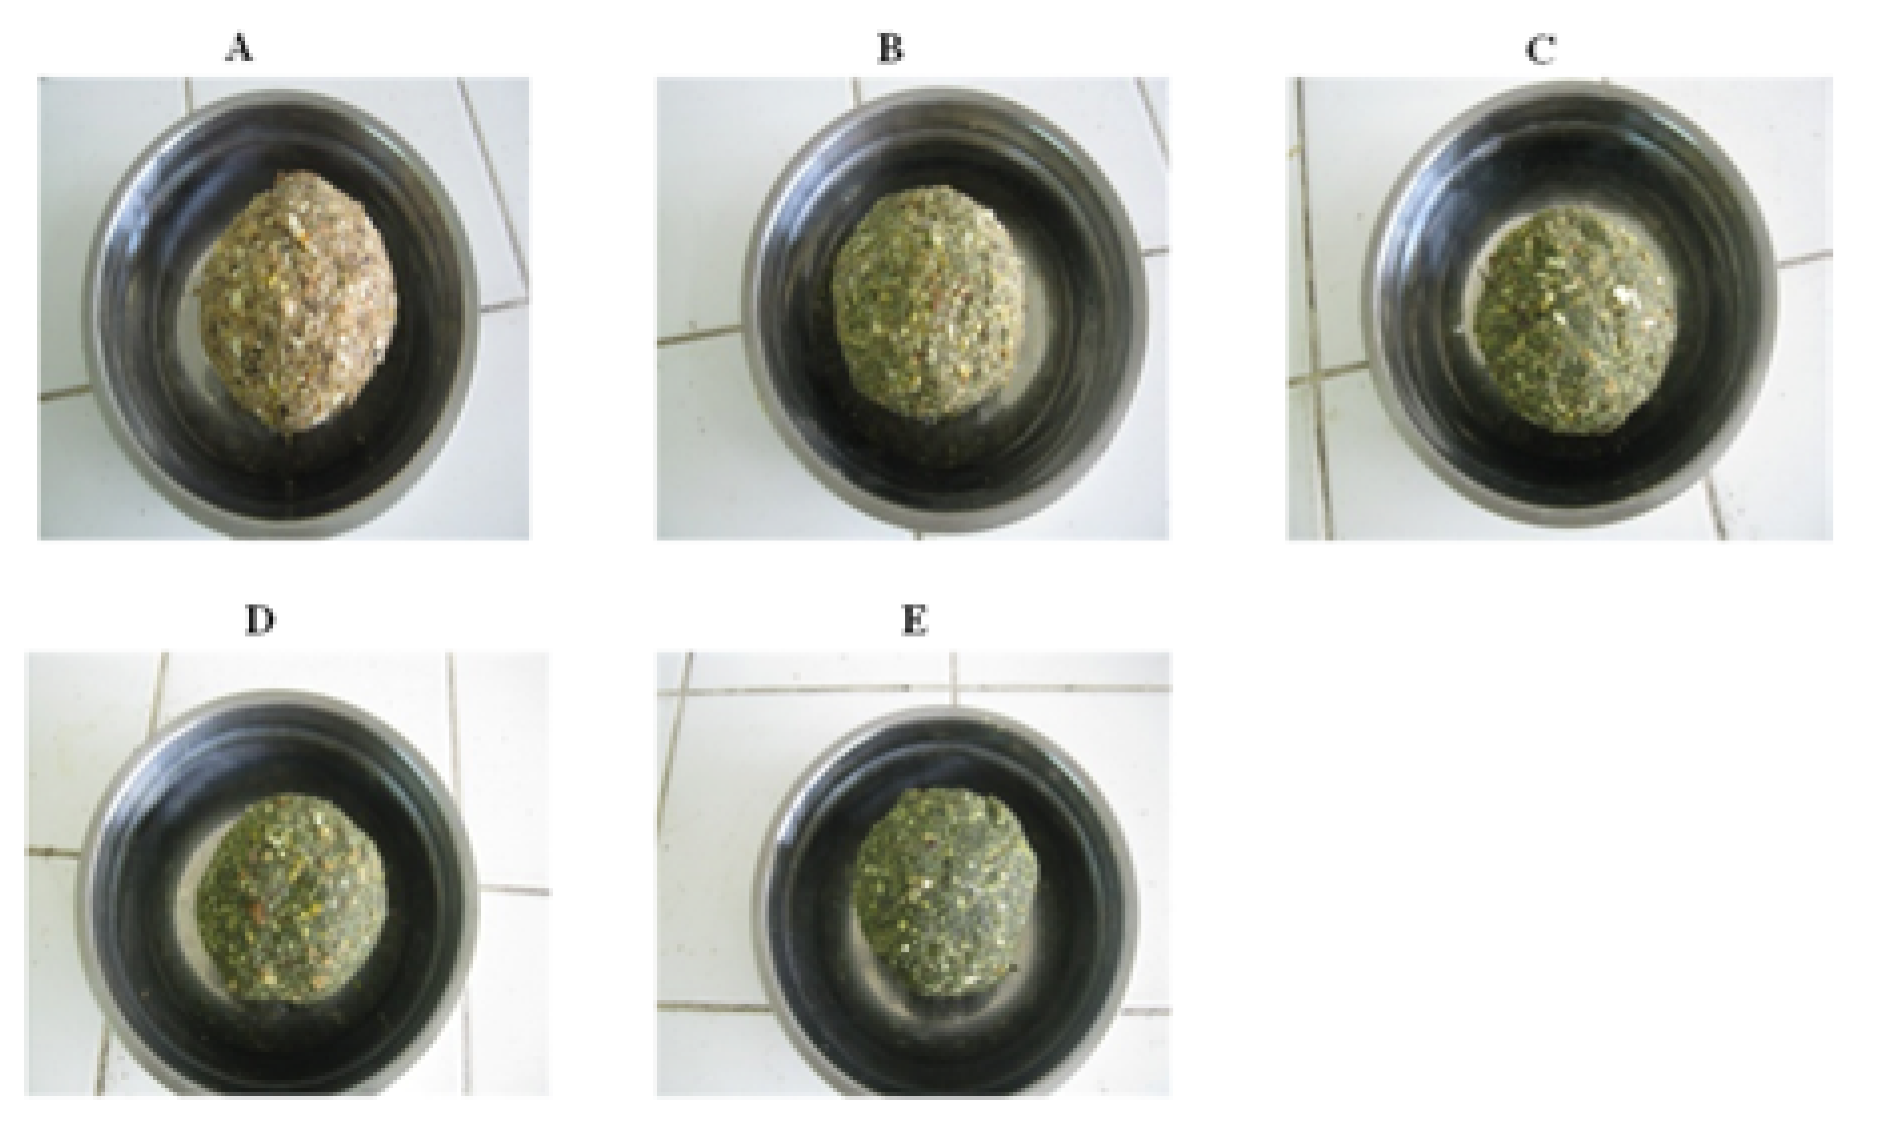
Distilled water was added at a rate of 640 mL/kg of compound food, so as to form a more or less rounded, homogeneous, malleable paste (Figure 1).
Dietary Tests and Determination of Biochemical Blood Parameters
Forty rats, comprising 20 males and 20 females, were randomly assigned to five groups of eight animals, one control and four test groups. Each group was divided into two subgroups of four females and four male rats to avoid reproductive events during the study. Group 1 (control) was fed Moringa oleifera powder-free feed (L3P feed). Groups 2, 3, 4 and 5 were fed diets containing Moringa oleifera powder in percentages of 25 (diet L3P25), 50 (diet L3P50), 75 (diet L3P75) and 100% (diet L3P100), respectively. All the animals placed in polystyrene cages received ad libitum one meal per day for three months.
Blood samples were taken at the end of each month under aseptic conditions from rats fasted the night before. In these animals previously anaesthetized in a bell containing cotton wool soaked in ether for 2-3 minutes, blood was drawn from the retroorbital sinus using the technique of Jones et al. Approximately 5 mL of blood was collected in dry tubes. The blood was centrifuged at 3000 rpm for 5 min and the resulting serum was stored in wells at -20°C until the determination of biochemical markers. These markers were determined with SPINREACT S.A. kit reagents on a Hyce Lisa 300 automated system [12-15].
Statistical Analysis
The statistical analyses of the data were performed using GraphPad Prism 5.01 software (San Diego, California, USA). The results were given as means followed by the standard error on the mean (M±ESM). Both one-factor (ANOVA 1) and two-factor (ANOVA 2) analyses of variance were used. These tests, which had Dunnett's post-hoc test as their post hoc test, were used to indicate the probable effects of different food formulations on biochemical blood parameters. Significance was chosen for a probability threshold p below 0.05.
RESULTS
Evolution of Biochemical Blood Parameters at Each Selected Growth Period in Rats
Consumption induced highly significant (p<0.001), highly significant (p<0.01) and significant (p<0.05) differences in 16 of 20 studied parameters in test rats compared to control rats.
At the first month, study results indicated an increase in albumin with a significant difference (p<0.05) in the L3P25 and L3P50 groups. Significant (p<0.05) and highly significant (p<0.001) increases in total protein were obtained in the L3P25 and L3P50 groups compared to the control L3P group, respectively (Table 2).
Table 2: Changes in Biochemical Parameters of Rats Following One Month of Feeding
Biochemical parameters
Various food rations
p
L3P
L3P25
L3P50
L3P75
L3P100
Total Proteins (g/L)
69.45±3.85
95.31±6.30*
109.02±5.48***
80.34±8.74
71.64±7.83
<0.001
Albumin (g/L)
97.11±3.15
115.79±4.02*
115.70±3.94*
110.16±6.28
102.45±3.52
<0.01
Globulin (g/L)
28.94±2.07
36.89±4.54
23.93±4.92
34.79±3.40
34.99±7.38
>0.05
A/G ratio
3.69±0.34
3.52±0.48
6.21±1.72
3.27±0.28
3.68±0.76
>0.05
Glucose (g/L)
0.99±0.08
0.73±0.04*
0.65±0.05**
0.90±0.09
0.77±0.07
<0.01
Triglycerides (g/L)
1.80±0.20
2.49±0.29
1.58±0.16
2.07±0.19
2.29±0.42
>0.05
Total cholesterol (g/L)
0.47±0.08
1.06±0.14***
0.40±0.04
0.31±0.06
0.45±0.06
<0.001
HDL (g/L)
1.16±0.12
1.61±0.08*
1.32±0.14
1.32±0.09
1.33±0.22
<0.05
LDL (g/L)
1.16±0.17
1.02±0.21
1.16±0.12
1.31±0.09
1.05±0.24
>0.05
Indices d’athérogénicité
Total cholesterol/HDL
0.35±0.05
0.76±0.08***
0.35±0.04
0.26±0.05
0.29±0.02
<0.001
LDL/ HDL
0.99±0.07
0.62±0.10
0.97±0.08
1.11±0.04
1.05±0.22
>0.05
ASAT (UI/L)
329.50±16.18
384.27±28.53*
361.97±8.20
323.52±16.37
339.47±12.61
<0.05
ALAT (UI/L)
52.01±6.83
55.13±5.68
53.18±7.20
48.36±5.29
45.98±1.96
>0.05
Creatinin (mg/L)
11.60±1.34
12.50±1.31
12.65±0.32
10.68±1.14
14.09±1.12
>0.05
Urea (g/L)
1.25±0.04
1.20±0.14
1.00±0.08
0.87±0.08**
0.69±0.07***
<0.001
Calcium (mg/dL)
77.70±2.10
70.30±4.04
78.30±4.81
86.30±5.77
75.90±4.64
>0.05
Chlorine (mEq/L)
110±10.10
136±3.81*
122±5.83
100±4.33
114±9.94
<0.05
Sodium (mEq/L)
122±15.50
168±19.30
232±38.20**
151±7.85
199.00±34.10
<0.01
Potassium (mEq/L)
13.60±1.21
16.50±0.62
12.70±0.85
12.00±0.19
12.10±1.41
>0.05
Sodium/Potassium
12.15±1.07
10.00±1.02
19.39±2.05*
11.98±0.73
12.20±2.46
<0.05
Values on the same line were statistically different from the control (rats fed the L3P feed) for p<0.05; n = 8 rats, Lot L3P, 0% Moringa oleifera powder; lot L3P25: 25% Moringa oleifera powder; lot L3P50: 50% Moringa oleifera powder; lot L3P75: 75% Moringa oleifera powder and lot L3P100: 100% Moringa oleifera powder; *: p<0.05; **: p<0.01; ***: p<0.001
In the same period, in rats of the groups (L3P75 and L3P100), significant (p<0.05) and highly significant (p<0.01) decreases in blood glucose compared to control (L3P) were observed in L3P25 and L3P50 respectively. When rats were fed diets, total cholesterol and HDL cholesterol increased only significantly (p<0.05) in L3P25 rats. Similarly, with the exception of L3P25Lot, which had a highly elevated level (p<0.001), all other rats had a low ratio. Triglycerides showed no significant variation in the first month of dietary trials. Daily food consumption induced decreases in urea with highly significant (p<0.01) and highly significant (p<0.001) differences in groups L3P75 and L3P100, respectively, compared to control (L3P). There was a significant (p<0.05) increase of AST (TGO) in group L3P25 compared to control. The test foods induced an increase of natremia with a very significant difference (p<0.01) in L3P50 group compared to control. An increase in chlorine was observed in rats outside of group L3P75 compared to controls with a significant difference (p<0.05) in L3P25 group. There was an increase of chlorine in groups L3P50 and L3P100 with a significant difference (p<0.05) in the latter group.
At the second month (Table 3), albumin in all rats decreased in contrast to controls at month 1, with a significant difference (p<0.05) in groups L3P25 and L3P100. The globulin in test rats compared to controls decreased very significantly (p<0.01). Conversely, an increase of A/G ratio was reported in rats with a very significant difference (p<0.05) in L3P25 and L3P100 groups. Triglyceride levels were consistently elevated in all rats with a highly significant difference (p<0.001) in groups L3P25 and L3P50. There was no significant change in total cholesterol. Both parameters and rats receiving Moringa oleifera showed a high level with no significant difference (p>0.05) compared to control group. Daily food consumption resulted in a decrease of creatinine in rats with exception of group L3P25 and with a significant difference (p<0.05) for group L3P75. Similarly, calcium was highly low (p<0.001) in test rats, while sodium was significantly (p<0.05) elevated in rats. was high with significant difference (p<0.05) in L3P25.and L3P100 groups and highly significant (p<0.001) in L3P50 group.
Table 3 : Variation in Biochemical Parameters in Rats After Two Months of Feeding Tests
Biochemical parameters
Various food rations
P
L3P
L3P25
L3P50
L3P75
L3P100
Total Proteins (g/L)
69.12±1.99
72.65±4.44
72.99±1.87
74.75±1.13
71.92±1.75
>0.05
Albumin (g/L)
84.94±5.65
65.78±4.75*
73.40±5.80
71.15±4.21
62.43±2.53*
<0.05
Globulin (g/L)
25.40±6.29
8.81±3.33*
6.85±2.04**
6.96±5.65**
3.05±0.79**
<0.01
A/G ratio
4.14±1.03
10.71±3.81
14.97±5.37
21.84±1.77**
24.65±5.68**
<0.01
Glucose (g/L)
1.46±0.09
1.41±0.05
1.35±0.06
1.25±0.07
1.53±0.10
>0.05
Triglycerides (g/L)
0.99±0.08
2.92±0.17***
2.26±0.25***
1.28±0.16
1.36±0.12
<0.01
Total cholesterol (g/L)
0.71±0.06
0.69±0.08
0.64±0.08
0.75±0.05
0.73±0.10
>0.05
HDL (g/L)
0.57±0.04
0.58±0.03
0.50±0.07
0.60±0.048
0.59±0.05
>0.05
LDL (g/L)
0.13±0.01
0.41±0.09
0.25±0.04
0.63±0.29
0.53±0.09
>0.05
Indices d’athérogénicité
Total cholesterol/HDL
1.25±0.09
1.28±0.22
1.39±0.27
1.26±0.16
1.48±0.33
>0.05
LDL/ HDL
0.26±0.02
0.75±0.29
0.69±0.25
0.88±0.38
0.94±0.18
>0.05
ASAT (UI/L)
141.95±8.37
241.37±9.99*
201.03±38.42
212.30±17.27
198.00±12.39
<0.05
ALAT (UI/L)
29.18±2.88
32.72±6.84
35.94±3.15
31.01±0.89
50.81±13.67
>0.05
Creatinin (mg/L)
0.40±0.07
0.40±0.03
0.39±0.05
0.38±0.05
0.26±0.02
>0.05
Urea (g/L)
5.47±0.37
6.98±0.27*
4.38±0.29
4.10±0.33*
4.55±0.42
<0.001
Calcium (mg/dL)
100.00±1.61
78.80±1.26***
79.30±2.01***
78.00±1.04***
81.20±1.34***
<0.001
Chlorine (mEq/L)
117.00±8.88
96.70±1.20
114.00±5.05
115.80±2.10
110.00±4.45
>0.05
Sodium (mEq/L)
65.10±25.40
111.00±25.10
149.00±9.99*
69.30±36.00
87.20±11.10
<0.05
Potassium (mEq/L)
6.40±0.23
6.52±0.25
6.43±0.23
6.43±0.25
6.41±0.24
>0.05
Sodium/Potassium
4.38±1.09
16.47±1.63*
24.93±2.58***
10.69±1.35
15.03±1.24*
<0.001
Values on the same line were statistically different from the control (rats fed the L3P feed) for p<0.05; n = 8 rats, Lot L3P: 0% Moringa oleifera powder; lot L3P25: 25% Moringa oleifera powder; lot L3P50: 50% Moringa oleifera powder; lot L3P75: 75% Moringa oleifera powder and lot L3P100: 100% Moringa oleifera powder; *: p<0.05; **: p<0.01; ***: p<0.001
At the third month of consumption (Table 4) of different foods fortified with Moringa Oleifera compared to control food (L3P) no significant changes were observed in albumin, total proteins, lipid parameters, AST, ALT and certain ions (chlorine, sodium and potassium). In contrast, significant increases (p<0.005) were indicated for blood glucose and globulin compared to control rats. This increase was particularly significant in rats from groups L3P75. For A/G ratio, a highly significant decrease (p<0.001) was indicated with a lower ratio in groups L3P25 and L3P75. In the latter period, creatinine increased significantly (p<0.05) in L3P100 group compared to control. In the same vein, Moringa Oleifera resulted in an increase in urea in all rats with a very significant difference (p<0.01) in L3P50 group. Calcium decreased with a significant difference (p<0.05) in group L3P75 and very significantly (p<0.01) in group L3P25 compared to control.
Table 4: Distribution of Biochemical Parameters in Rats Following Three Months of Feeding
Biochemical parameters
Various food rations
p
L3P
L3P25
L3P50
L3P75
L3P100
Total Proteins (g/L)
79.73±3.73
71.30±3.32
72.79±2.48
81.60±2.58
72.876±1.801
>0.05
Albumin (g/L)
73.68±5.76
69.06±2.21
64.48±3.79
69.92±3.13
65.20±3.23
>0.05
Globulin (g/L)
7.52±1.30
15.58±2.20*
14.15±1.84*
20.92±1.40***
11.81±1.93
<0.001
A/G ratio
11.00±1.51
4.05±0.70**
5.59±1.20
2.59±0.26**
6.371±0.91
<0.001
Glucose (g/L)
0.85±0.12
1.51±0.12*
1.13±0.11
1.48±0.08*
0.95±0.12
<0.01
Triglycerides (g/L)
1.24±0.02
1.46±0.07
1.53±0.15
1.49±0.08
1.52±0.13
>0.05
Total cholesterol (g/L)
0.60±0.03
0.57±0.03
0.56±0.05
0.65±0.06
0.69±0.06
>0.05
HDL (g/L)
0.64±0.04
0.68±0.03
0.72±0.04
0.68±0.04
0.80±0.06
>0.05
LDL (g/L)
0.44±0.09
0.41±0.09
0.34±0.06
0.37±0.08
0.40±0.04
>0.05
Indices d’athérogénicité
Total cholesterol/HDL
0.95±0.09
0.84±0.03
0.80±0.08
0.88±0.06
0.90±0.10
>0.05
LDL/ HDL
0.73±0.19
0.71±0.16
0.58±0.07
0.58±0.15
0.56±0.12
>0.05
ASAT (UI/L)
141.20±13.61
129.53±5.93
124.75±6.81
139.61±7.95
134.02±4.17
>0.05
ALAT (UI/L)
36.59±2.35
32.36±2.13
34.27±0.96
32.74±2.37
34.78±2.56
>0.05
Creatinin (mg/L)
2.53±0.31
1.81±0.19
2.46±0.28
2.87±0.26
4.06±0.39*
<0.05
Urea (g/L)
0.28±0.03
0.38±0.03
0.39±0.03
0.44±0.03**
0.34±0.02
<0.05
Calcium (mg/dL)
109.00±9.11
73.00±3.36**
93.60±4.03
82.30±6.90*
97.90±2.94
<0.01
Chlorine (mEq/L)
133.00±3.10
138.00±3.3
140.00±4.24
134.00±1.62
136.00±2.15
>0.05
Sodium (mEq/L)
142.00±1.44
145.00±1.90
146.00±1.62
144.00±1.17
138.00±1.93
>0.05
Potassium (mEq/L)
6.74±0.49
5.59±0.25
5.70±0.22
6.19±0.32
6.36± 0.58
>0.05
Sodium/Potassium
21.75±1.51
26.17±1.03
25.99±0.82
23.65±1.30
22.49±2.30
>0.05
Values on the same line were statistically different from the control (rats fed the L3P feed) for P < 0.05; n = 8 rats, Lot L3P: 0% Moringa oleifera powder; lot L3P25: 25% Moringa oleifera powder; lot L3P50: 50% Moringa oleifera powder; lot L3P75: 75% Moringa oleifera powder and lot L3P100: 100% Moringa oleifera powder; *: p<0.05; **: p<0.01; ***: p<0.001
Variation of Each Biochemical Blood Parameter Over All Growing Periods in Rats
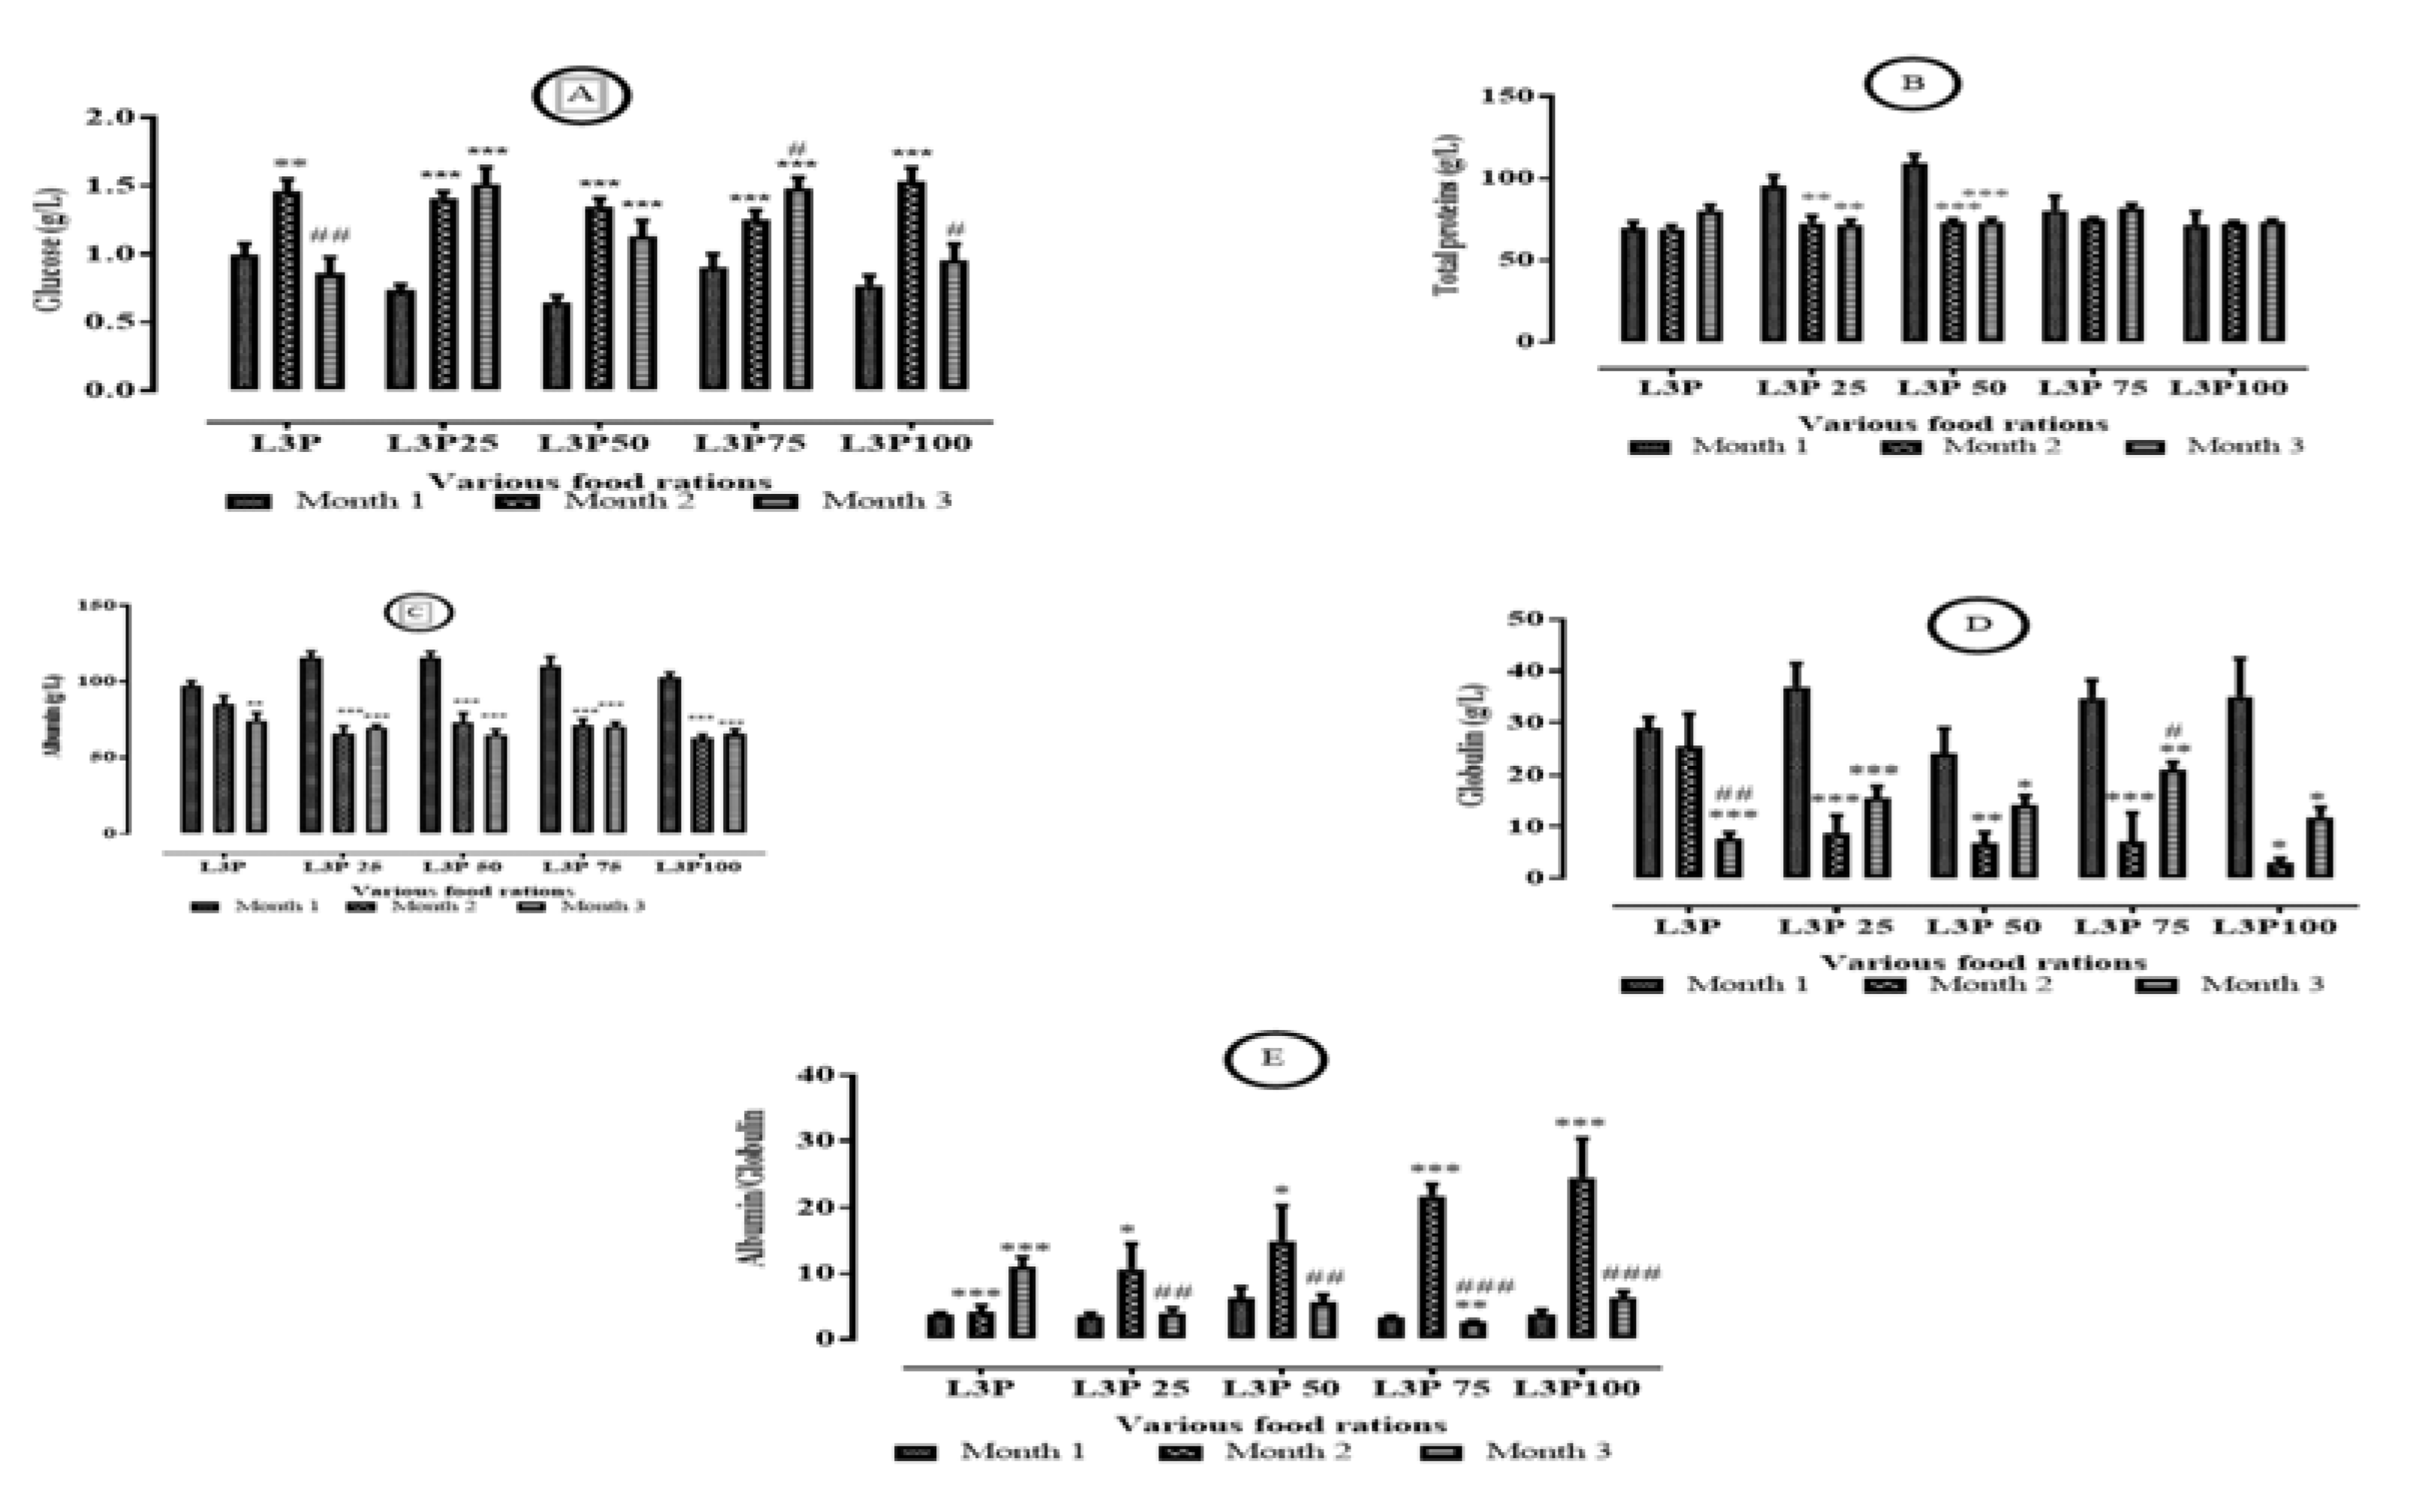
Figures 2,3,4 and 5 show the evolution of biochemical parameters as a function of the food administered during the three periods of the experiment. The administration of the control food induced in rats a very significant (p<0.01) increase in blood glucose levels in the 2nd month compared to the first month of treatment before decreasing very significantly (p<0.01) in the 3rd month.
Similarly, blood glucose of L3P50 and L3P100 groups followed the same pattern as control rats with a highly significant difference (p<0.001) in the L3P100 group at month 3 (Figure 2-A). Furthermore, in L3P25 and L3P75 groups, blood glucose increased progressively with a significant difference (p<0.05) for L3P75 lot at month 3 compared to month 2. Total protein decreased progressively from month 1 to month 3 in L3P25 and L3P50 groups with a highly significant difference (p<0.001) from month 1 to month 2. Total protein did not change significantly in rats fed L3P25, L3P75 and L3P100 from month 1 to month 3 of study (Figure 2-B). Albumin levels increased significantly (p<0.05) compared to control rats in the first month of dosing. In rats of L3P25, L3P50, L3P75 and L3P100 groups, albumin was significantly (p<0.001) lower in the second and third months of the experiment compared to first month (Figure 2-C). Globulin in control rats showed a progressive and highly significant (p<0.01) decrease from month 2 to month 3. In test rats, globulin showed a highly significant (p<0.001) decrease in second month and then an increase, with a significant difference (p<0.05) in the L3P75 group, but this increase did not reach the level of the first month's level (Figure 2-D).
In all rats, A/G ratio increased with significant difference (p<0.05) in L3P25 and L3P50 groups and highly significant (p<0.001) in L3P75 and L3P100 groups from month 1 to month 2. In addition, there was a highly significant (p<0.001) decrease in the rate in lots L3P75 and L3P100 and a highly significant (p<0.01) decrease in lots L3P25 and L3P50 compared to the rate in Month 2 (Figure 2-E).
Figure 2: Blood Glucose and Proteins
*: Comparison to first month for p<0.05; **: Comparison to first month for p<0.01, ***: Comparison to first month for p<0.001; #: Comparison to second month for p<0.05, ##: Comparison to second month for p<0.01; ###: Comparison to second month for p<0.001
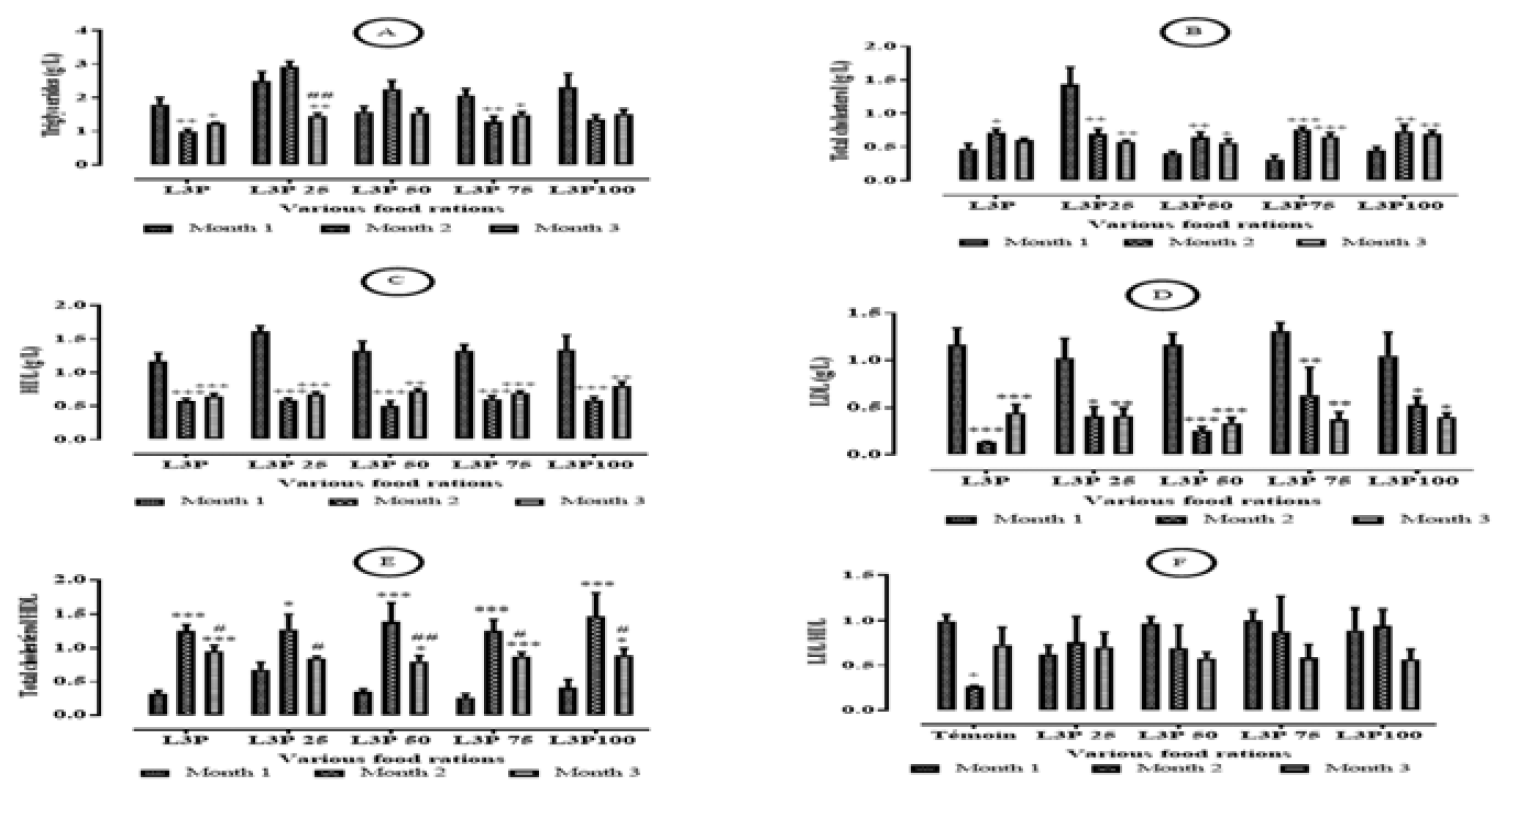
Triglycerides in L3P, L3P75 and L3P100 groups showed a very significant decrease (p<0.01) from month 1 to month 2, followed by a slight increase without reaching rate of month 1. Conversely, L3P25 and L3P50 groups showed an increase in triglyceride in second month before decreasing with a very significant difference (p<0.01) in third month (Figure 3-A). With the exception of group L3P25, which showed a gradual decrease during the study, all other rats including controls showed an increase in total cholesterol. This increase was highly significant (p<0.001) at month 2 in L3P75 lot, highly significant (p<0.01) in L3P50 and L3P100 lots and significant (p<0.05) in L3P lot and decreased at month 3 in all these groups with no significant value compared to level at month 2 (Figure 3-B). All rats showed a highly significant (p<0.001) decrease in HDL at month 2 before experiencing an increase with no significant difference at month 3 (Figure 3-C). As for LDL, it showed a progressive decrease in LDL of L3P75 and L3P100 groups with very significant (p<0.01) and significant (p<0.05) differences in LDL of L3P75 and L3P100 groups respectively at month 2.
In addition, a decrease in LDL was observed for L3P, L3P25 and L3P50 groups caused with highly significant (p<0.001) and significant (p<0.05) differences in L3P25 group at second month of treatment whereas at third month, the rate increased in these groups in contrast to month 2 without reaching the rate of month 1 (Figure 3-D). An increase in the rate from the 1st to the 2nd month with a decrease in the 3rd month was obtained. During this variation, a highly significant (p<0.001) increase was revealed from month 1 to month 2 in control, L3P50, L3P75 and L3P100 groups and significant (p<0.05) in L3P25 group, followed by a significant (p<0.05) decrease from month 2 to month 3 in control, L3P25, L3P75 and L3P100 groups and very significant (p<0.01) in L3P50 group was observed (Figure 3-E). Control rats had a significantly low level (p<0.05) at month 2 compared to month 1. This rate increased at month 3. In contrast, in rats fed Moringa oleifera leaf powder, there was no significant change of LDL/HDL (Figure 3-F).
Figure 3: Variation in Lipidemia and Atherogenicity Indices
*: Comparison to first month for p<0.05; **: Comparison to first month for p<0.01, ***: Comparison to first month for p<0.001; #: Comparison to second month for p<0.05, ##: Comparison to second month for p<0.01
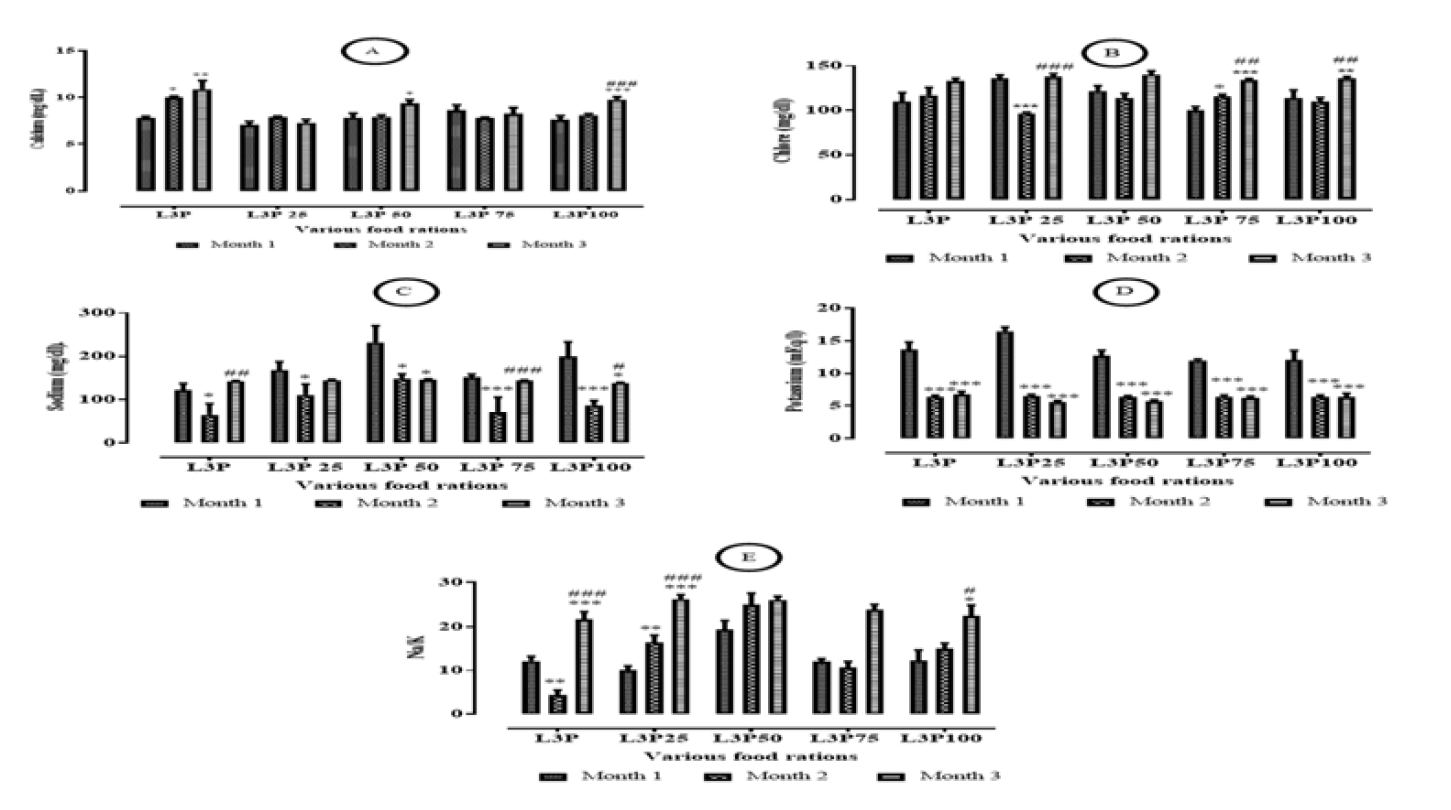
The results showed that calcium progressively increased for L3P, L3P50 and L3P100 groups from month 1 to month 3 with a significant difference (p<0.05) in control group from month 1 to month 2. For L3P100 group, a highly significant difference (p<0.01) was recorded from month 2 to month 3 (Figure 4-A). With regard to sodium, apart from L3P50 where the decrease in the rate was progressive with a significant difference (p<0.05), the other groups of rats recorded a significant decrease (p<0.05) in L3P and L3P25 lots and highly significant (p<0.001) in L3P75 and L3P100 lots at the 2nd month. This decrease is followed by a highly significant (p<0.01) increase in month 3 compared to month 1 (Figure 4-B).
Regardless of the food consumed, potassium decreased significantly with a highly significant difference (p<0.01) from month 1 to month 2 and remained constant at month 3 (Figure 4-C). In terms of chlorine, rats in L3P and L3P75 groups showed a gradual increase in chlorine with a significant (p<0.05) difference in month 2 and a highly significant (p<0.001) difference in month 3 compared to month 1. Conversely, rats fed L3P25, L3P50 and L3P100 diets experienced a decrease with highly significant difference in L3P25 group at month 2 followed by a highly significant (p<0.001) increase for L3P25 group and a highly significant (p<0.01) increase for L3P50 group at month 3 of the study (Figure 4-D). The rate of rats that consumed 75% Moringa oleifera and those that did not consume at all showed a low rate followed by an increase respectively from month 1 to month 2 and from month 2 to month 3 (Figure 4-E).
Figure 4: Variation of Ionogram
*: Comparison to first month for p<0.05; **: Comparison to first month for p<0.01, ***: Comparison to first month for p<0.001; #: Comparison to second month for p<0.05, ##: Comparison to second month for p<0.01; ###: Comparison to second month for p<0.001
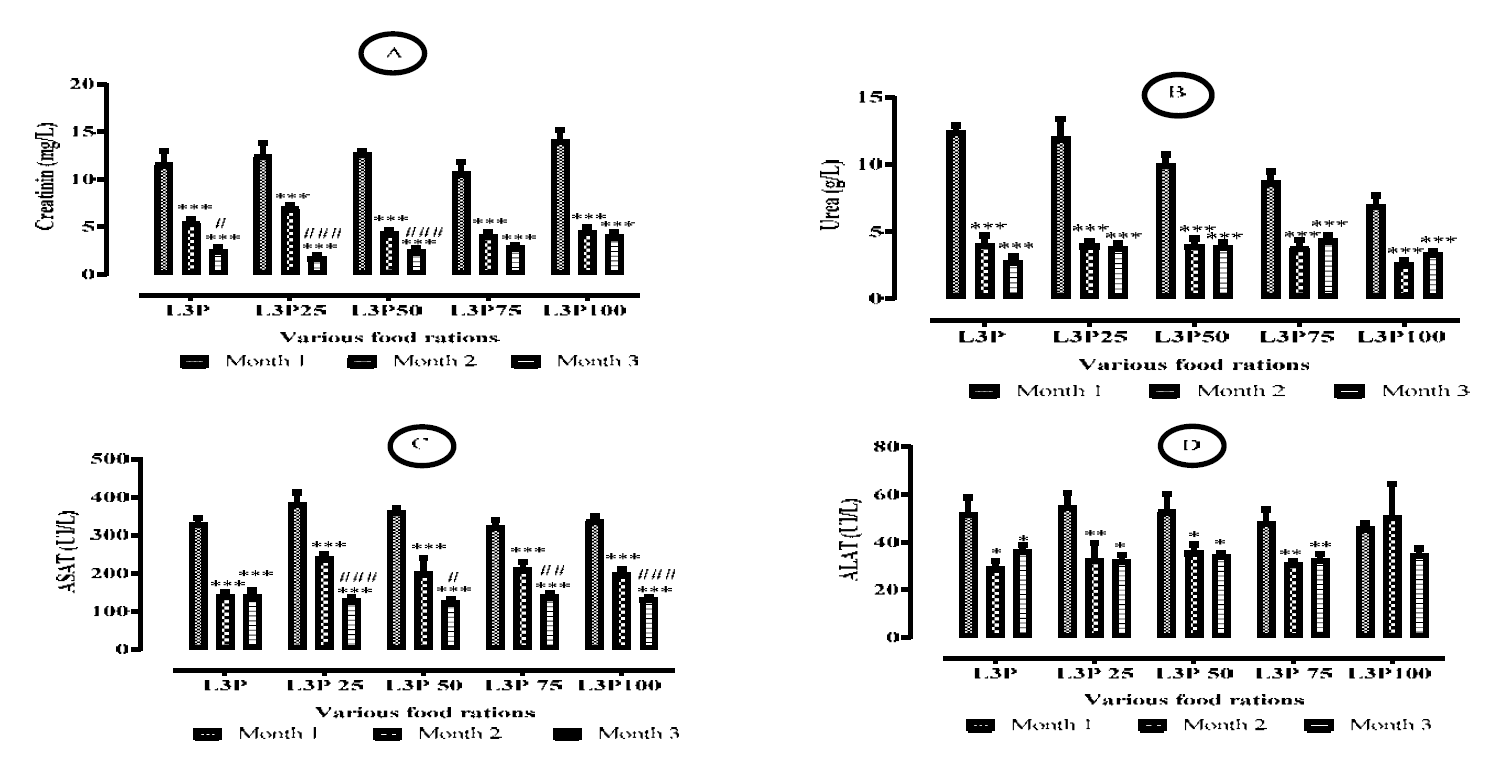
A progressive and highly significant (p<0.001) decrease (p<0.001) in urea and creatinine was recorded from 1st to 3rd month of treatment (Figures 5-A and 5-B). AST in all rats fed Moringa oleifera decreased progressively from month 1 to month 3 with a highly significant difference (p<0.001) from month 1 to month 2. In addition, apart from control group, a highly significant difference (p<0.01) was observed in test groups from 2nd to 3rd month (Figure 5-C). ALAT decreased progressively in L3P25 and L3P50 groups with very significant (p<0.01) and significant (p<0.05) differences from month 1 to month 2 in L3P25 and L3P50 groups, respectively, whereas in control and Moringa oleifera fed groups (L3P75 and L3P100), low ALAT was obtained in month 2 and increased in month 3 without reaching level of month 1 (Figure 5-D).
Figure 5: Changes of Some Renal and Hepatic Parameters
*: Comparison to first month for p<0.05; **: Comparison to first month for p<0.01, ***: Comparison to first month for p<0.001; #: Comparison to second month for p<0.05, ##: Comparison to second month for p<0.01; ###: Comparison to second month for p<0.001
DISCUSSION
After consumption of Moringa oleifera enriched food by the rats during one month, albumin of test rats showed a significant decrease compared to that of control rats. In addition, the total protein level increased in the first month before decreasing significantly in L3P25 and L3P50 groups in the second and third months of the study compared to the first month. The high levels of 75 and 100% incorporation had no significant effect on this level. Similar results were obtained by Ajibade et al. [16]. These authors suggested the selective toxicity dose of Moringa oleifera seed extract, once consumed daily, on several occasions, for a prolonged period of time. According to Marshall and Bangert [17], albuminemia tends to decrease during chronic hepatic pathologies but it usually remains normal in the early stages of acute hepatitis. In addition, Eckersall [18], believes that a decrease in serum albumin concentration may be a sign of chronic hepatitis but also of nutritional protein deficiency, anorexia, poor assimilation, impaired renal function, effusion, hyperhydration, or burns. In this study, this decrease would not be explained by a nutrient deficiency with regard to the nutritional composition of this plant [6] and its exceptional nutritional qualities in the diet in Asia and Africa because of its richness in proteins, vitamins (A, B, C, E) and mineral salts [8-11] (Ca, K, Mg, P, Iron, Zn, Se, Cu, Mn, Na, Cl). In addition, Moringa oleifera contains 18 of 20 amino acids used by the body for its functioning. This decrease cannot be a liver dysfunction as the total protein level has decreased, which indicates that the liver is functioning properly. The variation in these parameters could be explained by other extrinsic factors. The high globulin level in 1st month showed a significant decrease in 2nd and 3rd months compared to the 1st month. However, this level was significantly increased in Month 3 in the L3P25, L3P50, L3P75 groups compared to the control group. This result shows the nutritional quality of Moringa oleifera powder and partly reflects the functional capacity of plasma cells, responsible for globulin synthesis [19]. Finally, the low A/G level without much difference in the 1st month experienced a significant increase in the 2nd month before experiencing a very significant decrease in the 3rd month in all test rats. These results can be explained by the age or the quantity of powder incorporated in the different feeds. Indeed, during this study, the rate of incorporation does not vary unlike the mass of the animals and age which vary. However, in any biological phenomenon, age and mass are factors to be taken into account. A significant increase in blood sugar levels was recorded in control and test rats at the 2nd and 3rd months compared to the 1st month. Blood glucose levels in control rats normalized by the third month of the study. HDL levels were significantly increased at 25% incorporation of Moringa oleifera leaf powder during this study. In addition, daily consumption of Moringa oleifera leaf powder by rats over three months maintained HDL-cholesterol levels above those of control rats. This trend would be sought and appreciated because according to some authors, medically speaking, increased HDL is beneficial to health since it reduces the risk of coronary heart disease [20]. This result would confirm the claims of some vendors of moringa powder that its consumption would cleanse the blood of impurities. This hypothesis is reinforced by the work of Verma et al., [21] and Singh [22], who respectively indicated that the leaf of Moringa oleifera has the property of scavenging free radicals and that the aqueous extract of this plant has considerable metal chelation properties with the capacity to inhibit oxidative DNA damage. In addition, a reduction in LDL levels was detected at months 1 and 3 compared to control rats despite its increase at month 2 without significant difference. This result would indicate that feeds enriched with Moringa oleifera leaf powder are of good quality and non-aggressive to the organism, which would help prevent cardiovascular diseases. The decrease in LDL level would be due to the presence of Moringa powder in different foods because this plant has antioxidant properties [23]. Antioxidants play an important physiological role in the body by inhibiting oxidation processes, even at relatively low concentrations. They are potential scavengers of free radicals, which they convert into less reactive species [24,25]. The variation in total cholesterol levels was strongly influenced by the amount incorporation of Moringa oleifera leaf powder in the food. After one month of treatment, the high levels (75 and 100%) of Moringa oleifera leaf powder in the food led to a significant increase in total cholesterol levels in the second and third months of the study, whereas the low levels (25 and 50%) led to a decrease in total cholesterol levels in the last two months of treatment. This result suggests that the high levels of Moringa oleifera in the food would stimulate the mobilization of fat reserves in the body by disrupting the synthesis of total cholesterol, which is probably due to the presence of anti-nutritional factors, oligosaccharides and oxalates in the leaves of oleifera [26]. High total cholesterol levels could be interpreted as a sign of liver dysfunction [17]. Consequently, moderate consumption of Moringa oleifera would be more beneficial for the proper functioning of the body. The action of the low contents seems to go in the same vision as Ghasi and al [27], who reported that the raw extract of leaves reduces the cholesterol level in the liver and the kidney. According to the same authors, the leaf of Moringa oleifèra contains beta-sitosterol which lowers the blood cholesterol level in rats. Moreover, the consumption of food of plant origin has a favorable effect on the reduction of plasma cholesterol levels and the prevention of the evolution of atherosclerosis [28]. In addition, the presence of bioactive compounds in these foods plays an important role in the prevention of cardiovascular disease by improving the plasma lipoprotein profile [29]. Triglyceride levels in rats fed Moringa oleifera powder enriched diets remained consistently and highly superior to control rats during the three months. This result shows that the consumption of Moringa oleifera would be beneficial for the production of reserve lipids, which would probably be a natural alternative for an increase in energy for the proper functioning of the body and for physical efforts. However, an increase in serum triglyceride concentration may be a sign of hyperlipidemia, cholestasis, pancreatitis, exudative enteropathy, nephrotic syndrome, glucocorticoid administration, or hypercorticism. However, the triglyceride levels of rats consuming the L3P25 and L3P75 diets showed a highly significant decrease in triglycerides at 3 months compared to 1 month as did the control diet.
At the second month, the various parameters and studied were significantly increased compared to the control before decreasing significantly at the third month. This result suggests that the three-month period of consumption of Moringa oleifera-based foods transiently disturbed liver function because the disturbance recorded in the second month was corrected in the third month of treatment by a decrease in the level of. These results could be explained by the age, because during this period; becoming adults, the rats would undergo certain physiological phenomena.
Repeated consumption of Moringa oleifera leaf powder caused a significant increase in the sodium level compared to that of the control rats, while the calcium level decreased significantly in the last two months of treatment. As for the chlorine level of the test rats, it underwent a significant increase in the rats of the L3P25 group at the 1st month followed by a decrease at the 2nd month in all the groups without any significant difference compared to the control rats. Finally, a significant increase in the chlorine level was recorded in the 3rd month compared to the 2nd month of treatment. In addition, a progressive and significant decrease in potassium levels was detected in all rats fed Moringa oleifera leaf powder. In addition, a progressive increase in the Na/K ratio was observed in all rats fed Moringa oleifera leaf powder compared to control rats. These different results show that the presence of this plant in the different feeds had an influence on the changes of the studied ions. Thus, the decrease in calcium level would reflect a beneficial effect due to the consumption of Moringa oleifera powder as a dietary supplement because according to some authors, the causes of hypercalcemia are due to malignant pathologies often associated with bone metastases or primary hyperthyroidism or vitamin D intoxication [17].
The decrease in calcium levels observed in the last two months of this study is linked to the decrease in albumin levels, a transport protein because the interpretation of a decrease in blood calcium is always related to plasma albumin concentration [17]. The significant increase in sodium level especially in the group L3P50 would reflect the quality of different food formulations based on Moringa oleifera leaf powder. Indeed, the sodium ion is the essential motor of hydro-electrolytic movements. This results in a movement of absorption of NaCl and water from the intestinal lumen to the blood. In addition, the absorption of glucose and neutral amino acids is dependent on sodium because each glucose or amino acid molecule crosses the border as a brush with a Na+ ion [30].
The significant decrease in urea levels observed in test rats in the first two months was annihilated by a very significant increase in the third month in groups L3P75 and L3P100. These results suggest that after 3 months of consumption, the high levels of Moringa oleifera powder could become aggressive to the kidneys of rats. However, since urea is a nutritional parameter, its production may increase with the dietary protein ration [31]. Therefore, the increase in its level would reflect the significant nutrient intake of feeds enriched with Moringa oleifera powder. Furthermore, according to the same authors, an increase in serum urea concentration can also be a sign of nephropathy (at least 70% of non-functional nephrons), dehydration, electrolyte imbalance, hypoalbuminemia and tissue catabolism. The significant decrease in creatinine levels in all experimental rats suggests that Moringa oleifera and soybean powders had a protective effect on the kidneys that may counteract the disruptive effects of urea. These similar results between the control and test feeds could be explained by the fact that the essential amino acid levels are comparable between the leaves of Moringa oleifera and soybean [32-34].
In parallel with the control rats, a progressive and significant decrease in the ASAT level was detected in the tests. This similarity in the effect of the Moringa oleifera feed and the control feed would indicate that for this endpoint, Moringa and soybean powders would have a similar action on the liver. This result would be justified by the fact that the leaves of Moringa oleifera have a content approximately similar to that of soybean meal [35]. Moreover, the change of this transaminase would be related to the age of the animals or to the growth of the animals, since during growth, many modifications would lead to actions that would make more demands on the presence of this enzyme. At the level of ALAT, the low levels (25 and 50%) of incorporation of Moringa oleifera powder led to a gradual decrease in this rate unlike the high levels (75 and 100%) which led to an effect identical to that of the control food containing only soy. This result suggests that the low levels of Moringa oleifera powder had an influence on this transaminase. Similar results have been obtained by various authors who have shown that the use of Moringa oleifera leaves at low incorporation rates (6-15%) improves the growth performance of broilers and the laying rate of laying hens [36-38].
CONCLUSION
The results of this study highlighted the nutritional and harmless qualities of Moringa oleifera leaves at different levels in the rat diet. Overall, during the three months of the study, the variation in biochemical parameters was related to the incorporation content of the Moringa oleifera leaf powder, the age group considered and the duration of consumption of Moringa oleifera. The 75 % incorporation content of Moringa oleifera leaf powder showed a better performance in the first month. Then, in the 2nd month, it was the 50 % incorporation rate and finally in the 3rd month, the contents of 25 and 50 % incorporation of the Moringa oleifera powder gave the best activities at the level of the different biochemical blood parameters studied. However, the 1st month was marked by a significant modification of a high number of biochemical parameters contrary to the 3rd month. The rate of the majority of the biochemical blood parameters increased in the 2nd month of the study. The disturbances in the majority of these rates were corrected in the 3rd month of treatment. Foods with a low content of Moringa oleifera powder showed an efficiency for certain parameters such as total cholesterol and glycemia contrary to urea, the results are on the whole and over time better when the Moringa oleifera leaf powder was added to the food at a proportion of 50% of Glycine max (soya). This consistent performance of L3P50 is due to a combined protein intake of 50% Moringa oleifera and 50% soybean.
Kloppenburg, J. et al. “La contribution des initiatives collectives à l’instauration d’une consommation domestique soutenable: l’exemple de l’agriculture soutenue par la communauté.” Système alimentaire et sécurité alimentaire : comprendre et agir, 2005, https://www.equiterre.org/sites/fichiers/systeme-securite-alimentaire.pdf.
Food and Agriculture Organization. “Les causes de la malnutrition: Chapitre 3. nutrition et infections, santé et maladies.” 1996, http://www.fao.org/3/W0073F/w0073f04.htm.
Fuglie, L.J. The Miracle Tree: Moringa oleifera: Natural Nutrition for the Tropics. Church World Service, 1999.
Asante, W.J. et al. “Nutrient composition of moringa oleifera leaves from two agro ecological zones in Ghana.” African Journal of Plant Science, vol. 8, no. 1, 2014, pp. 65–71, https://doi.org/10.5897/AJPS2012.0727.
Ndong, M. et al. “Effects of oral administration of moringa oleifera lam on glucose tolerance in Goto-Kakizaki and wistar rats.” Journal of Clinical Biochemistry and Nutrition, vol. 40, no. 3, 2007, pp. 229–233, https://doi.org/10.3164/jcbn.40.229.
Tété–Bénissan, A. et al. “Effet de la poudre de feuilles de Moringa oleifera lam sur l’évolution du profil de l’hémogramme des enfants malnutris au togo.” African Journal of Food, Agriculture, Nutrition and Development, vol. 12, no. 2, 2012, pp. 6007–6026.
Tété–Bénissan, A. et al. “Influence of Moringa oleifera leaves on atherogenic lipids and glycaemia evolution in hiv-infected and uninfected malnourished patients.” Journal of Applied Biosciences, vol. 62, 2013, pp. 4610–4618.
Houndji, B.V.S. et al. “Pharmacological effects of Moringa oleifera (Lam.) leaves powder in the treatment of anaemia in children aged from 6 to 30 months.” Biochemistry & Physiology, vol. 7, no. 2, 2018, pp. 239–243, https://doi.org/10.4172/2168-9652.1000239.
Fawcett, J.K. and Scoot, J.E. “A rapid and precise method for the determination of urea.” Journal of Clinical Pathology, vol. 13, no. 2, 1960, pp. 156–159, https://doi.org/10.1136/jcp.13.2.156.
Budesinsky, B. “Analytical chemistry.” Chelates, vol. 18, 1969, pp. 5067–5073.
Dingeon, B. et al. “Automatic assay of blood sugar by trinder’s method.” Annales de Biologie Clinique, vol. 33, no. 1, 1975, pp. 3–13.
Young, D.S. et al. “Effects of drugs on clinical laboratory tests.” Clinical Chemistry, vol. 21, no. 5, 1975, pp. 1D–432D.
Ajibade, T.O. et al. “The Haematological and Biochemical Effects of Methanol Extract of the Seeds of Moringa oleifera in Rats.” Journal of Medicinal Plants Research, vol. 6, no. 4, 2012, pp. 615–621, https://doi.org/10.5897/JMPR11.1258.
Marshall, W.J. and Bangert, S.K. Biochimie médicale: Physiopathologie et diagnostic. Elsevier Masson, 2005.
Eckersall, P.D. “Proteins, proteomics and the dysproteinemias.” Clinical Biochemistry of Domestic Animals, 6th ed., Academic Press, 2008, pp. 117–155, https://doi.org/10.1016/B978-0-12-370491-7.00005-2.
Bayles, I. and Milcarek, C. “Plasma cell formation, secretion and persistence: The short and the long of it.” Critical Reviews in Immunology, vol. 34, no. 6, 2014, pp. 481–500.
Mayes, R.W. and Dove, H. “Measurement of dietary nutrient intake in free-ranging mammalian herbivores.” Nutrition Research Reviews, vol. 13, 2000, pp. 107–138.
Verma, A.R. et al. “In vitro and in vivo antioxidant properties of different fractions of Moringa oleifera leaves.” Food and Chemical Toxicology, vol. 47, no. 9, 2009, pp. 2196–2201, https://doi.org/10.1016/j.fct.2009.06.005.
Singh, B.N. et al. “Oxidative DNA damage protective activity, antioxidant and anti-quorum sensing potentials of Moringa oleifera.” Food and Chemical Toxicology, vol. 47, no. 6, 2009, pp. 1109–1116, https://doi.org/10.1016/j.fct.2009.01.034.
Chumark, P. et al. “The in vitro and ex vivo antioxidant properties, hypolipidaemic and antiatherosclerotic activities of water extract of Moringa Oleifera lam. leaves.” Journal of Ethnopharmacology, vol. 116, no. 3, 2008, pp. 439–446.
Mandal, S. et al. “Antioxidants: A review.” Journal of Chemical and Pharmaceutical Research, vol. 1, no. 1, 2009, pp. 102–104.
Hiragi, C.D.O. et al. “Superoxide dismutase, catalase, glutathione peroxidase and glutathione S-transferases M1 and T1 gene polymorphisms in three brazilian population groups.” Genetics and Molecular Biology, vol. 34, no. 1, 2011, pp. 11–18.
Freiberger, C.E. et al. “Nutrient content of the edible leaves of seven wild plants from Niger.” Plant Foods for Human Nutrition, vol. 53, no. 1, 1998, pp. 57–69.
Ghasi, S. et al. “Hypocholesterolemic effects of crude extract of leaf of moringa oleifera lam in high-fat diet fed wistar rats.” Journal of Ethnopharmacology, vol. 69, no. 1, 2000, pp. 21–25.
Linton, M.F. et al. “The role of lipids and lipoproteins in atherosclerosis.” Endotext, MDText.com, Inc., 2019.
Vasanthi, H.R. and Parameswari, R.P. “Indian spices for healthy heart—an overview.” Current Cardiology Reviews, vol. 6, no. 4, 2010, pp. 274–279.
Minaire, Y. et al. “Digestion et absorption dans l’intestin grêle.” Encyclopédie Médico-Chirurgicale, 1990, pp. 10–16, https://doi.org/10.1016/S1155-1968(12)53630-8.
Pitel, P.H. et al. “Approche des valeurs hématologiques et biochimiques chez deux races asines.” Pratique Vétérinaire Équine, vol. 38, no. 149, 2006, p. 19.
Bau, H.M. et al. “Effect of a solid-state fermentation using Rhizopus oligosporus sp. T-3 on elimination of antinutritional substances and modification of biochemical constituents of defatted rapeseed meal.” Journal of the Science of Food and Agriculture, vol. 65, no. 3, 1994, pp. 315–322.
Sarwar, G. and Peace, R.W. “The protein quality of some enteral products is inferior to that of casein as assessed by rat growth methods and digestibility-corrected amino acid scores.” The Journal of Nutrition, vol. 124, no. 11, 1994, pp. 2223–2232.
Makkar, H.P.S. and Becker, K. “Nutrients and antiquality factors in different morphological parts of the moringa oleifera tree.” Journal of Agricultural Science, vol. 128, 1997, pp. 311–322.
Makkar, H.P.S. and Becker, K. “Nutritional value and antinutritional components of whole and ethanol extracted Moringa oleifera leaves.” Animal Feed Science and Technology, vol. 63, 1996, pp. 211–228.
Tendonkeng, F. et al. “Essai de substitution du tourteau de soja par la farine de feuilles de Moringa oleifera dans la ration finition des poulets de chair.” Revue Africaine de Santé et de Productions Animales, vol. 7, 2009, pp. 47–52.
Olugbemi, T.S. et al. “Effect of Moringa oleifera inclusion in cassava-based diets fed to broiler chickens.” International Journal of Poultry Science, vol. 9, no. 4, 2010, pp. 363–367.
Recommended Articles
Research Article
It Remains Unproven That the Variant M.8231C>A Causes Coronary Atherosclerosis
Finsterer J
Published: 15/07/2020
Download PDF
Research Article
Leigh Syndrome Should Not Be Diagnosed Exclusively Upon Cerebral MRI
Finsterer J
Published: 15/07/2020
Download PDF
Research Article
Vision for a Brighter Kangra: Unmasking the Truth about Pink Eye – A Comprehensive Study on Types, Symptoms, and Proactive Prevention in Himachal Pradesh’s Kangra District
Deepti ,
...
Garima
Published: 11/11/2023
Download PDF
Research Article
Bioactive ingredients screening and antibacterial activity of Citrus aurantifolia leaf extract against some enteric isolates
Abdallah M.S,
Kabiru Sama’ila
Published: 10/08/2020
Download PDF
PO Box 101, Nakuru
Kenya.
Email: office@iarconsortium.org
Editorial Office:
J.L Bhavan, Near Radison Blu Hotel,
Jalukbari, Guwahati-India
Amara, A. K., N’DIA, F. K., Bleyere, M. N. & Yapo, P. A. (2020). Biochemical blood parameters in growing rats (Rattus norvegicus) fed different contents of Moringa oleifera Lam, 1785. IAR Journal of Medical Sciences, 1(1), 1-10.
MLA
Amara, Adama K., et al. "Biochemical blood parameters in growing rats (Rattus norvegicus) fed different contents of Moringa oleifera Lam, 1785." IAR Journal of Medical Sciences 1.1 (2020): 1-10.
Chicago
Amara, Adama K., Frédéric K. N’DIA, Mathieu N. Bleyere and Paul A. Yapo. "Biochemical blood parameters in growing rats (Rattus norvegicus) fed different contents of Moringa oleifera Lam, 1785." IAR Journal of Medical Sciences 1, no. 1 (2020): 1-10.
Harvard
Amara, A. K., N’DIA, F. K., Bleyere, M. N. and Yapo, P. A. (2020) 'Biochemical blood parameters in growing rats (Rattus norvegicus) fed different contents of Moringa oleifera Lam, 1785' IAR Journal of Medical Sciences 1(1), pp. 1-10.
Vancouver
Amara AK, N’DIA FK, Bleyere MN, Yapo PA. Biochemical blood parameters in growing rats (Rattus norvegicus) fed different contents of Moringa oleifera Lam, 1785. IAR Journal of Medical Sciences. 2020 Jan;1(1):1-10.


 Download PDF
 Download XML




 was high with significant difference (p<0.05) in L3P25.and L3P100 groups and highly significant (p<0.001) in L3P50 group.