Responsibility accounting is used in corporate management as an effective tool to control business activities and financial operations: information from responsibility accounting is useful for managers to evaluate the performance of the whole business as well as each subordinate division, thereby making adjustments aligned with predetermined objectives. The profound impact of the Fourth Industrial Revolution necessitated Kinh Do Holdings Co. Ltd [1] to innovate, establish and enhance the efficiency of its corporate management practices to match the current demands and trends. Surveys by the authors unveiled a basic management hierarchy and responsibility accounting system in Kinh Do Holdings Co. Ltd [1] However, its responsibility accounting practices had not been refined and structured within formal procedures.
Keywords
Responsibility Accounting
Control Tool
Corporate Management
INTRODUCTION
Around the world, responsibility accounting is no longer a new concept: it has been applied by many organizations and enterprises. However, in Vietnam, it remains a relatively novel concept. So what is the role of responsibility accounting and why is it so influential? The primary reason is responsibility accounting recognizes that each division and employee possesses the right to govern and assume responsibility for their respective operations or managerial scope, based on the principle of hierarchical reporting. Higher- level managers will utilize the reported information to recognize and evaluate the operations of their subordinate divisions and individuals. Therefore, responsibility accounting can be encapsulated within the following aspects: Information, responsibility and individual. In this context, information pertains to the gathering, reporting, and inspecting of internal data concerning business operations: Responsibility is demonstrated through the systems of processes, regulations, and principles within each division: And individuals are the primary subjects implementing responsibility accounting, undergoing training, possessing professional competence and professional ethics. These three aspects are closely correlated to each other, forming determinants of the responsibility accounting system’s quality.
The Kinh Do Group was founded in 1993 and has since become one of the leading food enterprises in Vietnam. Throughout the early years of its development, Kinh Do Group successfully established and maintained a dominant position in the market for various confectionery, biscuits, and ice cream products bearing its brand [2-3]. The profound impact of the Fourth Industrial Revolution necessitated Kinh Do Group to innovate, establish and enhance the efficiency of its corporate management practices in alignment with current demands and trends. From this point on, the enterprise changed its name to Kinh Do Holdings Co. Ltd [1]. Surveys by the authors unveiled a basic management hierarchy and responsibility accounting system in this enterprise. However, its responsibility accounting practices had not been refined and structured within formal procedures [4].
MATERIALS AND METHODS
In this paper, qualitative research methods were employed as follows:
Secondary Data Collection Method: The authors utilized Kinh Do Holdings Co. Ltd’s [1] internal information and data, including official documents, rules and regulations pertaining to the enterprise’s accounting system: the authors also made references to published books, newspapers, scientific journals and research
Primary Data Collection Method: Surveys were conducted as follows:
Subjects: Individuals who use and are provided with responsibility accounting information in Kinh Do Holdings Co. Ltd [1]
Survey Content: Includes essential demographic information and pertinent data collected through a custom-designed questionnaire
Survey Scope: At Northern and Southern branches: In departments, divisions, factories and offices
The Number of Surveyed Participants: 50 forms, for directors, direct managers, divisional heads and deputy heads and other managers of all 3 Teams as well as the leadership team of the enterprise
Survey Time: 02/01/2023 – 20/2/2023
Analysis Methods: Following the collection of primary data, the authors conducted an analysis and aggregation process in accordance with the predefined indicators. Subsequently, the current state of responsibility accounting in Kinh Do Holdings Co. Ltd [1] was revealed
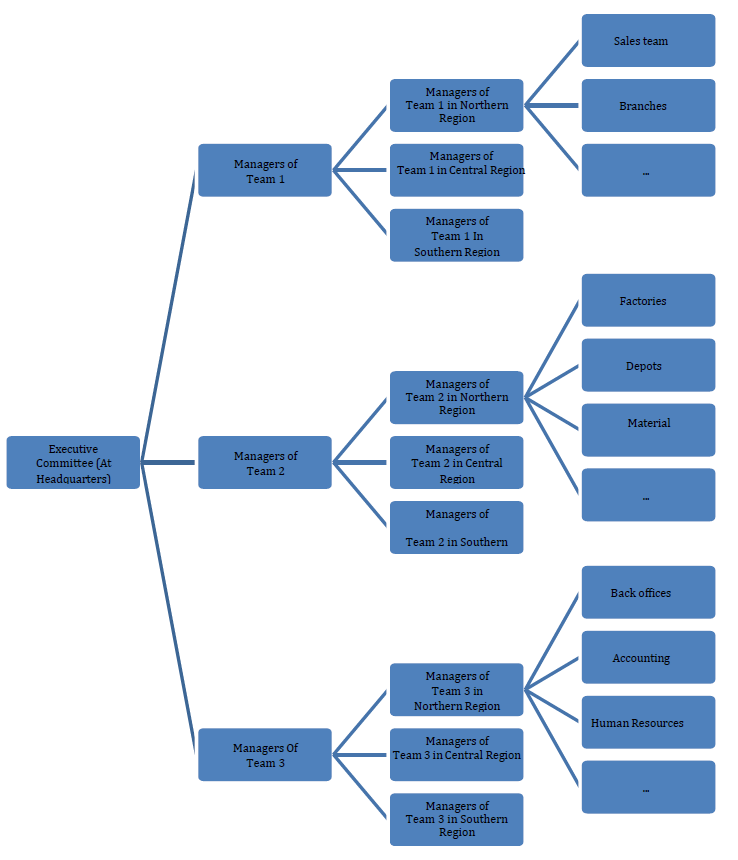
Figure 1: Management hierarchy at Kinh Do Holdings Co. Ltd [1]
The Current State of Responsibility Accounting in Kinh Do Holdings Co. Ltd [1]
The Current Classification of Responsibility Centers in Kinh Do Holdings Co. Ltd [1]: In practice, the human resources in the enterprise were divided into 3 teams, each responsible for distinct duties and exhibiting varying management characteristics. In addition, as the enterprise had facilities, factories and other assets dispersed across 3 regions, Figure 1 the hierarchical structure is presented as follows:
Accordingly, these Teams were managed by heads at the central headquarters, with divisions and teams similarly organized within branches and factories in each respective region. It is observed that responsibility centers existed in the enterprise: however, the decentralization system was not clearly established, with only a hierarchy in place for organizational management. On this basis, the responsibility centers at Kinh Do Holdings [1] were defined as follows:
Cost Center
A cost center is characterized as a unit responsible for incurred costs but not for generated revenue. Cost centers were associated with Team 2 and Team 3, which specialized in product manufacturing and finishing, quality control, logistics, warehousing, and back-office operations.
Revenue, Profit Center
Kinh Do Holdings Co. Ltd’s [1] revenues and profits were the responsibilities of Team1. Team 1 was responsible for revenues and profits, but did not possess the rights to control the enterprise’s investments. Team 1 was in charge of sales, marketing activities and setting production requirements for Team 2 regarding quantity and quality [5].
Investment Center
The investment center’s role involves making investment decisions, controlling sales, profits and other aspects of the whole enterprise. At the time, all management, capital investment and strategic development decisions were exclusively made by the executive committee. Even plant and factory managers or Team leaders did not possess the authority to utilize the enterprise’s investment capital.
The Current State of Decentralization in the Responsibility Centers
To evaluate the current state of decentralization in the responsibility centers, the authors conducted a survey using the 5-point Likert scale:
Extremely important (bearing significant responsibility to the center)
Important (bearing major responsibility)
Average (bearing partial responsibility)
Unimportant (exerting minimal impact on the responsibility center)
Extremely unimportant (exerting no impact on the responsibility center)
The authors employed descriptive statistics and the average values were illustrated using the following principle: Width = (maximum value–minimum value)/n = (5-1)/5 = 0.8
4.21-5.00 : Strongly agree/Very satisfied/Extremely important
The results were collected from the survey forms pertaining to cost responsibility. 50 survey forms were issued and distributed as follows: 5 forms for the executive committee - board of directors, 15 forms for each Team in the enterprise.
Cost Center
As observed from the results in Table 1, the company exhibited a relatively clear and precise decentralization structure, with decentralization and responsibility predominantly resting with Team 2 and Team 3, representing the production and supporting teams, respectively. Accordingly, Team 2 concentrated on responsibilities pertaining to production-related costs, with average points consistently exceeding 4.0. In addition, the manufacturing labor force at factories accounted for a significant portion of the enterprise’s workforce. As a result, Team 2 was also significantly responsible for salary costs. Team 3 concentrated on supporting the enterprise by handling administrative tasks and assuming the most substantial responsibility for salary costs, reception costs, stationery costs, and similar expenses.
Nevertheless, it is evident that the maximum authority had not been fully decentralized to the responsible Teams, as the leadership team still retained significant responsibility for production costs and salary costs. Activities that were not directly associated with Team 2 and Team 3 received points below 2.6, indicating that these teams were not accountable for issues concerning other centers.
Team 1 was responsible for both revenues and profits, represented by the enterprise’s sales team. As evident from Table 1, a high level of responsibilities was decentralized to Team 1 in relation to the revenue, profit center, with most sales-related average points surpassing 4.0. The leadership team did not excessively intervene in the revenue and profit generation process of Team 1: however, there were two activities where the board played a more substantial role compared to Team 1, pertaining to responsibility for profits of the whole enterprise and responsibility for profits before and after taxes of the whole enterprise.
Therefore, it can be inferred that Kinh Do Holdings Co. Ltd [1] implemented decentralization and permitted Team 1 (Business Team) to focus primarily on its designated tasks without involvement in other centers. Indeed, the average points for Team 1 in relation to other centers are all below 2, indicating a minimal impact.
Table 1: Survey Results Regarding Responsibility Levels within Responsibility Centers
Center
Responsibility
Leadership
team
Managers
of Team 1
Managers
of Team 2
Managers
of Team 3
Cost center
Bear responsibility for salary costs
3.40
1.60
3.67
4.40
Bear responsibility for bonus costs
2.20
2.00
2.33
4.40
Bear responsibility for customer reception costs
1.00
1.13
1.00
4.80
Bear responsibility for stationery costs
1.00
1.07
1.67
4.47
Bear responsibility for material management costs
2.60
1.00
4.10
1.00
Bear responsibility for production costs
3.80
1.00
4.80
1.00
Bear responsibility for inventory costs
1.60
1.00
4.67
1.07
Revenue, profit center
Bear responsibility for sales
3.20
4.20
1.20
1.20
Bear responsibility for sales by product type
1.60
4.73
1.13
1.00
Bear responsibility for sales of distribution unitsand agents
1.00
4.67
1.00
1.00
Bear responsibility for sales by regions
1.00
4.73
1.00
1.00
Bear responsibility for profits of branches
1.00
4.93
1.00
1.00
Bear responsibility for profits of the whole enterprise
4.80
4.40
1.95
1.00
Bear responsibility for profits before and after taxes of the whole enterprise
4.60
4.00
1.90
1.00
Investment
Center
Bear responsibility for capital investment
4.60
1.13
1.90
1.00
Source: the survey conducted by the authors
Investment Center
Based on the results in Table 1, the investment center held full responsibility for overseeing the enterprise’s investments and was entirely under the authority of the leadership team, including the executive committee and the board of directors. The results suggest that the investment center’s management team had almost no engagement with activities in the other responsibility centers, except for certain key indicators such as salary or profits of the whole enterprise. It is evident that the responsible Teams at Kinh Do Holdings Co. Ltd [1] were clearly decentralized and held precise responsibility for their respective duties. This clear decentralization is demonstrated by the fact that indicators not directly related to a center will have average points below 2, signifying no impact on other centers.
The only exception is the leadership team representing the investment center: they were still involved in certain important issues of other centers. This partially unveils the leadership team’s ingenuity in management: maintaining its importance to the responsibility centers while simultaneously granting clear and transparent authority to other responsibility centers. However, it is also clear that the enterprise’s responsibility center system was not fully developed, as teams from one center were still involved in the activities of another center.
The Current State of Performance Indicators for Responsibility Centers through Budgeted Versus Actual Data Comparison
To evaluate the current state of performance indicators through budgeted versus actual data comparison at Kinh Do Holdings, the authors surveyed the Team leaders, department heads, division heads and managers.
From Table 2, it is evident that in Kinh Do Holdings [1], only 20 units were responsible for conducting budgeting, while the remaining 10 units were not. In terms of budgeting time, at the beginning of the year, the cost center, the profit center and the investment center were 3 major units required to prepare a budgeting report.
Below are observations from the results regarding the level of engagement in the budgeting process.
Table 2: Evaluating the Budgeting Process
Content
Quantity
Percentage
Doesthe unit perform budgeting?
Yes: 20/30
67
No: 10/30
33
Budgeting time
Beginning of year: 3/20
15
Beginning of quarter: 0/20
0
Beginning of month: 14/20
70
Beginning of week: 3/20
15
Source: the survey conducted by the authors
The leadership team, comprising the board of directors and the executive committee, held the highest responsibility and complete authority over the budgeting of the enterprise’s investment capital. This team also represented the investment center, underscoring that the investment center was sufficiently empowered
In terms of profit budgeting Table 3, it is evident that the leadership team retained certain involvement with an average point of 3.2. Meanwhile, the team bearing the highest level of responsibility is Team 1, with an average point of 4.1. Hence, for the profit center, although the responsible team had the greatest level of responsibility, it was still not entirely empowered in its center. A similar pattern is noticed in the revenue center: however, in this case, the authority of the revenue center was slightly enhanced, given that the leadership team’s intervention only reached an average point of 2.6, signifying an insignificant impact on Team 1’s budgeting
Regarding the cost center represented by Team 2 and Team 3, the results suggest that these 2 teams fulfilled their correct functions: their impact on other centers was minimal at below 2. The cost center was evidently empowered and fully authorized with regard to cost budgeting in the enterprise
In summary, concerning the budgeting process in the enterprise, team participation was precisely aligned with the roles of their respective responsibility centers. However, regarding the revenue and profit center represented by Team 1, the leadership team still exerted a significant impact on Team 1’s budgeting. This partially reduced the decentralization level of responsibility accounting in the enterprise
Table 3: Evaluating the Budgeting Engagement Level
Subject
Average value
Budgeted costs
Budgeted revenues
Budgeted profits
Budgeted capital
Leadership team
1.13
2.6
3.2
5
Team 1
1.25
4
4.1
2
Team 2
4.6
1.25
1.13
1.13
Team 3
3.2
1.8
1.4
1.13
Source: the survey conducted by the authors
Table 4 It can be clearly seen that the leadership team was most responsible for comparing actual profits and capital utilization efficiency with budgeted amounts, with corresponding points of 3.2 and 4.6. Team 1 had the highest responsibility for comparing actual and budgeted revenues. Team 2 and Team 3, representing the cost center, were most accountable for comparing actual and budgeted costs, each achieving a 3.6 point.
Overall, regarding the comparison of actual versus budgeted data, responsibility centers held the corresponding responsibilities. However, in the case of the profit center, the comparison responsibility was shared by both the leadership team and Team 1.
Table 4: Performance Indicators Through Budgeted Versus Actual Data Comparison
Subject
Average value
Actual cost versus budgeted cost comparison
Actual revenue versus budgeted revenue comparison
Actual profit versus budgeted profit comparison
Actual capital efficiency versus budgeted capital efficiency
comparison
Leadership team
1.25
2.1
3.2
4.6
Team 1
1.13
4
3.2
1.13
Team 2
3.6
1
1
1
Team 3
3.6
1.25
1.35
1.1
Source: the survey conducted by the authors
The Reporting System of Responsibility Centers
Table 5 The authors conducted a survey on the reporting system of responsibility centers and obtained the following results:
Among the managers surveyed, which included 3 Team managers, it is observed that only annual reports were prepared by these 3 direct Team managers. In contrast, other periodic reports were typically prepared by group leaders and subsequently compiled by the managers. It is also evident that Kinh Do Holdings Co. Ltd [1]did not yet have quarterly reports: the reporting system mainly comprised monthly reports. This was a shortcoming in the responsibility accounting system of Kinh Do Holdings that required improvement.
Table 5: Evaluating the Reporting System of Responsibility Centers
Content
Quantity
Percentage
Weekly: 9/30
30
Reporting frequency of responsibility centers
Monthly: 18/30
60
Quarterly: 0/30
0
Yearly: 3/30
10
Report type
Actual cost versus budgeted cost comparison report: 10/30
33
Actual revenue versus budgeted revenue comparison report: 10/30
33
Actual profitversus budgeted profit comparison report: 7/30
24
Actual capital efficiency versus budgeted capital efficiency comparison report: 3/30
10
Source: the survey conducted by the authors
CONCLUSION
Kinh Do Holdings Co. Ltd [1] was decentralized into Teams, which is a suitable approach to efficient management. Furthermore, this approach served as one of the key factors enabling the company to develop a more comprehensive and precise responsibility accounting system. Nevertheless, it is evident that while Team 1 was responsible for the revenue and profit center, it was still impacted by the enterprise's leadership team. The performance indicators of the enterprise were rather simple and not sufficiently effective in evaluating the performance of each unit. The evaluation was solely reliant on comparing the actual costs, revenues, and profits to the budgeted figures, resulting in a lack of thorough analysis regarding the determinants of costs, revenues, and profits. Consequently, this impeded the ability to identify the causes and responsibilities within the units, thereby affecting the decision-making process of the managers. The responsibility accounting reporting system in the enterprise had not fulfilled the need for sufficient and precise information to evaluate the responsibility and effectiveness of management levels. The reports served merely as regulatory data compilations and were not yet useful for managers to effectively oversee operations and evaluate the performance of subordinate units.
REFERENCE
Kinh Do Holdings Co. Ltd. Internal reports.
Huynh, L. Management accounting. Transport Publishing House, 2009.
Nguyen, Q.N. Management accounting. National Economics University Publishing House, 2012.
Pham, D.V. The divisional responsibility accounting structure in Vietnamese commercial enterprises. 2010.
Ngoc Lan, T., Nguyen Thanh, P. & Thuy Hang, T. T. (2023). Responsibility Accounting in Food Enterprises – A Case Study at Kinh do Holdings Company Limited. IAR Journal of Business Management, 4(2), 1-6.
MLA
Ngoc Lan, Thi, Pham Nguyen Thanh and Ta Thi Thuy Hang. "Responsibility Accounting in Food Enterprises – A Case Study at Kinh do Holdings Company Limited." IAR Journal of Business Management 4.2 (2023): 1-6.
Chicago
Ngoc Lan, Thi, Pham Nguyen Thanh and Ta Thi Thuy Hang. "Responsibility Accounting in Food Enterprises – A Case Study at Kinh do Holdings Company Limited." IAR Journal of Business Management 4, no. 2 (2023): 1-6.
Harvard
Ngoc Lan, T., Nguyen Thanh, P. and Thuy Hang, T. T. (2023) 'Responsibility Accounting in Food Enterprises – A Case Study at Kinh do Holdings Company Limited' IAR Journal of Business Management 4(2), pp. 1-6.
Vancouver
Ngoc Lan T, Nguyen Thanh P, Thuy Hang TT. Responsibility Accounting in Food Enterprises – A Case Study at Kinh do Holdings Company Limited. IAR Journal of Business Management. 2023 Jul;4(2):1-6.


 Download PDF
 Download XML