Integration between Administrative Development and Quality of Life: Toward a Sustainable and Productive Work Environment. An Analytical Study in the College of Administration and Economics, University of Mosul
Walaa Hazem Seltun
1
,
Salahddin Shibil Jasim Aljubory
2
1
Technical Management Institute, Nineveh, Iraq
2
College of Basic Education, Shirqat, University of Tikrit, Iraq
The topic of administrative development has become one of the important topics pursued by any goal-oriented administrative institution. Visions in this area now occupy managers’ minds as they seek to introduce developmental curricula and programs to keep pace with work processes within the institution. The study and analysis of the factors contributing to administrative development and the investigation of the importance of the place of administrative development within the organizational structure, as well as the analysis of scientific standards based on modern concepts and their comparison with institutional reality, all converge to produce the most important findings, conclusions, and practical recommendations for the educational institution under study. Based on the above, the researchers proposed a hypothetical algorithmic model that examines the factors, programs, standards used, and the obstacles to implementation that impede the administrative development process in educational institutions. This model tests a hypothesis using statistical methods on data collected via a designed and scientifically refined checklist reviewed by a panel of eminent academics who played a key role in research in this field, to produce the most important conclusions and fruitful recommendations for the educational institution under study.
Keywords
Administrative Development
Standards of Life Quality
INTRODUCTION
The topic of administrative development has received great interest across educational institutions, and the attention continues to grow as activities expand and services modernize in educational institutions. This development aims to align with and meet the needs and desires of employees and the customers served by these institutions by adopting the principles, concepts, and standards for measuring the level of development in their institutions and comparing them with theoretical frameworks.
Against this backdrop, the present research presents an integrated methodology for the study and outlines the theoretical premises related to administrative development, including its concept, importance, objectives, characteristics, relevant theories, and the standards used to measure the effectiveness of administrative development and the factors influencing it, including the placement of development within organizational structures and life-quality at work programs that contribute to administrative development. It also discusses the obstacles to the success of administrative development and proceeds to measure those standards and obstacles within the educational institution (the Deanery of the College of Administration and Economics) to present the researchers’ most important conclusions and recommendations for the educational institution in particular and similar institutions in general.
Study Methodology
The study methodology includes the problem statement, its causes and significance, aims, the hypothetical framework, hypotheses derived from it, delimitations, data collection methods, information sources, and the statistical tools used, as follows.
Problem of the study and its causes
Modern educational institutions strive to continuously develop their staff to advance their status, and this ongoing effort will not be easy amid a changing environment. The current study seeks to diagnose the main problem by asking whether there are measurement standards for administrative development within the investigated institution, through the following sub-questions:
Do the institution’s administration staff have awareness and understanding of the concept of administrative development
What is the position of the management of the studied institution regarding the standards for measuring administrative development
Is there broad awareness of the development programs for administrative departments within the studied institution
To what extent are there obstacles hindering administrative development
Significance of the Study
The study’s significance stems from the nature of its topic, as it aims to shed light on modern concepts of administrative development and the factors affecting development activities, as well as the most important standards and programs aimed at achieving a better life quality at work, by identifying the gap between theories and modern standards in administrative development and their field application in the Deanery of the College of Administration and Economics.
Objectives of the Study
The main objective is to contribute to raising institutional performance by diagnosing areas for administrative development, identifying standards for measuring its effectiveness, and understanding the reflections of those standards on development activities within the educational institution.
Heoretical-Analytical Plan
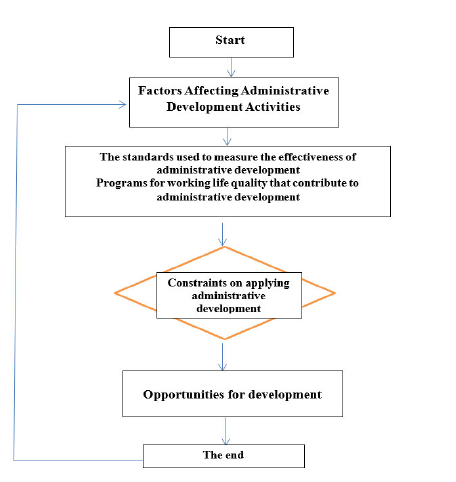
To address the main problem and its subproblems and achieve the study’s objectives, an operational plan was adopted, consisting of a hypothetical (algorithmic) model that outlines scenarios for charting administrative development in the educational institution under study. Figure 1 presents the procedural diagram of the research.
Study Hypotheses
In line with the research orientations and the proposed hypothetical model, and based on the importance of the study and its objectives, the study adopts a main hypothesis as follows:
“The extent of applying administrative development standards in the Deanship of the College of Administration and Economics.”
Data and Information Collection Methods
In order to obtain the data and information necessary to achieve the study’s objectives and test its model, the researchers covered the theoretical aspect by consulting numerous reliable scientific sources, latest journals, books, and the international information network, in addition to reviewing many individuals interested in this field, with the aim of building a clear scientific framework aligned with the subject.
As for the empirical side, the researchers used a (checklist) approach, which was tested, reviewed, analyzed, and resulted in results expressed by clear statistical formulas, personal interviews with senior leadership and stakeholders involved in development were also conducted to measure the topic’s importance within the educational institution under study.
The Intellectual Foundations of Administrative Development
The Concept of Administrative Development and Its Definition: Modern management literature struggles to provide a single precise definition of administrative development due to the topic’s complexity and its branching into multiple concepts. It has thus become necessary for scholars interested in this field to explore and articulate definitions that serve the aims of the current study and its methodology.
Al-Sayrafi defines it as “the continuous improvement in the performance of management by applying practical methods in work, addressing emerging problems, and supporting administrative capabilities.”
Tharwat defines administrative development as “the process of equipping administrators with the skills and knowledge that help them improve their performance at work and raise their competence in facing administrative problems.”
Ismail and Nashaat describe it as “a planned and studied effort aimed at developing and improving performance in governmental apparatus by affecting workers’ values, developing their skills, and changing their behavioral patterns to improve the organization’s ability to make decisions and solve problems, and to create balanced relations between the organization and its environment through the use of behavioral sciences.”
An operational definition used by the researchers: “the process of continuous improvement in the performance of administration by equipping staff (administrative and technical) with the necessary skills and information by following scientifically sound methods to avoid problems and elevate administrative capabilities.”
The Importance of Administrative Development
The importance of administrative development in contemporary institutions is evident due to the urgent and strong need to raise performance levels and keep pace with rapid scientific advancements across all aspects, while also addressing the numerous internal and external environmental changes at all levels. Its significance, as agreed by many researchers [1-3], rests on several grounds:
To maximize the utilization of an institution’s physical and human resources to achieve desired objectives through the programs and services it offers
To meet public demands and satisfy their basic knowledge and entertainment needs
To address social shifts in the values held by younger generations, which differ from those of older generations, thereby necessitating a re-evaluation of methods, means, and processes in institutions in general to align with new environmental conditions and values, while considering diversity and compatibility among them
Third: Characteristics of Administrative Development
Ali and Al-Umari point to a set of characteristics that distinguish administrative development. In this view:
Administrative development is a planned strategy aimed at achieving change and renewal within the organization and its leadership
It represents a path for involving employees in decision-making within the institution
Administrative development focuses on specific approaches to develop and support performance and quality
Al-Sakkarna notes the following characteristics:
Problem solving and training individuals to diagnose and solve problems rather than merely discussing them; it also rests on human values, including beliefs and positive values about growth and development and the necessity to provide opportunities for individuals to develop and collaborate [4]
A characteristic of administrative development is feedback provided by individuals to supply information that benefits the departments in making their decisions, with a stance that is flexible to the institution’s needs
In this context, researchers view the characteristics of administrative development as the planned strategy aimed at achieving organizational change and renewal through empirical experience, investigation of administrative and technical problems faced by staff while performing their duties
Standards for Measuring the Effectiveness of Administrative Development and Life Quality Programs Contributing to Development and Its Success Barriers
Criterion of Factors Affecting the Consolidation of the Administrative Development Experience: There are factors that influence the benefits of the administrative development experience and make it feasible, while the absence of these factors renders the change process superficial, marginal, short-term, and ineffective for employees' lives within the organization. These factors have been identified based on discussions by Maher [5], Badr [6] and Munir and others. Specifically:
Intensification of Alignment With the Organization's Values: Alignment of intervention with organizational values is a behavior that harmonizes with employees' values and work standards through employee involvement based on total quality management principles
Environmental Stability: The more stable the work environment (internal and external), the easier it is to introduce new ideas and intervention methods of administrative development, enabling employees to commit to applying and transferring them to the work areas
Stability of Human Resources: Stability of human resources refers to having the ideal number of employees, stable performance, and consistent payroll and incentive systems
Clarity of Objectives: Lack of clear objectives leads to anxiety and ambiguity about the required results, resulting in unclear activities needed to achieve these goals and difficulties in assigning responsibilities due to unclear intervention objectives
Clarity of Plans: When objectives are clear, they can be easily translated into development plans. Development plans consist of activities and processes, distributed among those responsible, time-phased in schedules and timelines, with specified financial resources (budgets)
Management Support: Support from senior management is one of the most important factors for the success of administrative development. Their support manifests as aware leadership, continuous presence, moral support, supervision, formation of working groups, and provision of appropriate organizational structures
Enabling Systems: Administrative development efforts require supporting systems such as information systems, data collection and statistical analysis, organizational structures, planning systems, access to external consultants and leadership, meeting systems, formation of work teams, and communication
Criterion of the Position of Administrative Development within the Organizational Structure
The administrative position of administrative development varies from one institution to another depending on the institution’s size, activity, significance, and the belief of its senior management in the importance and role of administrative development in the process of development and change to achieve its goals and develop its cadres at different occupational levels. It can be at one of the following levels:
At the level of a General Administration (General Administration of Administrative Development) and
Figure 1: The Research Procedural Diagram
connected to the highest authority in the ministry, institution, department, or organization (the minister, deputy minister, head of the institution, head of the department, or chairperson of the board in a company or organization)
At the level of a Department (Administrative Development Department) connected to the general manager in the organizational structure, which is feasible if the general manager represents the highest authority in the department and the department operates independently from the ministry or organization
At the level of a Unit (Administrative Development Unit) connected administratively to the head of a sub-formation and technically linked to the Administrative Development Section at the center
At the level of a Section (Administrative Development Section) connected administratively to the head of the sub-formation and technically linked to the Administrative Development Division at the center
From this, it is evident that the placement of administrative development within the organizational structure depends on the size and activity of the institution, and it is difficult to set it for one institution without considering another; it may be housed in a ministry in one institution or in a general administration in another, or at the level of department, section, or unit.
Criterion for Measuring the Effectiveness of Administrative Development
Through synthesis and review of sources and contemporary studies on administrative development, researchers note two main approaches to measuring its effectiveness, discussed by Munawa and Said:
The Parsuraman et al. method (SERVQUAL), which relies on employees’ (customers’) expectations of service level and their perception of the service actually delivered. This is done through the SERVQUAL scale (also known as the PZB model). It assesses the gap between customer expectations and actual service performance via the formula:
Gap = Customer expectations − Actual service performance
This model is a rigorous multi-dimensional tool that can be used to achieve the best expectations and perceptions formed by customers.
The Taylor and Cronin method (SERVPERF) considered more comprehensive and based on measuring actual performance through the formula:
Service quality = Actual performance
This approach focuses on performance quality and is viewed as a form of performance orientation. SERVPERF and SERVQUAL share the same main dimensions used to measure service quality: tangibles, reliability, responsiveness, assurance, and empathy.
Focusing on certain standards in measuring the effectiveness of administrative development serves the aims of the current study; thus, it was agreed to adopt some standards that support the research, as [8] indicate:
Commitment to the Plan: adherence to the planned objectives that include the development plan and the results to be achieved, ensuring goals are met through (employee satisfaction, customer satisfaction, full compliance with quality standards)
Satisfaction Standard: this relies on survey items covering topics, preferences, brevity, rating scales, and respondents, such as overall job satisfaction and satisfaction with work components (pay, supervision, job characteristics, training satisfaction)
Employee Mobility (turnover) Standard: an important indicator of employee flow and attachment to their work
Absence: the use of quality-of-life programs to reduce absenteeism and increase job attachment, measured
By the absenteeism rate (the number of days a worker is absent from work during a period):
Turnover (Attrition): this indicates the rate at which workers leave sections or departments, typically relying on external hires or resignations; in life-quality programs, voluntary turnover (employee desire) is used
Overall accident/illness rate: this reflects accidents in the organization’s records related to work performance or environmental conditions, calculated as (total accidents/illnesses) divided by (annual working hours)
Complaints: broken down into firm-level complaints (official complaints) and individual-level complaints (claimants relative to workforce). It also includes strikes and work stoppages, with calculation methods such as (number of employees on strike × days of strike) / (average number of workers × days worked)
Employee performance: aims to assess employees’ progress and potential development, with high performers possibly receiving incentives and others requiring training or career path reconsideration
Administrative Review: essential to identify organization’s strengths and weaknesses; an internal method to review HR practices and the starting point for organizational improvement
Standards of Quality of Life at Work Programs Contributing to Administrative Development
The standards of quality-of-life-at-work programs are modern administrative concepts that have gained acceptance in many contemporary institutions due to their essential role in developing individuals, improving the requirements of the work environment, fostering a sense of belonging, and adopting the idea of development. When exploring quality-of-life-at-work programs, one must start with general concepts. Both Nasr [9] and Janet and Aniolase and Ogung Bamila [10] state that the concept of quality of life means a comprehensive, holistic construct that consists of a set of varied and purposeful variables aimed at satisfying the basic needs of individuals living within the scope of work life, which can be measured by objective indicators of flowing values and subjective indicators of its capacity to be satisfied. Quality of life at work, as described by Ozturk [11], is the awareness of workers to achieve balance among physical, psychological, and social aspects to achieve life satisfaction and to enjoy official working times and positive responses to what is expected. Surya [12] defines it as the organizational culture that contributes to creating contemporary organizational institutions and environments free of fear, aimed at empowering workers and integrating them with increasing commitment and loyalty among workers, especially since decisions are clear and come from the workers themselves through adopting administrative concepts such as management by objectives, management by participation, and the principle that management is everyone’s responsibility, which was affirmed by the Total Quality Management school.
Organizations striving to achieve many pioneering advantages in administrative development must adopt programs in their management, such as the Quality of Life at Work program, represented by Nasr [9,11]:
A program contributing to providing more flexible work, loyalty, and motivation; a participation program by involving a larger number of employees in all work, community, and environmental issues; a program for developing organizational capabilities based on efficiency; a program for well-being and enjoyment at work. Implementing quality-of-life-at-work programs leads to a general view of the aspects of these programs in [13] providing a healthy and safe work environment, enabling a supportive workplace atmosphere for performance, and actual participation in its broad sense.
Obstacles to Administrative Development
Administrative development faces many obstacles that hinder improving organizations, and among the obstacles agreed upon by researchers [14] are:
Administrative obstacles: represented by an excess number of employees in organiz
ations beyond actual need, the emergence of resistance to change among employees and lack of adherence to the ethics of public service, and the spread of administrative corruption, as well as a lack of trust between leadership and employees
Behavioral obstacles: among the most important obstacles is employees’ unwillingness to change and their clinging to the status quo, lack of courage among administrative leaders, lack of initiative to undertake development, and failure to motivate developmental efforts within the institution, along with consulting foreign experts to design the administrative development program without considering the prevailing environmental conditions
Technical obstacles: technical efforts in administrative development are constrained by the technical side used within the institution, limited by the lack of an appropriate technical level for the work
Social obstacles: society has different manifestations that hinder the development march of institutions, including weak social interaction among employees within the organization (superiors and subordinates) and the persistence of some bad social customs and traditions that affect administrative development programs, such as nepotism and favoritism
Cultural obstacles: the identity of any organization is highlighted through the culture of its employees; a major factor making organizational culture an obstacle is the gap and divergence between individuals’ values and orientations and the organization’s values and culture, and the difference between the leadership behavior and the behavior that employees expect and believe in
Legal obstacles: legislation and existing legal frameworks often stand as obstacles to administrative development, with one of the most important obstacles being the aging of labor-related laws and their failure to keep pace with the progress of the era
Political obstacles: political obstacles arise from political instability and disputes among multiple political forces that spill over into institutions, negatively affecting the path of administrative development, including interference by political authorities in the affairs of institutions and their decision-making
Fieldwork
Description of the Respondents: A purposive sample was chosen consisting of decision-makers in the Deanship of the College of Administration and Economics / University of Mosul. The research team used (the interview method) with officials concerned with administrative development to ensure credibility and conformity by using a method that includes answering several items for each standard and each obstacle, organized within a (checklist). Through face-to-face interviews and by comparing the actual situation in the educational institution and the sections and administrative units in the Deanship, represented by (Quality Assurance and Performance Evaluation, Information Technology Unit, Human Resources Unit, Continuing Education Unit, Scientific Affairs Unit), and obtaining complete information related to the topic of administrative development through the checklist designed for this purpose by the research team. Appendix no. 1.
Implementing the standards of administrative development in the Deanship of the College of Administration and Economics
This section aims to present and analyze the data collected by the concerned parties through conducting interviews with unit and department heads to answer the checklist. The following formulas were relied upon:
Percentage Formula:100 × ( Σx_I × Σf_i × 4 ) = %
Where x_I = weights, f_i = frequencies, and the number 4 indicates the highest weight in the scale used. The purpose of calculating the percentage for each item is to express the level of saturation (relevance) of each item of administrative development in the application
The Gap Size is Calculated By:(percentage achieved) - 100
Researchers used a five-point weight scale when analyzing the checklist for each standard, allocating a weight to each item of the scale, starting with the number 4 which represents the highest weight on the scale, which indicates the degree to which the item is present in the Deanship’s environment.
The field-side equations were adopted from the following sources:
Abdul Wahab and Suleiman, 2015
Al-Na’imi, Lamia, 2011
Measuring the Standards of Administrative Development at the Deanship of the College Of Administration and Economics, University Of Mosul
Methods for measuring the effectiveness of administrative development: Methods for measuring the effectiveness of administrative development are among the standards pursued by the Deanship of the College of Administration and Economics. Through analysis of the checklists, the deanery was found to have variability in its sub-standards, with measurable aspects such as the quality of service provided to the client (beneficiaries) for tangible elements, and elements represented by reliability, responsiveness, safety, empathy, and care, in addition to credibility and realism, all measured by the effectiveness of administrative development in terms of the actual performance of service quality.
Table 1: Metrics and Weights Used in the Checklists
No.
The scale
Weight
1
Very available
4
2
Available
3
3
Neutral
2
4
Not available
1
5
Not available
0
Table prepared by the researchers
Table 2: Methods for Measuring the Effectiveness of Administrative Development
Weights
4
3
2
1
0
Total
Repetitions
10
5
2
1
1
19
Result
40
15
4
1
0
60
Average 60/19
3
Percentage 79%
The gap size 21
Table prepared by the researchers based on the results of analyzing the checklist for the standard “Methods for measuring the effectiveness of administrative development” and the statistical formulas used in the study
Table 3: The Calculation of the Summary Equations for the Standard “Compliance with the Plan”
Weights
4
3
2
1
0
Total
Repetitions
6
3
2
0
1
12
Result
24
9
4
0
0
37
Average 37 /12
3
Percentage 77%
The gap size 23
Table prepared by the researchers based on the results of analyzing the checklist for the standard “Compliance with the Plan” And the Statistical Formulas Used in the Study
Table 4: Shows the Calculation of the Summary Equations for the Standard “Quality”
Weights
4
3
2
1
0
Total
Repetitions
4
3
0
0
8
15
Result
16
9
0
0
0
25
Average 15/25
2
Percentage 42%
The gap size 58
Table prepared by the researchers based on the results of analyzing the checklist for the quality standard and the statistical formulas used in the study
Table 5: The Calculation of the Summary Equations for the Standard “Satisfaction”
Weights
4
3
2
1
0
Total
Repetitions
0
1
0
0
13
14
Result
0
3
0
0
0
3
Average 3/14
0
Percentage 21%
The gap size 79
Table prepared by the researchers based on the results of analyzing the checklist for the standard “Employee Mobility” and the statistical formulas used in the study
Table 6: The Calculation of the Summary Equations for the Standard “Employee Mobility”
Weights
4
3
2
1
0
Total
Repetitions
7
2
4
1
21
35
Result
28
6
8
1
0
43
Average 34/43
1
Percentage 31%
The gap size 69
Table prepared by the researchers based on the results of analyzing the checklist for the standard “Employee Performance” and the statistical formulas used in the study
Table 4 shows the calculation of the summary equations for the standard “Methods for measuring the effectiveness of administrative development,” indicating a achieved percentage of 79% for the availability of the standard’s variables, and 21% representing the gap size, with a weighted average of 3 out of 4.
Standards for Measuring the Effectiveness of Administrative Development
Standards for measuring the effectiveness of administrative development are an important criterion for assessing the sub-standards and sub-items of the standards, as these criteria represent a unique starting point to chart the correct path through the analysis of the following sub-standards
Compliance with the Plan Standard
The results of the analysis of the checklist for the sub-standards of the compliance-with-the-plan measure showed that the deanery adheres to the planned objectives when forming the development plan and the required results, by ensuring the presence of the second standard: when drafting the comprehensive development plan, attention must be paid to employee and customer (beneficiary) satisfaction and full adherence to quality standards. However, the deanery does not have time maps for implementation that include a situational study, outlines for the implementation plan, execution, and feedback reports. Table 5 shows the calculation of the summary equations for the standard “Compliance with the Plan,” indicating a percentage of 77% for the sub-variables of this standard, with a gap size of 23 and a weighted average of 3 out of 4.
Quality Standard
The results of the checklists indicated that the quality standard was available at a rate of 42%, while the weighted average was 2 out of 4. The standard showed a gap size of 58. This result, based on the analysis of the checklist for this standard against its sub-standards, indicates that it is characterized by objectivity, tangibility, and materiality. Moreover, quality is measured by its negative aspects, defects, and negative returns, and in quantitative terms or monetary value. However, the Deanship lacks a specific standard that compares before and after development across the college’s departments or the quality standards used previously. Table 4 shows the calculation of the summary equations for the standard “Quality.”
Satisfaction Standard
The results of the checklists indicated that the availability of the satisfaction standard was not present in the Deanship at a rate of 21%, with a weighted average of 0 out of 4, while the gap size was 79. This is attributed to the analysis of the sub-standards results, which show that the Deanship does not prepare a survey covering all topics, preferences, brevity, measurement scales, and respondents. In addition, the overall satisfaction standard is not available in work components such as wages, supervision, job characteristics, and satisfaction with training, meaning there is a lack of ongoing monitoring by the Deanship for this standard due to not providing a survey list. Table 5 shows the calculation of the summary equations for the standard “Satisfaction.”
Employee Mobility Standard
The results for this standard show that the deanship does not have sub-standards available as a percentage, with a rate of 31% and a weighted average of 1 out of 4, and a gap size of 69. This result reflects the analysis of the sub-standards, which indicate that the deanship does not have employee quality-of-life programs that reduce absenteeism. In addition, there is no measured turnover rate and no data on the rate of staff entering and leaving units or departments, or the average number of employees recorded for work-related incidents or illnesses, and there is variation in the rate of complaints at the individual level.
Employee Performance Standard
This standard, as revealed by the analysis of the checklist results for the sub-standards, shows that the availability of this standard in the Deanship was 60% with a weighted average of 2 out of 4 and a gap size of 40. The analysis of the sub-standards indicates that the Deanship conducts training for employees or revisits their career paths or those in need of retraining and placement them in appropriate positions, whereas the Deanship does not have motivational incentives for high-performing employees. Table 7 shows the calculation of the summary equations for the standard “Employee Performance.”
Administrative Audit Standard
An analysis of the checklist for the Administrative Audit standard shows that the deanery has sub-standards available at a rate of 59% and a weighted average of 1 out of 4, with a gap size of 41. This is attributed to the fact that the deanery is aware of its strengths and weaknesses through this standard, but it does not have validated checklists across the extent of reviewing its development programs and methods in relation to employees’ expectations. Table 8 shows the calculation of the summary equations for the Administrative Audit standard, and there was variation in the Administrative Audit standard that helps the institution review its human resources management practices.
Standards for Quality-of-Life-at-Work Programs Contributing to Administrative Development
Analysis of the checklist results for the standard of quality-of-life-at-work programs contributing to administrative development indicates that the availability of this standard in the deanery is 49%, with a weighted average of 2 out of 4, and a gap size of 51. This is attributed to the deanery adopting modern administrative concepts such as management by objectives, management by participation, and the principle of total quality management. There is variation in the deanery regarding implementing a program to involve a larger number of employees in all work, community, and environmental issues, as well as variation in having a program for developing institutional capabilities based on competency, and the absence of welfare and enjoyment at work programs, as well as the absence of a program to provide more flexible work arrangements, loyalty, and motivation. Table 9 shows the calculation of the summary equations for the standard “Quality of Life at Work Programs Contributing to Administrative Development.”
Table 7: The Calculation of the Summary Equations for the Standard “Employee Performance”
Weights
4
3
2
1
0
Total
Repetitions
5
0
2
0
3
10
Result
20
0
4
0
0
24
Average 10/24
2
Percentage 60%
The gap size 40
Table prepared by the researchers based on the results of analyzing the checklist for the standard “Administrative Audit” and the statistical formulas used in the study
Table 8: The calculation of the summary equations for the Administrative Audit standard
Weights
4
3
2
1
0
Total
Repetitions
4
0
2
4
8
18
Result
16
0
4
4
0
24
Average 18/24
1
Percentage 59%
The gap size 41
Table prepared by the researchers based on the results of analyzing the checklist for the standard “Quality of Life at Work Programs Contributing to Administrative Development” and the statistical formulas used in the study
Table 9: The calculation of the summary equations for the standard “Quality-of-Life-at-Work Programs Contributing to Administrative Development”
Weights
4
3
2
1
0
Total
Repetitions
7
4
3
1
9
24
Result
28
12
6
1
0
47
Average 24/47
2
Percentage 49%
The gap size 51
Table prepared by the researchers based on the results of analyzing the checklist for the standard “Administrative Obstacles” and the statistical formulas used in the study
Table 10: The Calculation of the Summary Equations for the Standard “Administrative Obstacles”
Weights
4
3
2
1
0
Total
Repetitions
4
5
0
2
4
15
Result
16
15
0
2
0
33
Average 15/33
2
Percentage 55%
The gap size 45
Table prepared by the researchers based on the results of analyzing the checklist for the standard “Behavioral Obstacles” and the statistical formulas used in the study
Table 11: The calculation of the summary equations for the standard “Behavioral Obstacles”
Weights
4
3
2
1
0
Total
Repetitions
5
3
0
4
3
15
Result
20
9
0
4
0
33
Average 15/33
2
Percentage 55%
The gap size 45
Table prepared by the researchers based on the results of analyzing the checklist for the standard “Technical Obstacles” and the statistical formulas used in the study
Table 12: The calculation of the summary equations for the standard “Technical Obstacles”
Weights
4
3
2
1
0
Total
Repetitions
4
0
0
4
7
15
Result
16
0
0
4
0
20
Average 15/20
1
Percentage 33%
The gap size 67
Table prepared by the researchers based on the results of analyzing the checklist for the standard “Social Obstacles” and the statistical formulas used in the study
Administrative Obstacles
The results of analyzing the checklist for the Administrative Obstacles standard show that the Deanship has the sub-standards for this measure available at a rate of 55%, with a weighted average of 2 out of 4, and a gap size of 45. The reason for this is the lack of coordination and follow-up in administrative development efforts and the gap between the institution’s goals and employees’ goals. Regarding the criterion of increasing the number of employees beyond the actual need, the Deanship does not need to increase its number of employees. Table 10 shows the calculation of the summary equations for the standard “Administrative Obstacles.”
Behavioral Obstacles
The results of analyzing the checklist for the Behavioral Obstacles standard show that the Deanship has this standard available at a rate of 55%, with a weighted average of 2 out of 4, and a gap size of 45. The outcome indicates that employees lack the willingness to change and cling to the status quo, as well as a lack of courage among administrative leaders and initiative to undertake development, and a failure to motivate developmental efforts within the Deanship. It also notes a reluctance to engage foreign experts to design the administrative development program without considering the prevailing environmental conditions. Table 11 shows the calculation of the summary equations for the standard “Behavioral Obstacles.”
Technical Obstacles
The results of analyzing the checklist for the Technical Obstacles standard indicate that the Deanship has the sub-standards for this measure available at a rate of 33%, with a weighted average of 1 out of 4, and a gap size of 67. This is attributed to the absence of evasiveness by employees in dealing with service technologies due to the spread of electronic fear, and there is no gap between the available technology and the technology needed for administrative development. In addition, the standard noting the lack of appropriate training for personnel to handle technological tools proficiently is not available. Table 12 shows the calculation of the summary equations for the standard “Technical Obstacles.”
Table 13: The calculation of the summary equations for the standard “Social Obstacles”
Weights
4
3
2
1
0
Total
Repetitions
1
0
0
6
7
14
Result
4
0
0
6
0
10
Average 10/14
1
Percentage 18%
The gap size 82
Table prepared by the researchers based on the results of analyzing the checklist for the Cultural Obstacles standard and the statistical formulas used in the study
Table 14: The calculation of the summary equations for the standard “Cultural Obstacles”
Weights
4
3
2
1
0
Total
Repetitions
8
2
4
0
2
16
Result
32
6
8
0
0
46
Average 16/46
3
Percentage 72%
The gap size 28
Table prepared by the researchers based on the results of analyzing the checklist for the Legal Obstacles standard and the statistical formulas used in the study
Table 15: The calculation of the summary equations for the Legal Obstacles standard
Weights
4
3
2
1
0
Total
Repetitions
0
4
2
4
4
14
Result
0
12
4
4
0
20
Average 14/20
1
Percentage 36%
The gap size 64
Table prepared by the researchers based on the results of analyzing the checklist for the Political Obstacles standard and the statistical formulas used in the study
Table 16: The calculation of the summary equations for the Political Obstacles standard
Weights
4
3
2
1
0
Total
Repetitions
0
1
1
6
7
15
Result
0
3
2
6
0
11
Average 11/15
1
Percentage 18%
The gap size 82
Table prepared by the researchers based on the results of analyzing the checklist for the Political Obstacles standard and the statistical formulas used in the study
Figure 2: The size of the administrative development gap in the Deanship of the College of Administration and Economics
Prepared by the researchers based on results of the gap size for each standard
Social Obstacles
The results of analyzing the checklist for the Social Obstacles standard indicate that the Deanery has the sub-standards for this measure available at a percentage of 18%, with a weighted average of 1 out of 4, and a gap size of 82. This suggests that there is social interaction among employees within the Deanery, including between supervisors and subordinates. However, some negative social customs and traditions do not affect the administrative development programs, such as the spread of mediation and favoritism. In addition, there is a lack of a sub-criterion addressing differing interests among employees, which leads to organizational conflict and hinders the development process in the Deanery.
Cultural Obstacles
The results of the checklist for the cultural obstacles indicate that the deanery has the sub-standards for this measure available at a rate of 72%, with a weighted average of 3 out of 4, and a gap size of 28. This stems from the variance in the sub-standard indicating a gap and difference between individuals’ values and orientations and the values and culture of the deanery. Table 14 shows the calculation of the summary equations for the standard “Cultural Obstacles.”
Legal Obstacles
The checklist for the Legal Obstacles standard confirmed that the Deanship has sub-standards for this measure at 36%, with a weighted average of 1 out of 4, and a gap size of 64. This is due to the absence of the specialized standard and the weak attention of the legislative authority to administrative development and its importance in improving the performance of the government institution. There is also variation in the standard regarding conflicts between laws and regulations governing work in the Deanship, which causes obstacles to administrative development efforts. The standard indicates a lag in legislation and laws relating to work and a failure to keep pace with modern developments. Table 15 shows the calculation of the summary equations for the Legal Obstacles standard.
Political Obstacles
The checklist for the Political Obstacles standard indicates that the Deanship has the sub-standards for this measure at 18%, with a weighted average of 1 out of 4, and a gap size of 82. This stems from the absence of these standards, i.e., political authorities do not intervene in the Deanship’s affairs or influence its decisions. In addition, there is no standard addressing the weakness of political support for the administrative development process due to a lack of belief in its importance for improving institutional performance. Table 16 shows the calculation of the summary equations for the Political Obstacles standard.
In light of the above, the research hypothesis is rejected, which states that there is a clear and central role in the application of administrative development standards in the educational institution studied, and the alternative hypothesis is accepted: There is no clear or central role in applying the administrative development standards in the educational institution studied.
Conclusions and Recommendations
Theoretical Conclusions
The research yields a new theoretical insight about the concept of administrative development: it is the process of continuous improvement in administration performance by equipping managers and technicians with skills and information, using correct scientific methods to avoid problems and enhance administrative capacities
The research shows that the objectives of administrative development focus on developing employees’ abilities and talents and on promoting the dissemination of cooperative values and ethics
The research presents a theoretical conclusion that the existence of some or all of the obstacles (administrative, behavioral, technical, social, cultural, legal, political) contributes to the deterioration of the educational institution and delays in keeping up with contemporary development and a reluctance to study modern trends in contemporary management sciences
Field conclusions
There is availability of the criterion for influential factors in consolidating the administrative development experience, supported by the existence of enabling systems that strengthen administrative development efforts; however, there is no criterion for schedules and maps of plans, activities, and processes, and these processes are largely practiced through experience alone
The research, through the criterion of the position of administrative development within organizational structures, indicates that the Deanship of the College of Administration and Economics does not have an organizational position for administrative development within the organizational structure; its linkage is exclusively with the university presidency
The research, through the criterion of methods for measuring the effectiveness of administrative development, shows that the Deanship is committed to providing this criterion, but there is disagreement among the responsible managers about using measurement methods to achieve better expectations and perceptions of the customer (beneficiary) and to measure quality via actual performance
REFERENCES
Muslim, Ali Abdul Hadi. Methods of supporting the capacities of administrative development agencies in developing countries. Arab Organization for Development, 2008.
Ahmed, Sami Mahmoud. Administrative reform approaches (administrative development, training, and performance evaluation). Arab-British Academy for Higher Education, 2011. Master’s thesis, London.
Mashhour, Tharwat. Administrative development strategies. 1st ed., Osama Publishing and Distribution House, 2010.
Al-Jarrah, Adhwa Kamal Hussein. "Organizational concordance and its relation to job happiness: Survey of opinions of employees in the Office of the Ministry of Agriculture and Water Resources in Kurdistan Region." North University Journal of Administrative and Human Sciences, vol. 3, no. 4, 2024.
Maher, Ahmed. Developing organizations. 3rd ed., University Publishing and Distribution House, 2017.
Badr, Fatima. Fundamentals of administration. Syrian Virtual University, 2018.
Said, Rachid Rouaa. The effect of organizational commitment on improving banking service quality: Applied study on a sample of Jordanian commercial banks. Master’s thesis, University of Middle East, 2012.
Lee, Ai Noi, and Youyan Nie. "Teacher’s perceptions of school leader empowering behaviors on psychological empowerment: A moderated path analysis." New Waves Educational Research & Development, vol. 19, no. 2, 2016, p. 38.
Nasr, Mustafa, and Azza Jalal. "Improving quality of working life for leaders of general education schools in Egypt: Proposed mechanisms." Journal of Educational Administration, no. 26, 2020.
Ogungbamila, Adepeju, and Janet Tolulope Olasenia. "Gender as a moderator of the relationship between job demand and quality of work life of police personnel in Lagos, Nigeria." Psychological Thought, vol. 12, no. 1, 2019, pp. 63–64.
Ozturk, Özden Tepekoylu, Mumine Soyturk, and Huseyin Cokce. "Investigation of the relationship between communication in the academic environment and quality of work life among academic staff." Asian Journal of Education and Training, vol. 5, no. 1, 2019, p. 281.
Shani, Surya Kumar. "A study on quality of work life among the employees at Metro Engineering Private Limited." International Journal of Management, vol. 4, no. 1, 2013, p. 51.
Al-Bayari, Saeed Samir. Quality of working life and its effect on organizational commitment of employees of the ministries of labor and social development in Gaza. Islamic University of Gaza, Deanship of Scientific Research and Higher Studies, Master’s thesis, 2018.
Boujam’a, Ahmed. The impact of quality of work life on reducing work accidents: Case study of SOFIA Sugar Company – Al-Wadi. College of Economic and Commercial Sciences and Civilizational Studies, Mohamed Khider University – Biskra, 2019.
Recommended Articles
Research Article
The Employee Training and Development Programme at Principal Education Department Quelimane–Zambezia-2010 to 2015
Manuel Bana
Published: 31/10/2021
Download PDF
Research Article
The ‘Evolution’ of Retired and Experienced Employees in Quelimane District Zambezia Province - Mozambique
Manuel Bana,
Chiome Chrispen
Published: 25/07/2021
Download PDF
Research Article
Political Economy Transforming Into Financial Freedom for the Improvement of Business Diplomacy
Md. Enamul Kabir
Published: 25/07/2021
Download PDF
Research Article
The Contribution of Evaluation of Employee Performance in the Provision of Public Services: At Damião Full Primary School - Mocuba District - Zambezia Province - Mozambique (2017 - 2019)
Manuel Bana,
Chrispen Chiome
Published: 20/11/2021
Download PDF
PO Box 101, Nakuru
Kenya.
Email: office@iarconsortium.org
Editorial Office:
J.L Bhavan, Near Radison Blu Hotel,
Jalukbari, Guwahati-India
Hazem Seltun, W. & Shibil Jasim Aljubory, S. (2025). Integration between Administrative Development and Quality of Life: Toward a Sustainable and Productive Work Environment. An Analytical Study in the College of Administration and Economics, University of Mosul. Scientific Research Journal of Review of Public Administration and Management, 5(1), 1-10.
MLA
Hazem Seltun, Walaa and Salahddin Shibil Jasim Aljubory. "Integration between Administrative Development and Quality of Life: Toward a Sustainable and Productive Work Environment. An Analytical Study in the College of Administration and Economics, University of Mosul." Scientific Research Journal of Review of Public Administration and Management 5.1 (2025): 1-10.
Chicago
Hazem Seltun, Walaa and Salahddin Shibil Jasim Aljubory. "Integration between Administrative Development and Quality of Life: Toward a Sustainable and Productive Work Environment. An Analytical Study in the College of Administration and Economics, University of Mosul." Scientific Research Journal of Review of Public Administration and Management 5, no. 1 (2025): 1-10.
Harvard
Hazem Seltun, W. and Shibil Jasim Aljubory, S. (2025) 'Integration between Administrative Development and Quality of Life: Toward a Sustainable and Productive Work Environment. An Analytical Study in the College of Administration and Economics, University of Mosul' Scientific Research Journal of Review of Public Administration and Management 5(1), pp. 1-10.
Vancouver
Hazem Seltun W, Shibil Jasim Aljubory S. Integration between Administrative Development and Quality of Life: Toward a Sustainable and Productive Work Environment. An Analytical Study in the College of Administration and Economics, University of Mosul. Scientific Research Journal of Review of Public Administration and Management. 2025 Jan;5(1):1-10.


 Download PDF
 Download XML