This research looks at the birth and evolution of Entrepreneurial Ecosystems (EEs) in Portugal, comparing all the internal administrative regions. One the analysis led to a major distinction being drawn between dreamers (companies created by notary acts) and starters (companies actually running and, thus, submitting for the first time their payrolls to the government agency MTSSS). This data is analysed over time, trying to measure the evolution of both dreamers and starters, by comparing different periods. Those periods were defined consistently to the overall latest evolution of portuguese economy, thus separating a) The final years of past century (first available numbers in the statistical series), b) The first decade of this century, c) The years of the troika/IMF intervention and d) The second half of last decade. Results show a huge difference between startups “dreamed” and startups actually “started”: dreamers largely outnumber and outgrow starters by a factor approaching 1.35. Data also shows this difference spiked in the second half of last decade and this spike could be the result of the creation of the most visible EEs (Lisboa, Porto and Braga) who seem to influence the increase in Dreamers but not so much the increase in Starters. Figures also show a disappointing performance by the most visible ecosystems, like Lisboa, Porto and Braga, while other regions (like the Algarve) outperform them consistently in the numbers of starters. With this data, an Entrepreneurial Ecosystem Index (EEI) was built to compare the performance of all nut 3 regional ecosystems. The results show how heterogeneous are the Portuguese EEs.
Keywords
Entrepreneurship
Ecosystems
Regional Development
Innovation
Entrepreneurial Ecosystems
INTRODUCTION
Entrepreneurial Ecosystems
Entrepreneurship’s importance has been frequently highlighted in the literature and five reasons have been mostly pointed out: it contributes to the creation of jobs, it contributes to innovation, it thus increases the creation of wealth and it contributes to the development of the economy and of the society in general, and, finally, it constitutes an increasingly important career option for a good part of the workforce [1].
The concept of Entrepreneurial Ecosystem (EE) is relatively new in the entrepreneurship literature [2]. It is one approach used to try to explain the differences in entrepreneurial activity among regions [3]. It has attracted so much interest that a recent bibliometric analysis [4], shows a large increase in publications in the period 2004-2016.
The concept has attracted a lot of attention but clearly needs to be further developed and refined [5]. It was defined as “an interconnected group of actors in a local geographic community committed to sustainable development through the support and facilitation of new sustainable ventures” [6] and it also serves the purpose of compensating for the traditional focus of entrepreneurship literature on the individual entrepreneurs’ or startups’ actions, motivations and limitations [5]. It is seen not as a formal institution or organization “but rather an informal plexus of relations… based on regional proximity” [7].
In fact, one of the advantages of the EE concept comes from assuming that opportunities may not be exogenous and may be the result of the interactions between EE actors [5]. “Performance of EE is perceived to depend on interactions between three components: individuals, organizations and institutions” [5].
The influence of EE in the process of creation and in the success of startups has nevertheless been documented in the literature [8], stressing the concept’s importance for the development of entrepreneurship. One of EEs’ major contributions to the success of startups may be the stock of social capital it puts at the entrepreneur’s disposal [5], one of the most important success factors for startups [1].
The literature on EEs may be considered an extension to previous studies on the role of regional determinants in explaining the differences in entrepreneurial activity between different regions [9,10]. It may also be seen as an extension to studies on technology transfer policies, even though focused only in that specific part of an EE [11].
The literature on EEs presents an undefinition about how to measure and evaluate any specific EE [12] and this limits its usefulness. What cannot be measured will hardly be improved by management or by policy actions.
Since the EE is composed of many actors [13-15] and since they play different roles and make the different components of the EE [16-18], it would be in the interest of local authorities willing to improve entrepreneurship to measure their local EEs and its components so that they can put their efforts and resources on the components where the EE scores the lowest or on the components they consider the most important. Some actors focus on stimulating entrepreneurial intentions, while others focus on helping entrepreneurs test their ideas and eventually take them to market in the form of a startup’s products/services, other actors focus on accelerating the startups’ entry and growth, others focus on funding different stages, others still focus on helping startups go international and scale up,… there are many roles to be played in an EE and the only way to know where time and resources should be invested is by measuring. Thus, all the attempts to develop EE measuring instruments [19,20].
In this effort to measure EEs, most studies see it as a network [5], therefore in this work we’ll consider the value of the EE to be, in part, the result of the number of nodes (actors) it contains.
One important actor in all EEs is the successful entrepreneur, someone who has created a startup and then contributes to the motivation of new entrepreneurs [13,21]. In this light, the successful EE “produces” startups and entrepreneurs but also needs successful startups as one of its components.
The motivation for the development of EEs mostly comes from the will to create jobs, increase innovation and have larger numbers of successful startups in a geographical region. In an open economy, like the Portuguese, there is also an intention to increase exports [9,12] and special focus must be put in this variable when analyzing Portuguese EEs.
All these reasons add to the need to study Portuguese EEs. This research is therefore based on a simple research question: do Portuguese EEs provide a positive contribution to the development of entrepreneurship?
In the journey of doing the research, we collected data about two realities: starters and dreamers, both of which will be better explained in the following section but offer a new contribution to the knowledge about EEs.
Measuring EEs
The literature on EEs is only starting to develop metrics that will allow researchers and practitioners to assess the strengths and weaknesses of individual EEs and thus guide it’s management. Without those metrics, it will be hard to manage them and to identify whether and how to intervene, or even monitor over time the effectiveness of such interventions [13,22].
From the start, the efforts to develop such metrics were based on a model where the EE had some elements (framework and systemic conditions) and these elements produced entrepreneurial activity as an output, resulting from the strength of these elements and the interaction between them [23,24]. The discussion has been much about the variables that should be used to measure both the EE elements and the EE output. Some literature [13], points to six main domains or framework conditions of an entrepreneurial ecosystem (culture and norms, infrastructure and amenities, formal institutions, internet access and connectivity, the melting pot index and demand), while other tries to measure EE’s Vibrancy [19], with constructs to assess EE’s Density, Fluidity, Connectivity and Diversity. Others focus on the infrastructure (SFI-Startup Scene Infrastructure), measuring Human Capital, Finance, Macro Conditions and Market conditions [25] and others yet look at the focal variables that have been theoretically identified as important ecosystem elements influencing new firm growth, including venture capital, government influences, labor market, supplier network and access to information [14].
In this paper we’ll use the Entrepreneurial Ecosystem Index [18], with the intent to assess the Portuguese EEs.
Most studies see the EE as a network [5], therefore the value of the EE will in part result from the sheer number of nodes. Considering Metcalfe’s law, a network’s value grows as the square of the number of its users/nodes [26]. These dreamers are actually a product of the EE. The combined action of all actors in the EE led to the formation of these new companies. When they become starters, they continue to be a product of the EE. That combined action probably had some role in this (partial) success. These dreamers went on to be starters. Very soon many of them will become active actors in this EE, helping motivate entrepreneurs to become dreamers with their own success stories. This was the variable developed to measure the construct “leadership” in the EEI (Table 1).
Table 1: Entrepreneurial Ecosystem Index, adapted from (Stam and van de Ven, 2019)
Concept
Construct
Measures
Institutions
Formal institutions
Visibility of public efforts to create and promote a regional EE, average of 3 experts’ evaluations
Entrepreneurship Culture
New firms created (dreamers) per 1000h, average 2004-17, percentage of total
Resources
Physical infrastructure
IDR (regional development index) 2017
Finance
credit, percentage of total, average 12-17
Leadership
5 Year average starters per 1000h, time lag 2 years
Talent
Universities + polytechnic institutes + research institutions, average percentage of total 2017
Knowledge
Percentage of gross domestic product invested in R&D
Demand
purchasing power per capita, regional product, total human population, export intensity
Intermediate services
Percentage of business service firms in the businesses created
MATERIALS AND METHODS
A model was adopted in the empirical work. One that assumes EEs actions (resulting from the work of all its actors) make support services available to entrepreneurs and then persuade them to use those services.
This support focuses on different subjects (coming from different actors) in different phases of entrepreneurs’ route to startup success. This is summarized in Figure 1.
Figure 1: Model of EEs Support Actions Along the Entrepreneurial Route
The hypothesis being tested in this empirical study are two:
H1: The larger EEs in the country (notably Lisboa) will register more starters than the smaller and less visible ones
H2: This difference will increase along the period being analysed
Portugal is a highly asymmetric country [27], with a huge concentration on Lisboa and (in a lesser degree) in Porto, Braga and Coimbra. This asymmetry is also found in entrepreneurial activity, hence h1.
Plus, Lisboa’s EE was the first to gain public visibility, something enhanced by the move to Lisboa of a high-profile annual tech/entrepreneurial event called WEBSUMMIT (not reflected on the data analysed in this paper). Lisboa received recognition from the EU for the creation of its EE, in the form of an award from European Regions Committee.
This “first starter advantage” leads us to expect h2.
Data was gathered on startup creation, from notary acts of new company creation and on starting activity, measured through the first submission of salaries lists to ministério do trabalho, solidariedade e segurança social (ministry of work, social security and solidarity) (MTSSS). The idea is that creating a new company in the notary only represents a dream that has already passed several tests and assembled some partners (maybe only one) to invest in the formal creation of a company. Actually starting up a company is more than that. It requires passing more tests, assembling a lot of other resources and having people working and receiving a salary. That is the variable we built: when a company first pays salaries (even if it is just one salary to one person, maybe the entrepreneur) it is required to submit a payroll list to the proper authorities: MTSSS. That is when we consider it to be a startup. It may yet fail (probably will) but at that point it is already a member of the entrepreneurial ecosystem.
Both series (dreams/startup creation and startups/activity start) were compared at national level and at nut3 regional level. These were also compared using both aspects of entrepreneurial activity.
In these comparisons we will adopt the labor-market approach and divide the figures instead of the ecological approach (dividing by the number of existing companies) to avoid a bias resulting from the concentration of big companies in the capital, following the literature [28].
Data for these variables was collected for the years 1986-2017 (starters) and 2004-2017 (dreamers) period chosen due to discontinuities in the records available. The discontinuities area a result of changes in methodology adopted by MTSSS along the years.
To measure the Entrepreneurial ecosystem index, additional data was collected from the national statistics institute and the index was computed by normalizing the variables and then adding them. The index was then used to validate the final hypothesis.
H3: The larger and more visible EEs (Lisboa, Porto, Coimbra, Braga, Aveiro and Algarve) will show a higher EEI
RESULTS AND DISCUSSION
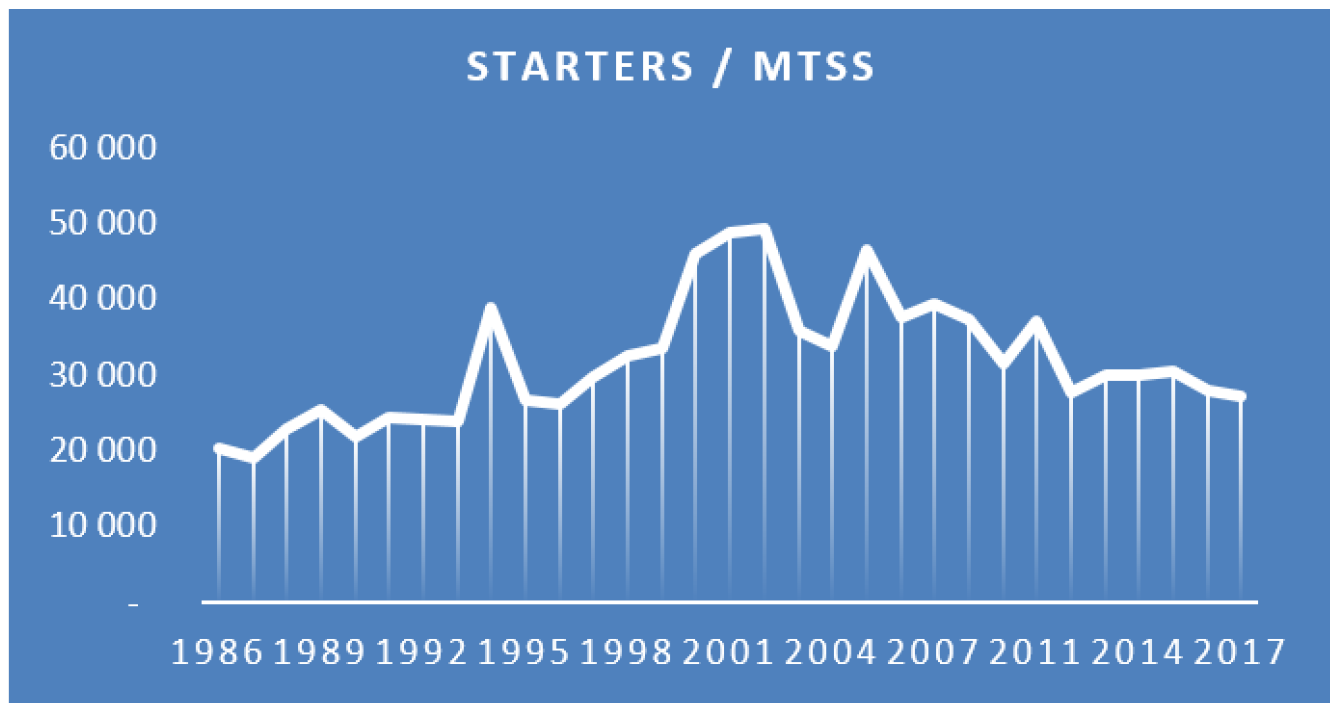
Data on starters (companies submitting their first payroll) shows some variation since the country joined the EU, but there is no clear tendency to rise (Figure 2).
Figure 2: Starters from 1986
Source: GEP/MTSSS, Quadros de Pessoal
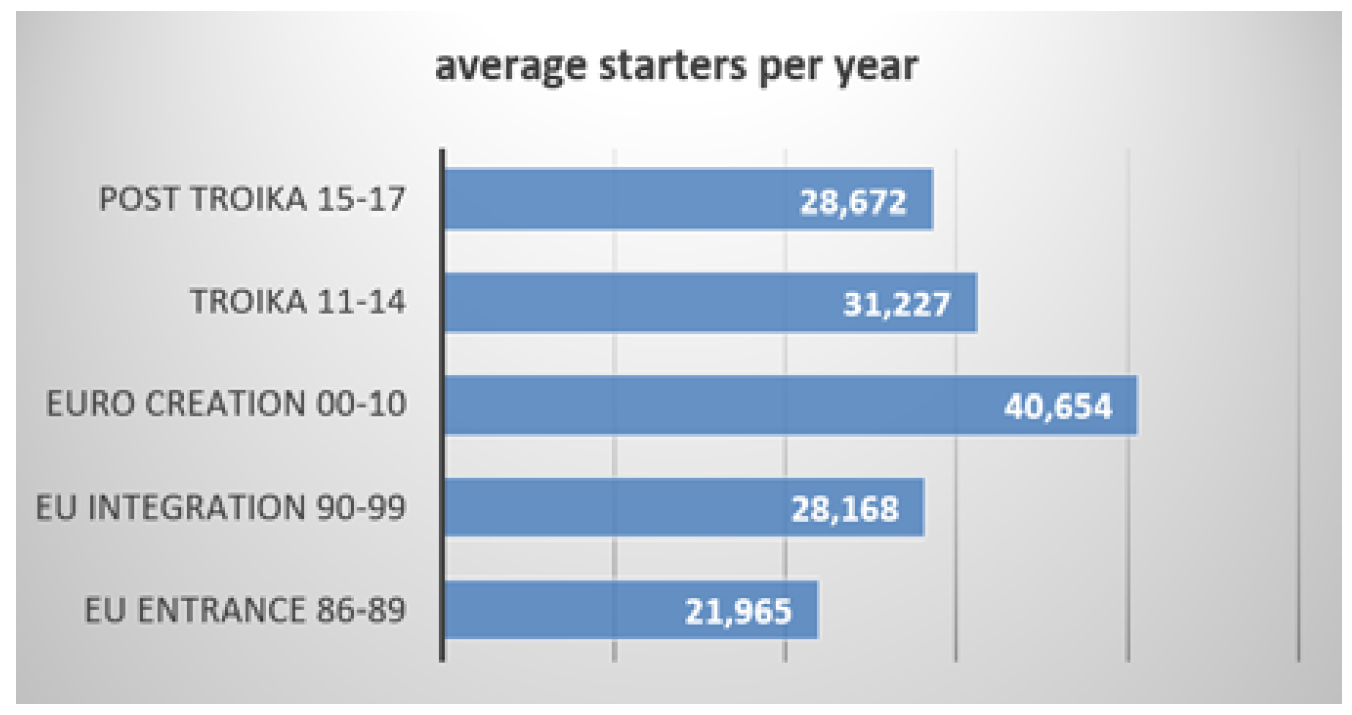
If one considers the cycles the Portuguese economy suffered in the period, one can see a clear rising in the numbers, until the financial crisis and after that a diminishing tendency. This drop in starters is unexpected. It looks like the “hype” around entrepreneurship kept growing all along this period, with more and more dreamers coming out and creating companies but the actual startups were less and less every year (Figure 3).
Figure 3: Starters Per Year
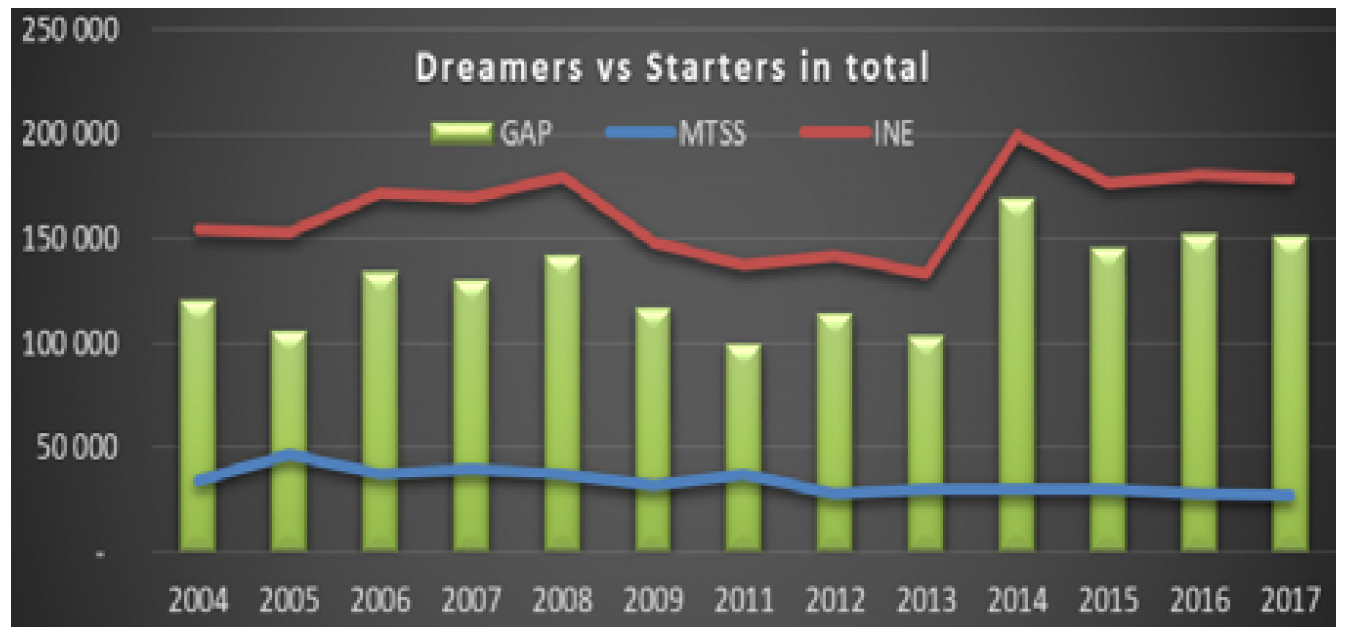
When comparing dreamers and starters, there is a clear and growing gap between the two. There are always more dreamers (companies created) than starters (companies submitting their first payroll) (Figure 4).
Figure 4: Dreamers vs Starters in the Country
Source: dreamers - Instituto Nacional de Estatísticas, Starters - GEP/MTSSS
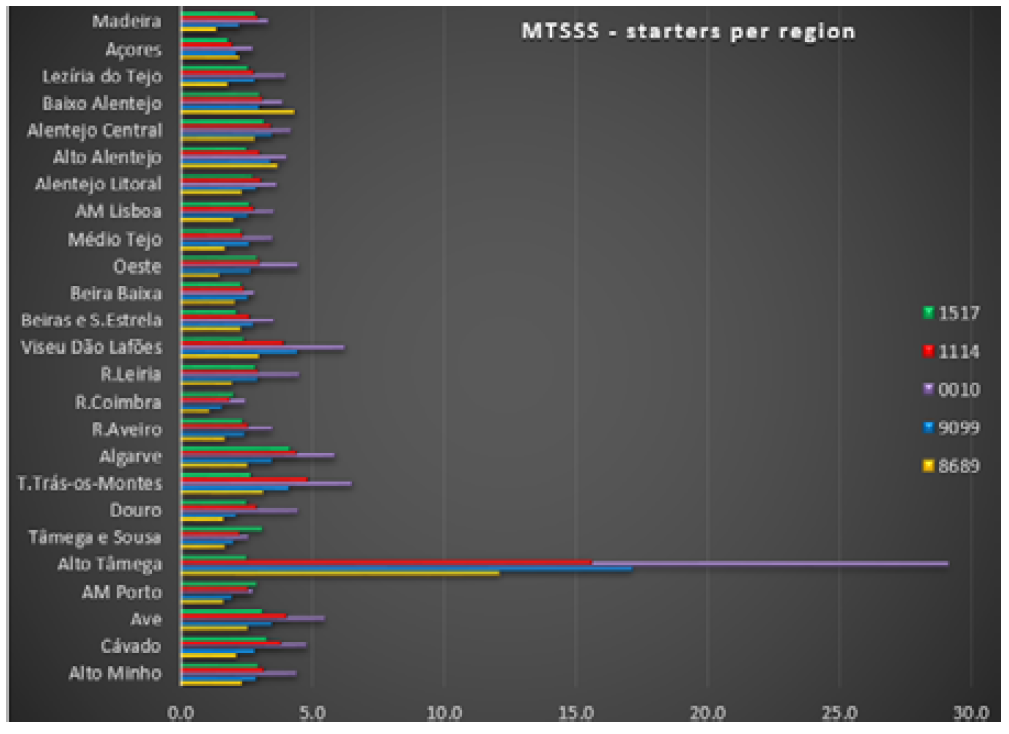
Regional EEs show very different results in starters (following the labour market approach, figures divided by the local population) (Figure 5).
Figure 5: Starters Per Nut3 Ecosystem
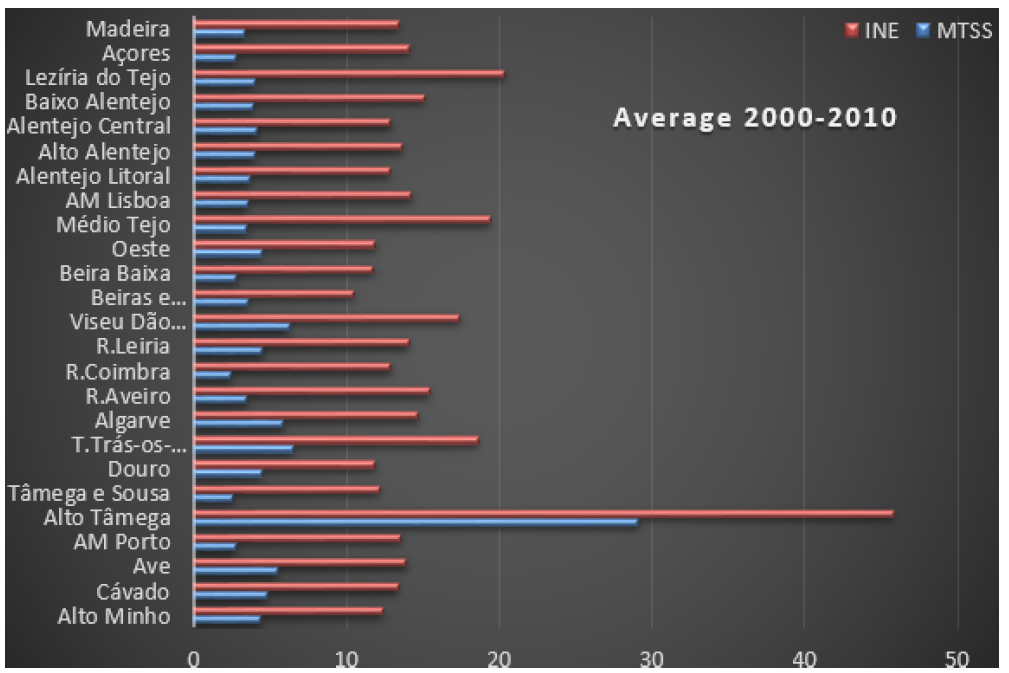
But comparing dreamers and starters in the post euro period, one EE shows higher numbers than all others: Alto Tâmega (Figure 6).
Figure 6: Starters vs Dreamers Per nut3 Ecosystem in Period 1–Euro Creation
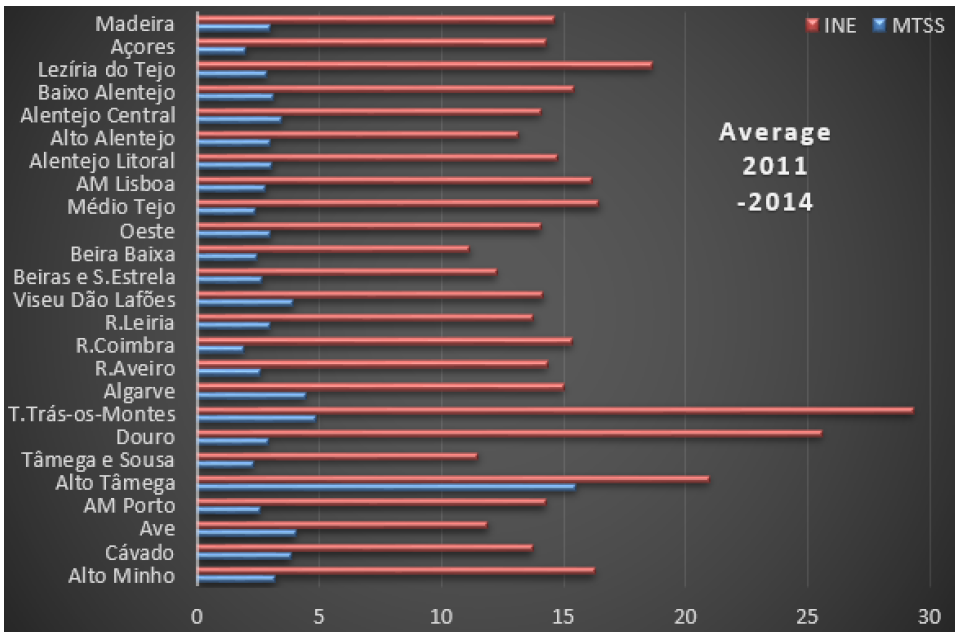
In the following period, during the troika intervention, Alto Tâmega remains the leader in starters but many other EEs show higher dreamers counts.
Data shows a national level decrease in startups submitting their first payroll in the period under analysis, whilst the number of new companies created in notaries increases steadily. More dreamers, less starters. This period corresponds to the post “troika crisis”, when the country was recovering from the major recession it suffered in the early part of the decade, when it was bailed out by the IMF, the EU and European Central Bank. This “troika” forced major “austerity” measures as precondition to the bailout. In this 4-year period immediately after the bailout program was completed, the economy recovered at good pace, with a major drop in unemployment and a GDP growth above EU average (Figure 7).
Figure 7: Starters vs Dreamers Per nut3 Ecosystem in Period 2–Troika Era
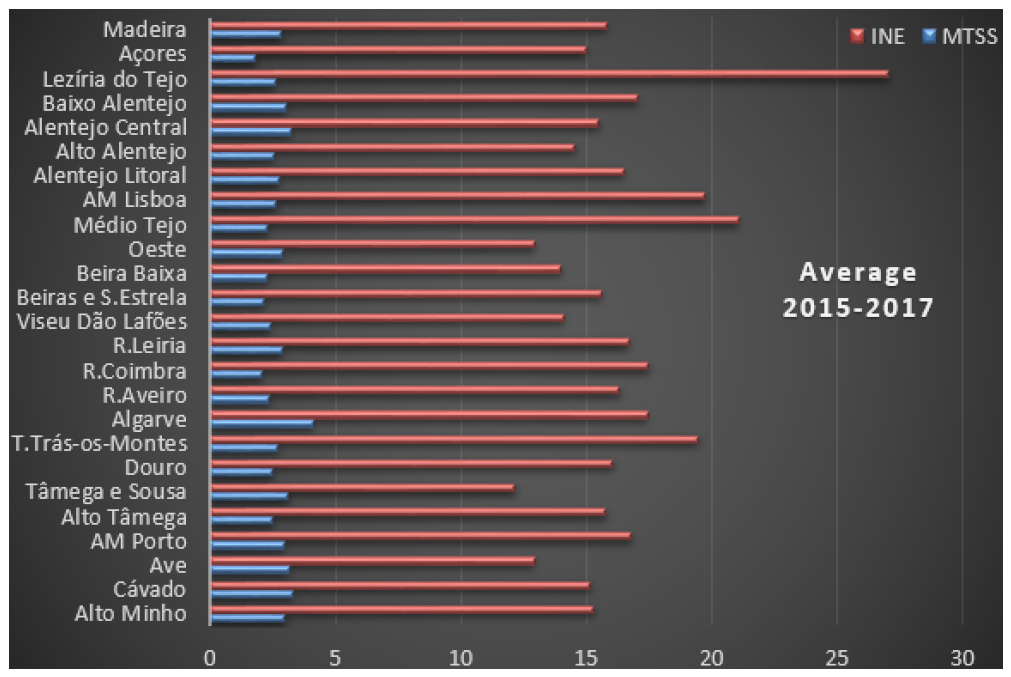
Finally, in the post troika period, Algarve takes the lead in starters, while Lezíria do Tejo, Médio Tejo and Lisboa (3 adjacent EEs) produced much more dreamers (Figure 8).
Figure 8: Starters vs Dreamers Per Nut3 Ecosystem In Period 3–Post Troika
Neither h1 nor h2 were confirmed by the collected data, since the larger EEs (Lisboa, Porto, Braga, Coimbra, Aveiro or Algarve) do not lead dreamer nor starter creation.
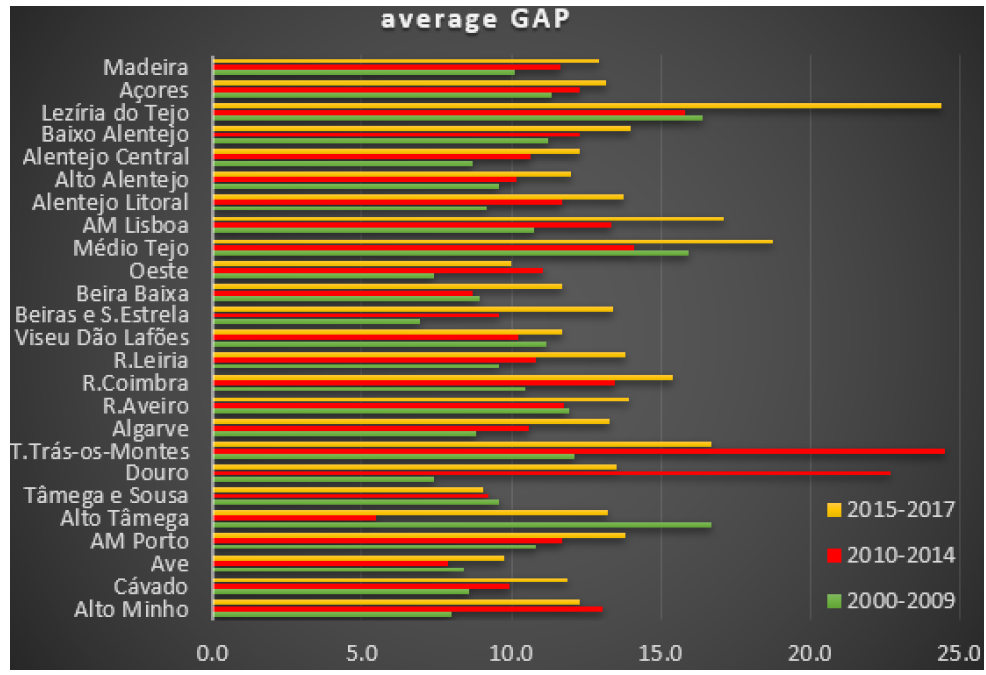
Looking at the gap between the two measures, one can see that in the first period (green) Alto Tâmega has the higher gap, in the second period (red) Trás os Montes and Douro (adjacent EEs) are way above all others and in the final period (yellow) Leziria do Tejo leads by large (Figure 9).
Figure 9: Dreamer-Starter Gap Per nut3 Ecosystem in Each Period
This gap is an indication that many wannabe startups are created on paper but, never really start, or they start much after they were created. Many dreamers never become starters or they do it much, much later.
It can happen that companies will be created in notary in one place (i.e Lisboa) and then when they start actually working they relocate to their intended location, where they submit their payrolls.
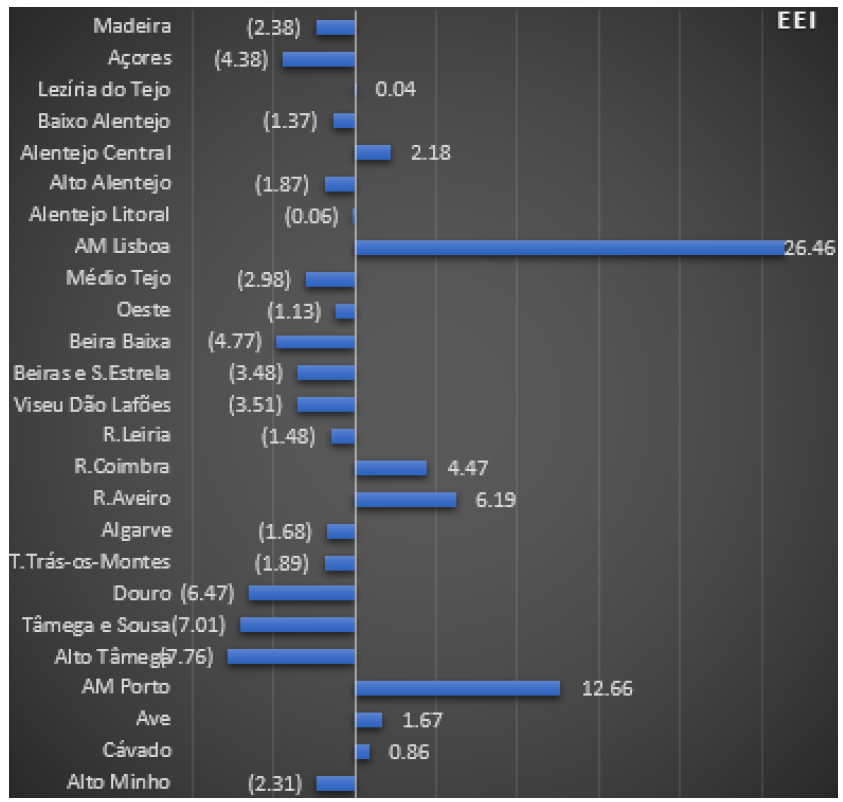
Using all the data on dreamers and starters collected in the first phase with data on all other variables, collected from I.N.E., the EEI was then calculated, with the results presented in Figure 10.
This EEI measurement confirms h3, showing higher numbers for the EEs that have higher visibility nationally and internationally (Figure 10).
Figure 10 - Entrepreneurial Ecosystem Index
CONCLUSION
Only one of our initial hypotheses was confirmed and that was the one about the results of the index measured in this paper. Along this period major changes occurred in the Portuguese economy. The main period analysed (2000-2017) saw the Portuguese economy join a monetary zone (euro), face near bankruptcy in the financial crisis and then enjoy an important recovery.
The entrepreneurship “cause” was being highly promoted by public authorities, particularly in the country’s capital where a very dynamic (or at least a highly visible) ecosystem emerged from the efforts of public authorities, private investors, universities, researchers, incubators, accelerators, hundreds of committed actors.
Similar efforts were put to build highly visible ecosystems in Lisboa, Porto, Braga, Coimbra, Aveiro and Algarve. The results shown above, however, tell a story of high dreams and low realization of those dreams.
The number of dreamers (startups being created) stood out in Lisboa and, to a lesser degree, in Porto. Neither however show above average levels of starters (startups submitting their first payroll). This completely unconfirms h1.
It looks like most dreams are not resulting in working startups. When a startup is working (and paying salaries) that doesn’t mean it is going to succeed. Actually, it is most likely to fail. In Portugal, however, most startups don’t even reach that point, they fail before submitting first payroll.
There is a clear increase in dreamers (startups created), but that is not resulting in an increase in starters. Let alone an increase in successful startups. There is even a clear decrease in startup creation after the financial crisis of the last decade.
Another important issue with these results is the huge difference between companies created (something that signals the entrepreneur is so committed to create a startup she spends the time and the money to create a company) and companies submitting their first payroll to MTSSS (something that signals the startup is actually working and paying at least one salary). There are no comparative figures from other countries, but these figures seem to show that a huge percentage of projects never actually start. It is known that most of the ones who actually start will fail in the market, but apparently many more actually fail before that.
However, this may actually be a good thing, if it means bad projects are cut before entering the market and failing. We would need further research on this.
To promote and to support entrepreneurship of the century XXI is to help entrepreneurs follow the road from idea generation to market success. The role of entrepreneurial ecosystems in this process can be extremely important and need to be further researched and one of the paths to improve their performance is to measure their performance and then act on the results. The EEI this paper adapted to measure Portuguese EEs’ performance may be a good instrument to help improve that performance.
Acknowledgment
Data on payroll submission was gathered from the databases of Gabinete de Estratégia e Planeamento (GEP) do Ministério do Trabalho, Solidariedade e Segurança Social (MTSSS) (Fonte: GEP/MTSSS, Quadros de Pessoal). GEP is not at all responsible for the results and interpretations here presented. Its staff is however totally responsible for having been extremely capable, professional and helpful to these researchers.
REFERENCES
Gaspar F.C. “The stimulation of entrepreneurship through venture capital and business incubation.” International Journal of Entrepreneurship and Innovation Management, vol. 9, no. 4, 2009, https://doi.org/10.1504/IJEIM.2009.024587.
Blasi S. et al. “The diffusion of a policy innovation in the energy sector: Evidence from the collective switching case in Europe.” Industry and Innovation, 2019, pp. 1–25, https://doi.org/10.1080/13662716.2019.1616535.
Colombelli A. et al. “Hierarchical and relational governance and the life cycle of entrepreneurial ecosystems.” Small Business Economics, vol. 52, no. 2, 2019, pp. 505–521, https://doi.org/10.1007/s11187-017-9957-4.
Seguí-Mas E. et al. “Does the environment matter? Mapping Academic knowledge on entrepreneurial ecosystems in GEM.” Entrepreneurship Research Journal, vol. 9, no. 2, 2018, pp. 1–19, https://doi.org/10.1515/erj-2017-0170.
Alvedalen J. and Boschma R. “A critical review of entrepreneurial ecosystems research: Towards a future research Agenda.” European Planning Studies, vol. 25, no. 6, 2017, pp. 887–903, https://doi.org/10.1080/09654313.2017.1299694.
Cohen B. “Sustainable Valley Entrepreneurial Ecosystem.” 2006, pp. 1–14.
Cunningham J.A. et al. “Entrepreneurial ecosystem governance: A principal investigator-centered governance framework.” Small Business Economics, vol. 52, no. 2, 2019, pp. 545–562, https://doi.org/10.1007/s11187-017-9959-2.
Auschra C. et al. “Patterns of project-based organizing in new venture creation: Projectification of an entrepreneurial ecosystem.” International Journal of Managing Projects in Business, vol. 12, no. 1, 2019, pp. 48–70, https://doi.org/10.1108/IJMPB-01-2018-0007.
Gaspar F.C. and Pinho L.F. “Environmental determinants of firm creation across portuguese regions.” ISBE 2007 – Institute for Small Business & Entrepreneurship 30th Edition, 2007.
Bosma N. and Schutjens V. “Understanding regional variation in entrepreneurial activity and entrepreneurial attitude in Europe.” Annals of Regional Science, vol. 47, no. 3, 2011, pp. 711–742, https://doi.org/10.1007/s00168-010-0375-7.
Cunningham J.A. et al. “The impact of university-focused technology transfer policies on regional innovation and entrepreneurship.” Journal of Technology Transfer, vol. 44, no. 5, 2019, pp. 1451–1475, https://doi.org/10.1007/s10961-019-09733-0.
Boutillier S. et al.Entrepreneurial Ecosystems. vol. 2, 2016, pp. 1–129, https://doi.org/10.1002/9781119285175.
Audretsch D.B. and Belitski M. “Entrepreneurial ecosystems in cities: Establishing the framework conditions.” Journal of Technology Transfer, vol. 42, no. 5, 2017, pp. 1030–1051, https://doi.org/10.1007/s10961-016-9473-8.
Sarma S. and Marszalek J.M. “New venture growth: Role of ecosystem elements and prior experience.” Entrepreneurship Research Journal, 2019, pp. 1–26, https://doi.org/10.1515/erj-2018-0215.
Walsh K. “Prior employment as a causal mechanism within entrepreneurial ecosystems.” Regional Studies, Regional Science, vol. 6, no. 1, 2019, pp. 637–645, https://doi.org/10.1080/21681376.2019.1691047.
Auschra C. et al. “Entrepreneurial ecosystems as fields: Integrating meso-level institutional theory.” Zeitschrift für Wirtschaftsgeographie, vol. 63, nos. 2–4, 2019, pp. 64–78, https://doi.org/10.1515/zfw-2018-0016.
Pugh R. et al. “Developing local entrepreneurial ecosystems through integrated learning initiatives: The lancaster case.” Small Business Economics, 2019, https://doi.org/10.1007/s11187-019-00271-5.
Bell-Masterson J. and Stangler D. “Measuring an entrepreneurial ecosystem.” SSRN, March 2015, https://doi.org/10.2139/ssrn.2580336.
Stam E. “Measuring entrepreneurial ecosystems.” Entrepreneurial Ecosystems, edited by O’Connor et al., Springer International Publishing, 2018, https://doi.org/10.1007/978-3-319-63531-6_9.
Spigel B. and Harrison R. “Toward a process theory of entrepreneurial ecosystems.” Strategic Entrepreneurship Journal, vol. 12, no. 1, 2018, pp. 151–168, https://doi.org/10.1002/sej.1268.
Mason C. and Brown R. “Entrepreneurial Ecosystems and Growth Oriented Entrepreneurship.” Entrepreneurial Ecosystems and Growth Oriented Entrepreneurship, OECD LEED Programme, 2014, pp. 1–38, https://doi.org/10.4337/9781785364624.
Isenberg D.J. “The Entrepreneurship ecosystem strategy as a new paradigm for economic policy: Principles for cultivating entrepreneurships.” The Babson Entrepreneurship Ecosystem Project, vol. 1, no. 781, 2011, pp. 1–13.
Stam E. “Entrepreneurial ecosystems and regional policy: A sympathetic critique.” European Planning Studies, vol. 23, no. 9, 2015, pp. 1759–1769, https://doi.org/10.1080/09654313.2015.1061484.
Iacob N. et al. “Operationalising relational theory of entrepreneurial ecosystems at city-level in Africa, Asia and the middle east.” Zeitschrift für Wirtschaftsgeographie, 2019, https://doi.org/10.1515/zfw-2018-0017.
Metcalfe B. “Metcalfe’s law after 40 Years of ethernet.” Computer, vol. 46, no. 12, 2013, pp. 26–31, https://doi.org/10.1109/MC.2013.374.
Gaspar F.C. “The importance of entrepreneurship and the situation in portugal.” IASK Proceedings, 2007, pp. 239–246.
Nekolová J. et al. “The changing determinants of new business formation in the czech republic.” Montenegrin Journal of Economics, vol. 12, no. 2, 2018, pp. 89–100, https://doi.org/10.14254/1800-5845/2016.12-2.6.
Recommended Articles
Research Article
The Employee Training and Development Programme at Principal Education Department Quelimane–Zambezia-2010 to 2015
Manuel Bana
Published: 31/10/2021
Download PDF
Research Article
The ‘Evolution’ of Retired and Experienced Employees in Quelimane District Zambezia Province - Mozambique
Manuel Bana,
Chiome Chrispen
Published: 25/07/2021
Download PDF
Research Article
Political Economy Transforming Into Financial Freedom for the Improvement of Business Diplomacy
Md. Enamul Kabir
Published: 25/07/2021
Download PDF
Research Article
The Contribution of Evaluation of Employee Performance in the Provision of Public Services: At Damião Full Primary School - Mocuba District - Zambezia Province - Mozambique (2017 - 2019)
Manuel Bana,
Chrispen Chiome
Published: 20/11/2021
Download PDF
PO Box 101, Nakuru
Kenya.
Email: office@iarconsortium.org
Editorial Office:
J.L Bhavan, Near Radison Blu Hotel,
Jalukbari, Guwahati-India
Gaspar, F. C. (2021). Dreamers and Starters: How did Ecosystems Evolve in Xxist Century Portugal?. Scientific Research Journal of Review of Public Administration and Management, 1(1), 1-6.
MLA
Gaspar, Fernando C.. "Dreamers and Starters: How did Ecosystems Evolve in Xxist Century Portugal?." Scientific Research Journal of Review of Public Administration and Management 1.1 (2021): 1-6.
Chicago
Gaspar, Fernando C.. "Dreamers and Starters: How did Ecosystems Evolve in Xxist Century Portugal?." Scientific Research Journal of Review of Public Administration and Management 1, no. 1 (2021): 1-6.
Harvard
Gaspar, F. C. (2021) 'Dreamers and Starters: How did Ecosystems Evolve in Xxist Century Portugal?' Scientific Research Journal of Review of Public Administration and Management 1(1), pp. 1-6.
Vancouver
Gaspar FC. Dreamers and Starters: How did Ecosystems Evolve in Xxist Century Portugal?. Scientific Research Journal of Review of Public Administration and Management. 2021 Jul;1(1):1-6.



 Download PDF
 Download XML