Earthquakes and cyclones are two of the most destructive natural events, with the greatest consequences for both vector organism populations and human health. The objective of the research was to demonstrate how hurricanes and earthquakes can be predicted by mathematical modeling. The study was carried out based on the forecast of the atmospheric pressure variable, with a series of data, from 1977 to 2016 (tropical cyclones), while, in the case of earthquakes, we relied on the data series of Haiti (magnitude 6 or more), and which have occurred in this country (2000 to 2011), and thus achieve a forecast until the year 2096. The methodology used in the research was the Regressive Objective Regression (ROR). It was shown that the forecast coincided with what occurred during the passage of Hurricane Irma, except for a difference of three days and six hours. Good models were obtained for both longitude and latitude, as well as for month, day, hour, magnitude and depth for earthquakes of magnitude 6 or more. In Haiti it should be similar to the way it is presented in the rest of the world. It was possible to predict the occurrence of earthquakes in that country up to the year 2096. It is concluded that the prediction one and 11 years in advance of the trihourly atmospheric pressure is an important tool to foresee the impact of hurricanes in Cuba, as well as its direct relation with the diffusion and presentation of infectious entities of viral and parasitic etiology. In relation to earthquakes, it is possible to use the 11-year solar cycle to predict earthquakes, and the next one should occur in Haiti in the year 2031, month July, day 14, hour 9.20, minute 25.1, Latitude 36.60, Longitude 133.00, Depth 71.14, Magnitude 6.7 on the Richter scale.
Keywords
Solar Cycle
Infectious Entities
Haiti
Hurricane Irma
Trihourly Atmospheric Pressure
Forecast
Objective Regressive Regression
Earthquakes
Villa Clara
INTRODUCTION
With each passing day, natural disasters intensify and threaten the safety of people [1-5]. According to the Center for Research on the Epidemiology of Disasters [6], 102 countries had suffered some form of natural disasters by the end of 2016, leaving numerous losses of human lives and heavy economic losses [7-9].
Hydrometeorological events are intensifying, with cyclones being the most destructive phenomenon in the tropics, for all that they bring in their wake: strong winds, sea penetrations, landslides and intense rainfall [3,10-13]. The 2017 hurricane season marked several absolute values, with hurricanes Harvey, Irma, Jose and Katia standing out. Irma reached category 5, even before reaching the Caribbean Sea: also, the one with the longest duration with this intensity [14]. It was, in turn, the most devastating meteor in terms of material damage in the region [6]. It is worth noting that three hurricanes formed in the Atlantic Basin, which does not happen easily. Studies carried out in relation to Climate Change foresee a greater intensity in their formation, which is not far from reality according to what happened in the 2017 cyclonic season [6,14].
A large number of earthquakes occur at the level of planet Earth, and the deaths associated with these phenomena are substantial [14-15], as well as the economic and material damage associated with these phenomena, it is for this reason that it is necessary to forecast these events with the necessary anticipation that allows decisions to be made early enough to save lives and resources [14-16]. There are phenomena in nature that are influenced by the 11-year solar cycle, among them we have, atmospheric pressure, mosquito density, the number of children with acute lymphoid leukemia [17-20], as well as an endless number of climate variables and earthquakes are not alien phenomena to the climate system that is interconnected and interrelated to each other phenomena, if we stick to the philosophy that everything has to do with everything according to geographers, the information to be explained in a model depends on a certain number of variables and as these increase, then the way to explain it truthfully increases.
Forecasting both hurricanes and earthquakes is an arduous task for scientists and of utmost importance to preserve human life [12,21-26]. Some authors have modeled and predicted global earthquakes using the ROR methodology, which consists of several steps [14-15,19,27], and allows not only to mathematically model mosquito larval densities, as well as the population dynamics of mollusks, but goes beyond (possibility of modeling infectious entities of different etiologies, such as HIV/AIDS, Cholera, Influenzas, Acute Respiratory Infections (ARI), Acute Bronchial Asthma Crises (CAAB), Fasciolosis, Angiostrongylosis and even, in the estimation of the length and area of the universe, monthly forecasting of precipitation and extreme temperatures, forecasting of meteorological disturbances/hurricanes, prediction of the latitude and longitude of earthquakes, search for information on white noise, modeling of the equivalent effective temperature (TEE) and atmospheric pressure (PA) up to the electricity consumption of a municipality, province or nation itself [14-15,17-19,28-34].
The objective of the work was to demonstrate how both hurricanes and earthquakes can be predicted by mathematical modeling.
MATERIALS AND METHODS
Description Of The Study Area
The first part of the research was carried out in the municipality of Caibarién, which belongs to the province of Villa Clara, located in the central region of the island of Cuba, (Latitude: 22º 29'40'' N, Longitude: 79º28'30'' W), together with 12 other municipalities that make up the province, from the political and administrative point of view. The municipality of Caibarién is located on the north coast of the province, it has geographical limits with the municipalities of Remedios and Camajuaní.
To carry out the second part of the study, we used a database that was sent in 2013, on July 10 by a student from the University of Paraná, named Wisland. This database is held by the Provincial Meteorological Center (CMP) of Villa Clara, Cuba, and covers from 2000 to 2011. These data could not be updated until 2021, because we did not have access to internet due to COVID-19, but due to the earthquake that occurred in this country on August 14, we decided to run the mathematical models for forecasting these phenomena and to have a guide for the future management of these events in Haiti.
We took into account the 11 year cycle, which influences many natural phenomena, such as population densities of mosquitoes, children with acute lymphoid leukemia, as well as hurricanes, among others: Hence, we first modeled the year in which earthquakes of magnitude 6 or more should occur using a short-term parameter, then we added 11 steps backwards, 11 of the solar cycle that influences the forecast of total earthquakes at a global level, until the year 2096, we forecast the latitude, longitude as well as the month, day, hour, magnitude and depth for earthquakes of magnitude 6 or more with the ROR methodology.
Objective Regressive Regression (ORR) Methodology
In the methodology of the Regressive Objective Regression ROR, dichotomous variables DS (Sawtooth), DI (Inverted Sawtooth) and NoC (Trend) are created in a first step, where:
NoC: Number of base cases
DS = 1, if NoC is odd: DI = 0, if NoC is even, when DI = 1, DS = 0 and vice versa
Subsequently, the module corresponding to the Regression analysis of the statistical package SPSS, version 19.0 (IBM) was executed, specifically the ENTER method, where the predicted variable and the ERROR are obtained.
Then the autocorrelations of the variable ERROR were obtained, paying attention to the maximums of the significant partial autocorrelations PACF. The new variables were then calculated taking into account the significant lag (Lag) of the PACF. Finally, these regressed variables were included in the new regression in a process of successive approximations until obtaining white noise [35] in the regression errors. For the case of atmospheric pressure, lags of 1 year in advance were used, although with 11 years’ good results are obtained [14-15,19,27].
RESULTS AND DISCUSSION
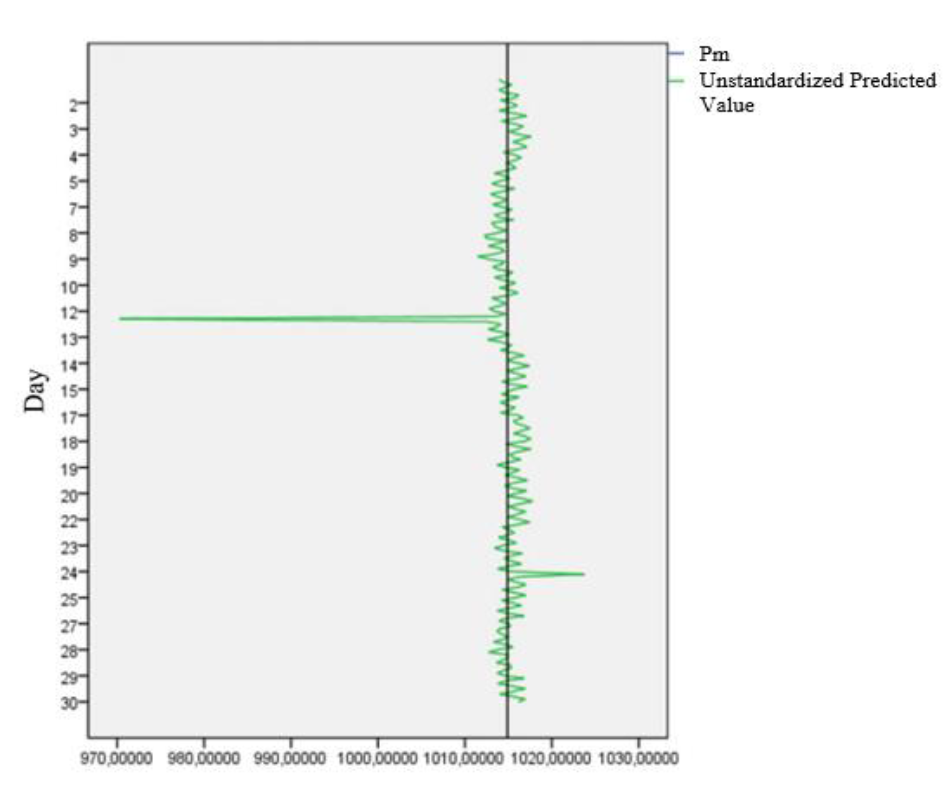
It was possible to forecast the atmospheric pressure variable one year in advance, as can be seen in Figure 1: an extreme weather event was to occur between days 12 and 13, due to the large pressure drop that was expected according to the ROR modeling [19,29-30].
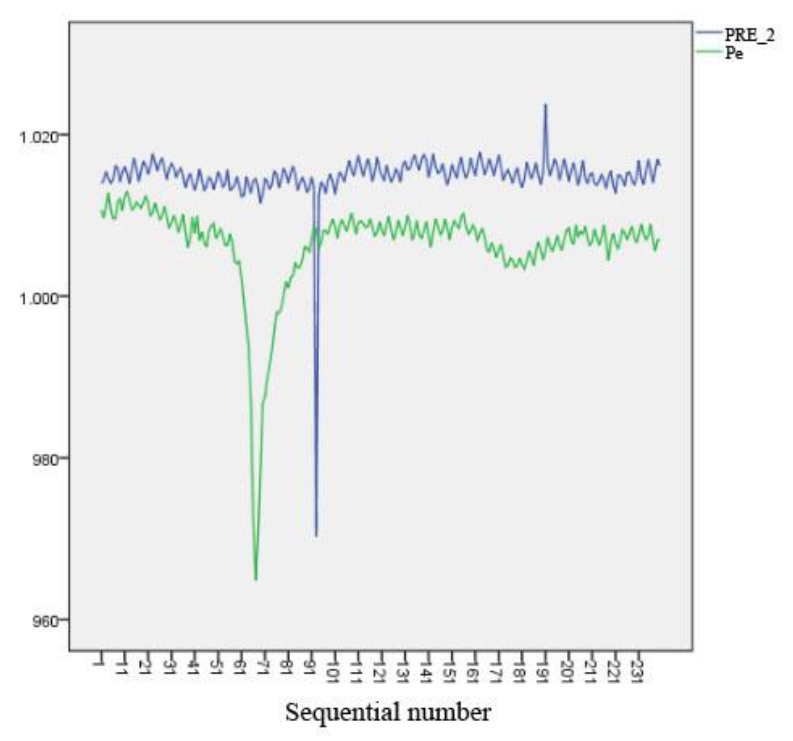
What actually happened can be seen in Figure 2, where the pressure drops from Hurricane Irma occurred approximately three days earlier than predicted, but the coincidence of the data was astounding.
Figure 1: Three-Hourly Atmospheric Pressure at Station Level in Caibarién
Figure 2: Pressure during Hurricane Irma in September 2017
Caibarién Station. PRE_2: Tri-Hourly Pressure Predicted One Year in Advance According To ROR. Pe.: Tri-Hourly Pressure Occurred in the Month of September 2017. Caibarién Station. X Axis: Number of Observations. Y Axis: Atmospheric Pressure in Hectopascals (Hpa)
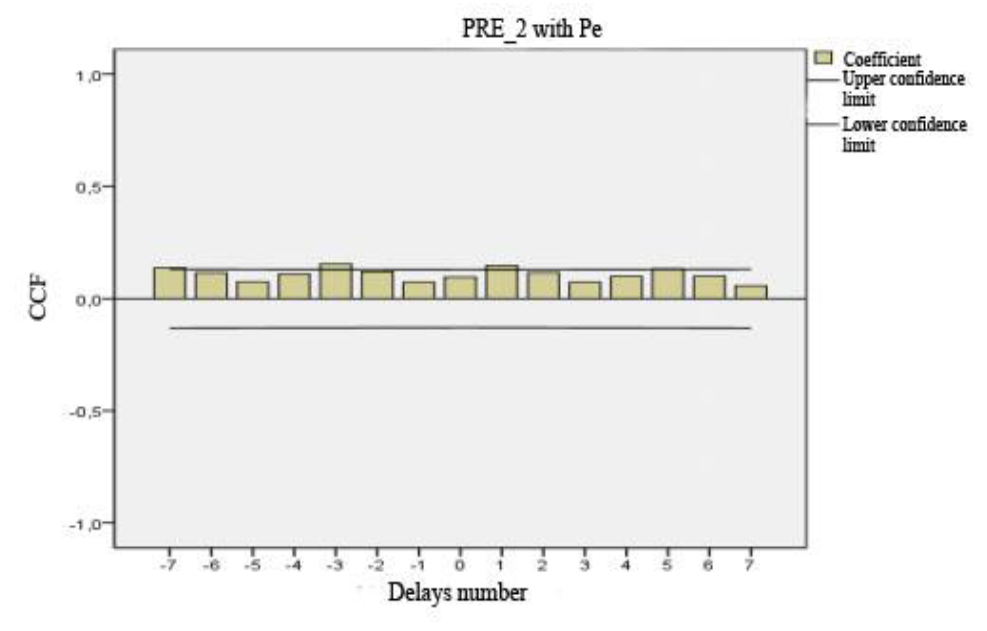
Figure 3: Crosscorrelation (CCF) Between PRE_2 and Pe in Caibarién, Cuba. September 2017
When studying the crosscorrelation in the small, it could be seen that in lag 3 it showed a high significant coefficient, indicating the close relationship between the forecast and the actual value Figure 3.
The strong and increasingly frequent and unusual summers and winters, floods, droughts, meteorological disturbances (gales, tropical storms, cyclones, hurricanes, among others), reinforced by the sporadic intervention of "El Niño and La Niña" and more worryingly, the inconsequential participation of man, as well as the increasing increase of air and maritime transport, are worryingly perpetuating these and other epidemiological episodes [9,36-39]. Therefore, it is undeniable that meteorological variables have a much more marked influence on vector organism populations, and transmissible entities [28,30,40].
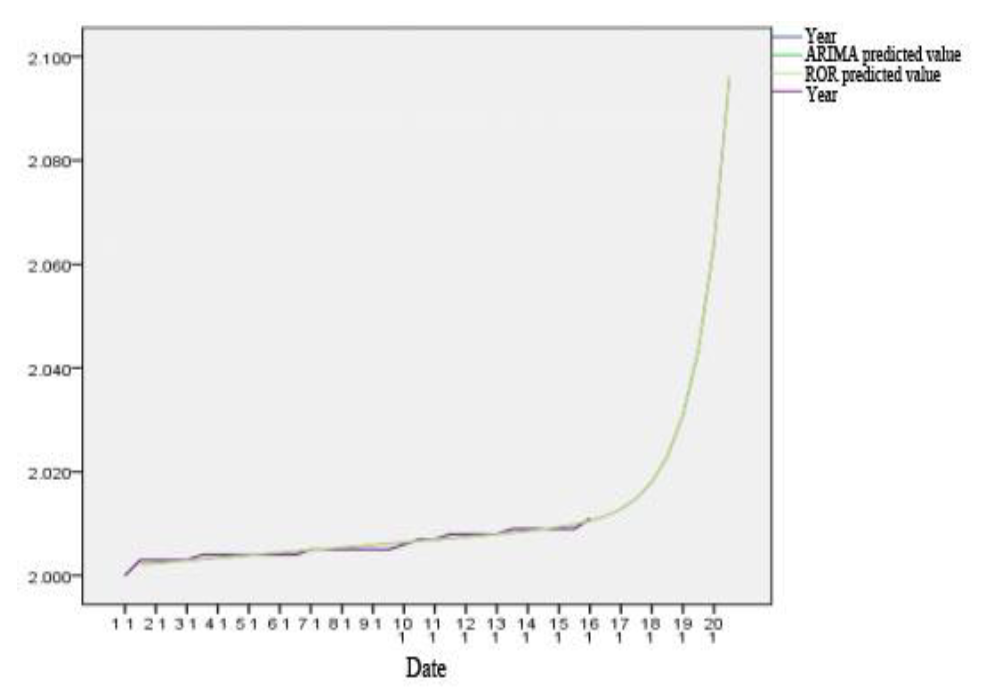
Figure 4: Actual and Unstandardized Predicted Value according to ROR
The above analyzed has a direct impact on the species of vector organisms transmitting infectious entities [17,29-30], to which is added climate change, with its more than 20 natural phenomena, directly responsible for the increasing spread and presentation in different tropical and subtropical regions of infectious entities of viral and parasitic etiology [41-43], as well as the spread, irradiation and propagation of different vector genera and species, mainly Anopheles, Culex, Aedes aegypti and Ae. Albopictus Skuse 1895, which is consistent with results predicted by other authors [17,32,43-44].
If we take into account all of the above, plus the results obtained in articles published in relation to the subject under analysis [32,45-46], since it is to be expected, in the very near future, transient/temporary ecological shifts/shifts for culicid species from coastal ecosystems to urban ecosystems/settlements, even more than 50 km away from the coasts, with the consequent epidemiological consequences that this phenomenon could bring with it, both for human health and for the rest of the animals: i.e. focal explosions of zoonotic entities in areas/sites that do not coincide with the ecology and biology of vector species and intermediate hosts.
Mathematical Modeling for Earthquakes in Haiti
The model for the year in which earthquakes of magnitude 6 or more should occur, 100% variance is explained with an error of 0.56 Table 1.
Figure 4 shows the forecast for the year and shows its increase according to the global trend of earthquakes, which is increasing [15,27].
As we do not have the latitude and longitude data for the earthquake of August 14 in Haiti, since we do not have Internet access due to COVID-19, we will focus on the next earthquake, which should occur in the year 2031, according to the forecast for all parameters Tables 2 and 3, these values are in red.
Table 1: Summarized Model According to the Year in Which Earthquakes of Magnitude 6 or More Should Occur
Model Summary c,d
Model
R
R squaredb
Adjusted R-squared
Standard error of estimation
1
1.000a
1.000
1.000
0.556
A: Predictores: Unstandardized Predicted Value b: For regression through the origin (the model without intercept), R-squared measures the proportion of the variability in the dependent variable about the origin explained by the regression. This CANNOT be compared to R-squared for models that include intercept. C: Dependent variable: Year d: Linear regression through the origin
Table 2: Summary Of Cases for the Variables: Year, Month, Day, Hour and Minute According to the Forecast for the Next Earthquake in Haiti
Resúmenes De Casosa
Year Predicted Value
Month Predicted Value
Dey Predicted Value
Hour Predicted Value
Minute Predicted Value
1
2002.13197
-
-
-
-
2
2002.39475
-
-
-
-
3
2002.63362
-
-
-
-
4
2002.89641
-
-
-
-
5
2003.13528
-
-
-
-
6
2003.39807
-
-
-
-
7
2003.63695
-
-
-
-
8
2003.89974
-
-
-
-
9
2004.13863
-
-
-
-
10
2004.40144
-
-
-
-
11
2004.64036
-
14.18248
10.04511
-
12
2004.90322
-
14.02268
9.02375
-
13
2005.14221
-
15.81242
12.80756
34.56724
14
2005.40519
-
12.74509
9.02375
25.32466
15
2005.64437
-
16.42079
9.49261
32.56231
16
2005.90766
6.85723
14.53220
11.04956
27.12909
17
2006.14734
7.76973
14.51455
11.15009
36.97315
18
2006.41145
6.96106
12.78312
9.94457
22.11678
19
2006.65245
7.25058
14.73002
13.54422
36.87291
20
2006.91869
6.85723
14.33448
8.83959
22.01653
21
2007.16315
7.76973
16.59571
12.62340
34.66749
22
2007.43498
6.96106
13.13548
9.94457
22.11678
23
2007.68849
7.35441
16.10394
9.49261
34.36675
24
2007.97494
6.96106
14.60825
8.65543
26.22688
25
2008.25213
7.25058
15.92650
9.67678
32.26158
26
2008.57689
6.75340
14.43081
9.39208
24.32219
27
2008.91606
7.04291
15.90622
13.17589
32.96330
28
2009.34112
7.58405
13.23181
9.76041
23.31973
29
2009.84257
7.56207
15.80736
12.99173
33.76527
30
2010.53020
7.06489
15.17608
7.36628
26.42737
31
2011.45650
7.25058
16.33716
9.49261
37.47439
32
2012.83156
6.75340
13.89849
10.31290
23.62047
33
2014.87013
7.04291
16.23830
13.54422
36.27143
34
2018.04489
7.37639
15.29268
10.12874
23.21949
35
2022.99545
7.97739
16.21802
9.30845
33.26404
36
2030.88189
7.16873
14.32943
9.20792
25.12417
37
2043.45610
7.76973
16.27633
12.99173
35.56970
38
2063.67788
7.27256
14.70206
11.41788
22.21702
39
2096.21109
7.56207
16.96329
9.30845
36.87291
Total
N
39
24
29
29
27
A. Limited to the First 100 Cases
Table 3: Summary Of Cases for the Variables: Year, Latitude, Longitude, Depth and Magnitude According to the Forecast for The Next Earthquake in Haiti
Case Summariesa
Year Predicted Value
LatitudePredicted Value
Length Predicted Value
Depth Predicted Value
Magnitude Predicted Value
1
2002.13197
-
-
-
-
2
2002.39475
-
-
-
-
3
2002.63362
-
-
-
-
4
2002.89641
-
-
-
-
5
2003.13528
-
-
-
-
6
2003.9807
-
-
-
-
7
2003.63695
-
-
-
-
8
2003.89974
-
-
-
-
9
2004.13863
-
-
-
-
10
2004.40144
-
-
-
-
11
2004.64036
-
-
-
-
12
2004.90322
-
-
-
-
13
2005.14221
36.80002
140.94320
-
-
14
2005.40519
37.51540
141.46654
-
6.64277
15
2005.64437
36.66750
142.06689
-
6.75522
16
2005.90766
37.54633
141.22993
68.23639
6.86805
17
2006.14734
33.72084
141.06731
23,85464
6.71396
Table 3: Continue
18
2006.41145
32.38688
139.90481
11.58168
6.68649
19
2006.65245
32.69383
139.22113
75.17745
6.68672
20
2006.91869
36.48288
138.36089
48.26886
6.71537
21
2007,16315
35,51297
138,55764
71.28674
6.81380
22
2007.43498
34.53478
137.89418
21.07020
6.64605
23
2007.68849
38.02940
139.19448
118.18463
6.70239
24
2007.97494
40.20898
138.27890
35.82580
6.68895
25
2008.25213
32.74544
135.74286
135.36327
6.73127
26
2008,57689
35,53977
136,56612
5.98980
6.63366
27
2008.91606
36.34732
137.11849
82.20294
6.61985
28
2009.34112
33.75918
135.95760
83.32762
6.71865
29
2009.84257
35.84768
136.86200
55.53033
6.67679
30
2010.53020
36.91080
135.41802
22.49965
9.00000
31
2011.45650
32.30861
133.63152
78,14867
6.69164
32
2012,83156
37,13569
133,66066
57,08119
6,59403
33
2014.87013
36.74008
134.16665
222.39738
6.72052
34
2018.04489
37.80706
133.77518
-201,63951
6.63694
35
2022.99545
34.47165
133.79251
144.68870
6.73537
36
2030.88189
36.60188
132.99172
71.14946
6.67985
37
2043.45610
36.09635
133.55142
94.59814
6.73619
38
2063.67788
26.99911
131.60662
133.86037
6.66664
39
2096.21109
29.87414
131.82307
-1.47959
6.77910
Total
N
39
27
27
24
26
A: Limited to the First 100 Cases
CONCLUSION
It was shown that the forecast coincided with what happened during the passage of Hurricane Irma, where the prediction of the tri-hourly atmospheric pressure one year in advance is an important tool for forecasting the impact of hurricanes in our territory, as well as its direct relationship with the appearance and spread in different tropical and subtropical regions of infectious entities, both of viral and parasitic etiology, and of different genera and species of vector organisms. In addition, it was shown that the trend of earthquakes is increasing on a global scale, and that they can be predicted by the 11-year solar cycle, as will happen in Haiti in 2031.
Acknowledgements
We thank the Department of the Group of Instruments and Methods of Observation (GIMO) of the Provincial Meteorological Center of Villa Clara for the data provided.
REFERENCE
Zhang, Z. and T.N. Krishnamurti. “A perturbation method for hurricane ensemble predictions.” Monthly Weather Review, vol. 127, 1999, pp. 447–469.
Socarrás, J. “Guía climática de la provincia de Villa Clara.” Proyecto de Investigación del Centro Meteorológico Provincial de Villa Clara, 2006.
Gore, A. “An inconvenient truth.” Videocassette, Paramount Classics and Participant Productions, 2007.
Dodla, V.B. et al. “A comparison of HWRF, ARW and NMM models in hurricane Katrina simulation.” International Journal of Environmental Research and Public Health, vol. 8, 2011, pp. 2447–2469.
Cepero, R.O. “Climate change: its effect on infectious diseases.” REDVET, vol. 13, 2012.
CRED. “Center for research on the epidemiology of disasters.” 2017, www.voanoticias.com/a/eeuu-huracanes-datos-record-2017-atlantico-clima-costos-destruccion/4021059.html.
Camargo, S.J. et al. “Seasonal tropical cyclone forecasts.” World Meteorological Organization Bulletin, vol. 56, 2007, pp. 297–309.
Osés, R. et al. “Forecasting hurricanes in the Caribbean Sea using regressive objective regression (ROR).” 2012.
Arnell, N.W. and S.N. Gosling. “The impacts of climate change on river flood risk at the global scale.” Climatic Change, vol. 134, 2016, pp. 387–401.
Aberson, S.D. et al. “Ensemble forecasting of tropical cyclone tracks.” 12th Conference on Numerical Weather Prediction, American Meteorological Society, 1998, pp. 290–292.
Goerss, J.S. “Tropical cyclone track forecasts using an ensemble of dynamical models.” Monthly Weather Review, vol. 128, 2000, pp. 1187–1193.
Vecchi, G.A. et al. “On the seasonal forecasting of regional tropical cyclone activity.” Journal of Climate, vol. 27, 2014, pp. 7994–8016.
Ruan, Z. and Q. Wu. “Precipitation, convective clouds, and their connections with tropical cyclone intensity and intensity change.” Geophysical Research Letters, vol. 45, 2018, pp. 1098–1105.
Osés, R.R. et al. “Prognosis for hurricane Irma through regression objective regressive and its impact on vector populations.” Biotempo, vol. 15, 2018, pp. 23–30.
Osés, R.R. et al. “Prediction of latitude and longitude of earthquakes at global level using the regressive objective regression method.” Advances in Theoretical & Computational Physics, vol. 1, 2018, pp. 1–5.
Osés, R.R. et al. “Age prediction for COVID-19 suspects and contacts in Villa Clara province, Cuba.” EC Veterinary Science, vol. 6, 2021, pp. 41–51.
Fimia, D.R. et al. “Modeling of equivalent effective temperature and its possible incidence on larval density.” Revista de Biología Tropical, vol. 65, 2017, pp. 565–573.
Sánchez, Á.M.L. et al. “Objective regressive regression beyond white noise for viruses circulating in Villa Clara province, Cuba.” The Biologist (Lima), vol. 15, 2017.
Osés, R. et al. “The ROR’s methodology and its possibility to find information in a white noise.” International Journal of Current Research, vol. 9, 2017, pp. 47378–47382.
Osés, R.R. et al. “Incidence of the annual rhythm in some climatic variables on culicidae larval populations.” The Biologist (Lima), vol. 16, 2018.
Wu, C.C. et al. “Typhoon forecast with the GFDL hurricane model.” Journal of the Meteorological Society of Japan, vol. 78, 2000, pp. 777–788.
Emanuel, K. “Increasing destructiveness of tropical cyclones over the past 30 years.” Nature, vol. 436, 2005, pp. 686–688.
Webster, P.J. et al. “Changes in tropical cyclone number, duration, and intensity in a warming environment.” Science, vol. 309, 2005, pp. 1847–1884.
Wang, B. et al. “Forecasting and warning of tropical cyclones in China.” Data Science Journal, vol. 6, 2007, pp. S723–S737.
Halperin, D.J. et al. “An evaluation of tropical cyclone genesis forecasts.” Weather and Forecasting, vol. 28, 2013, pp. 1423–1445.
Li, Q. et al. “An operational statistical scheme for tropical cyclone-induced rainfall forecast.” Recent developments in tropical cyclone dynamics, prediction, and detection, 2016, pp. 217–232.
Osés, R. “Mathematical modeling (ROR) applied to the forecast of earthquakes at the global level.” REDVET, vol. 15, 2014.
Fimia, D.R. et al. “Influence of climatic variables on fluvial malacofauna.” REDVET, vol. 13, 2012.
Fimia, R. et al. “Modeling and forecasting for mollusks with angiostrongylosis.” Neotropical Helminthology, vol. 10, 2016, pp. 61–71.
Fimia, D.R. et al. “Association of climatic variables with fasciolosis and angiostrongylosis.” Neotropical Helminthology, vol. 10, 2016, pp. 259–273.
Fimia, R. et al. “Modeling and prediction up to 2020 for total angiostrongylosis.” The Biologist (Lima), vol. 15, 2017.
Fimia, R. et al. “Mathematical modeling of cholera by objective regression.” The Biologist (Lima), vol. 15, 2017.
Osés, R.R. et al. “Incidence of atmospheric pressure in larval densities of mosquitoes.” The Biologist (Lima), vol. 16, 2018.
Osés, R.R. et al. “Study of provincial electricity consumption of Villa Clara.” ECOSOLAR Magazine, vol. 65, 2019, pp. 32–43.
Jiménez, G.J. “Effect of cloud cover on photovoltaic panels.” Thesis, Central University “Marta Abreu” of Las Villas, 2017.
Xie, L. et al. “A real-time hurricane surface wind forecasting model.” Monthly Weather Review, vol. 134, 2006, pp. 1355–1370.
Ballester, M. et al. “Variability of cyclonic activity in the North Atlantic region.” Academy Ed., 2010.
Arenas, V.A. and P.L. Carvajal. “Influence of climatic changes on sex definition in Aedes aegypti.” Faculty of Health Journal, vol. 4, 2012, pp. 11–24.
Roy, C. and R. Kovordányi. “Tropical cyclone track forecasting techniques: a review.” Atmospheric Research, vols. 104–105, 2012, pp. 40–69.
Osés, R.R. et al. “Regressive methodology (ROR) versus genetic code in VIH mutations.” International Journal of Agriculture Innovations and Research, vol. 3, 2015.
Trenberth, K. “Uncertainty in hurricanes and global warming.” Science, vol. 309, 2005, pp. 1753–1754.
Kundzewicz, Z.W. et al.“Flood risk and climate change: global and regional perspectives.” Hydrological Sciences Journal, vol. 59, 2013, pp. 1–28.
Zhang, Y. et al. “The impact of temperature and humidity on influenza A outbreaks.” International Journal of Infectious Diseases, vol. 30, 2015, pp. 122–124.
Beck-Johnson, L.M. et al.“The effect of temperature on Anopheles mosquito population dynamics.” PLoS One, vol. 8, 2013, pp. 1–12.
Osés, R.R. et al. “Modeling of equivalent effective temperature for larval density of mosquitoes.” Peruvian Journal of Entomology, vol. 51, 2016, pp. 1–7.
Aldaz, C.J.W. et al. “Climate prediction with a year in advance through Bluto’s index.” International Journal of Current Research, vol. 9, 2017, pp. 45382–45386.
Recommended Articles
Research Article
Evaluation of Mortality at One Year Follow-Up of Patients Having Early Tumors of Oropharynx Undergoing Trans-Oral Robotic Surgery in a Tertiary Care Hospital
Tapender Singh,
Vinay Gupta
Published: 27/01/2025
Download PDF
Research Article
Molecular Study to Detect Some Virulence Factors in Methicillin – Resistance Staphlococcus Aureus Isolated from Eye Infections in Wasit Province
Nofel Hossin Amhi Alshammari,
Haider Kareem Jassem
Published: 15/12/2023
Download PDF
Research Article
Estimation Of Hba1c in Non-Diabetic Patients with Myocardial Infarction
Tamarah Riyadh Sabeeh
Published: 19/07/2024
Download PDF
Research Article
Occurrence of Multi-Drug Resistance of E. coli Isolated from Urinary Tract Infection in Najaf City
Alaa Hamza Jaber Al-Jelehawy,
...
Haneen Ali Kadham
Published: 05/10/2025
Download PDF
PO Box 101, Nakuru
Kenya.
Email: office@iarconsortium.org
Editorial Office:
J.L Bhavan, Near Radison Blu Hotel,
Jalukbari, Guwahati-India
Osés Rodríguez, R., Fimia-Duarte, R., Valle Laveaga, D. D., Otero Martin, M., Ruiz Cabrera, N., Zaita Ferrer, Y., Iannacone, J. & Wilford González, F. M. (2022). Mathematical Modeling and Its Applicability from Natural Disasters to Human Health. Scientific Research Journal of Medical Sciences, 2(1), 1-6.
MLA
Osés Rodríguez, Ricardo, et al. "Mathematical Modeling and Its Applicability from Natural Disasters to Human Health." Scientific Research Journal of Medical Sciences 2.1 (2022): 1-6.
Chicago
Osés Rodríguez, Ricardo, Rigoberto Fimia-Duarte, David del Valle Laveaga, Meylin Otero Martin, Nancy Ruiz Cabrera, Yanira Zaita Ferrer, José Iannacone and Frank M. Wilford González. "Mathematical Modeling and Its Applicability from Natural Disasters to Human Health." Scientific Research Journal of Medical Sciences 2, no. 1 (2022): 1-6.
Harvard
Osés Rodríguez, R., Fimia-Duarte, R., Valle Laveaga, D. D., Otero Martin, M., Ruiz Cabrera, N., Zaita Ferrer, Y., Iannacone, J. and Wilford González, F. M. (2022) 'Mathematical Modeling and Its Applicability from Natural Disasters to Human Health' Scientific Research Journal of Medical Sciences 2(1), pp. 1-6.
Vancouver
Osés Rodríguez R, Fimia-Duarte R, Valle Laveaga DD, Otero Martin M, Ruiz Cabrera N, Zaita Ferrer Y, Iannacone J, Wilford González FM. Mathematical Modeling and Its Applicability from Natural Disasters to Human Health. Scientific Research Journal of Medical Sciences. 2022 Jan;2(1):1-6.



 Download PDF
 Download XML