Background: Knee Osteoarthritis (KOA) is a degenerative pathology marked by progressive cartilage attrition and extracellular matrix (ECM) disruption, where Decorin (DCN) is a small, leucine-rich proteoglycan that provides a binding mechanism in chondrocyte biology, making it an important structural component for matrix integrity and the biomechanical function of cartilage. Objective: To quantify DCN gene expression in KOA patients and evaluate its correlation with clinical severity. Methods: mRNA was extracted from whole blood samples of KOA patients (n=10) and healthy controls (n=10). Relative expression was determined via RT-qPCR using the 2-ΔΔCt method, normalized to GAPDH. Statistical analysis and visualization were performed using GraphPad Prism v.6. Results: A highly significant upregulation of DCN expression was observed in the KOA cohort compared to controls (p<0.001), showing a fold-change of approximately 12. High expression levels demonstrated a strong positive correlation with advanced disease stages. Conclusion: The marked elevation of DCN suggests a compensatory mechanism to mitigate ECM degradation. These findings highlight DCN as a sensitive molecular biomarker for KOA progression and therapeutic monitoring.
Keywords
Knee Osteoarthritis
Decorin
Gene Expression
RT-qPCR
GAPDH
INTRODUCTION
Knee Osteoarthritis (KOA) is the most common and widespread form of arthritis, affecting millions worldwide [1], particularly in the knee and hip joints, causing pain and stiffness that limit daily activities [2]. The disease begins as a disorder in specific tissues and then progresses to involve all components of the joint [3], leading in advanced stages to cartilage erosion, bone damage, synovitis [4], and involvement of surrounding muscles [5]. This disease results from an imbalance between the processes of building and breaking down within joint tissues [6], most importantly cartilage and bone, which are primarily composed of collagen and glycoproteins such as Decorin [7]. To determine the extent of disease progression, it is preferable to measure the small fragments resulting from the breakdown of these proteins, as they are more stable and accurate to measure compared to whole cytokines, thus providing a more precise understanding of the patient's condition [1,7,8].
Decorin (DCN) is a multifunctional glycoprotein rich in leucine that plays a crucial role in regulating collagen fiber formation [9]. DCN is found primarily in fibrous connective tissue and is a major component of the extracellular matrix (ECM) of cartilage [10, 11], where it contributes to its biomechanical functions [4,12]. In osteoarthritis, DCN is lost from the articular cartilage surface and its concentration increases in the deeper regions [13], and it undergoes severe degradation in patients [9,11,14]. Although DCN deficiency leads to a progressive loss of bone mass [15] and alterations in the mechanical properties of the matrix [16], the molecular mechanisms underlying this deficiency remain incompletely understood [15].
MATERIALS AND METHODS
Ethical Approval
Ethical approval for this study was obtained from the Scientific and Ethical Research Committee of the Nineveh Health Directorate (Session No. 212 on December 4, 2024). The research project was registered under reference number (2024228). Formal written informed consent was obtained from all individual participants included in the study prior to sample collection. Participants were informed about the study's objectives ensuring the confidentiality and anonymity of their personal data.
Patient Selection
The study included 10 patients diagnosed with severe KOA were enrolled in this pilot study. The diagnosis and severity of KOA were confirmed by specialized orthopedic surgeons at Al-Salam Teaching Hospital in Mosul in September 5, 2024, based on MRI and X-ray examinations based on clinical examination. According to the Kellgren-Lawrence (K-L) grading system, only patients with Grade 4 (indicating severe joint space narrowing and significant osteophyte formation) were included.
Individuals with autoimmune diseases, diabetes, neurological disorders, or those who had undergone previous knee surgery were excluded to ensure the accuracy of the results. Conversely, the study included a control group of 10 healthy individuals who underwent clinical examination to confirm the absence of any symptoms or morning stiffness. These individuals were matched to the patient group in terms of age (50-65 years) and sex (3 males, 7 females), as well as weight and height.
Sample Collection and Preparation
Venous blood samples 1ml were collected using sterile, single-use syringes and immediately transferred into sterile tubes containing Ethylenediaminetetraacetic acid (EDTA) as an anticoagulant [17]. The tubes were gently inverted several times to ensure thorough mixing and prevent micro-clot formation. To preserve ribonucleic acid (RNA) integrity, the samples were transported to the laboratory chilled on ice -80℃. For RNA extraction, the blood was diluted and gently transferred to sterile tubes containing a red blood cell (RBC) lysis solution. Total RNA was then isolated using a specialized extraction kit (Addbio, Korea) following the manufacturer's protocol. The concentration and purity of the extracted RNA were assessed using a Nano Drop™ 2000 spectrophotometer, ensuring that the absorbance ratio (A260/A280) was within the optimal range (1.8–2.0). Finally, the purified RNA was used for downstream Real-Time PCR applications using the Step OnePlus™ System.
Primer’s Design
Two set of primers are used in this study, first primer used for glyceraldehyde-3-phosphate dehydrogenase gene (GAPDH) as housekeeping gene and other primer used for DCN gene as target gene. These primers were designed by using NCBI- Gene Bank Data Base, the primers used in quantification of gene expression using quantitative (real time-PCR) techniques, and supported from (Macrogen, Korea) company Table 1 [18].
Table 1: Primers uses Design
Primer
Sequences
GAPDH- forward
GAPDH- reverse
5'-AGCAACAGGGTGGTGGACCT-3'
5'AGTGTGGCGGAGATGGGGCA-3'
DCN-forward
DCN- reverse
5'- TGTTGTTCGATTATGGGTGCT -3'
5'- GGCTGTACTGAAGACAGAAAGTG -3'.
Extracting RNA
Extracting RNA from blood is according the manufacturer’s protocol kit instructions (Addbio, Korea). a delicate, multi-step process that begins with adding frozen blood to a blood lysis buffer to break down the red blood cells. After lysis, centrifugation is used to separate the white blood cells, which form the pellet, from the overlying fluid. The process begins with lysing the red blood cells using the lysis buffer, and then the white blood cells are separated by centrifugation. 400 μL of the blood lysis buffer is added to the remaining white cell pellet, followed by 4 μL of beta-mercaptoethanol and 20 μL of Proteinase K (20 mg/ml) to digest the proteins. Next, 400 μL of 70% ethanol and 400 μL of binding solution are added to bind the RNA to the spin column. Impurities are washed away using 500 μL of wash Solution 1 and 700 μL of Wash Solution 2. A mixture of 10 μl of DNase and 40 μl of DNase I reaction buffer is used to remove any DNA. Finally, purified RNA is extracted using 50 μl of elution buffer and stored at -80°C.
Real Time-PCR For cDNA Synthesis
Description of RT-PCR reaction setup and analysis using the RT-PCR SYBR Master Kit from Addbio Korea. This kit is used to perform reverse transcription of RNA into cDNA, followed by amplification of the cDNA via real-time PCR (qPCR). The mixture is prepared by adding 10 µL of Master Mix, 0.5 µL of each primer (forward and reverse), 3 µL of RNA, and 6 µL of nuclease-free water, for a total reaction volume of 20 µPrimers manufactured by Macrogen Korea for the DCN gene were used.
The reaction was carried out according to the optimal conditions recommended by the manufacturer: the process begins with reverse transcription at 50°C for 20 minutes, followed by reverse transcriptase inhibition and RNA denaturation at 95°C for 10 minutes. The qPCR reaction, which consists of 40 cycles, begins with DNA denaturation at 95°C for 15 seconds, followed by primer annealing at 60°C for 60 seconds. The messenger ribonucleic acid (mRNA) expression of DCN gene was normalized to gene GAPDH (housekeeping gene) and relative quantification was determined using the 2-ΔΔCt method [18,19].
DNase Treatment
The extracted RNA sample was treated with DNase I to remove any traces of genomic DNA before starting the RT-PCR reaction. This step is essential to avoid false-positive results. RT-PCR SYBR Master Mix was then used to reverse-transcription the RNA into complementary cDNA, and the cDNA was then amplified via real-time PCR, according to the manufacturer's instructions (Addbio, Korea).
Quantitative Real-Time PCR
According to method described by [20], calculated the relative expression by q (rt-PCR) for target gene DCN gene in Whole blood of KOA patients’ comparison with control, the ΔCT using a reference gene method can be used by normalizing gene expression of target gene DCN with gene expression of housekeeping gene GAPDH as a reference gene. This method used the difference between reference and target Ct values for each sample, the expression level of the reference gene is taken into account using following formula:
Expression value (Fold yield) = 2^CT (reference) – CT (target)
Experimental Design of q (real time- PCR)
For quantification of DCN gene expression in whole blood, internal control gene as a housekeeping gene GAPDH was used for normalization of gene expression levels, therefore, preparing two q(rt-PCR) master mixes as the following:
q(rt-PCR) master mix for DCN target gene (forward & reverse), preparing 20 µL of total volume cDNA template for these gene show in Table 2.
Table 2: Components of the RT-qPCR Master Mix for the DCN Target Gene
Component
Volume
qPCR Master Mix(2X)
10 µL
cDNA template
3 µL
Primers
DCN -Forward
0.5µL
DCN -Reverse
0.5 µL
DEPC-Treated water (Diethyl Pyro carbonate)
6 µL
Total
20 µL
q (rt-PCR) master mix for GAPDH-r gene (forward & reverse), preparing 20 µL of total volume to cDNA template for these gene show in Table 3.
Table 3: Components of the RT-qPCR Master Mix for the GAPDH Reference Gene
Component
Volume
qPCR Master Mix(2X)
10 µL
cDNA template
3 µL
Primers
GAPDH -Forward
0.5 µL
GAPDH -Reverse
0.5 µL
DEPC-Treated water (Diethyl Pyro carbonate)
6 µL
Total
20 µL
Both cDNA samples from KOA patients and the control group were subjected to a real-time PCR program on the One-Step Exicycler™ 96 for relative quantification. The program includes an initial denaturation step at 95°C for five minutes for one cycle to activate the Taq DNA polymerase. This was followed by 40 cycles of amplification, with each cycle consisting of a denaturation step at 95°C for 15 seconds and a combined primer annealing/extension step at 60°C for 60 seconds. This protocol was used to amplify and quantify the DCN and GAPDH transcript. The program is divided into two main phases: initial activation and amplification cycles show in table 4.
Table 4: Optimized Thermal Cycling Conditions for RT-qPCR Analysis
Step
Number of Cycles
Temperature
Time
Purpose
Reverse Transcription
1
50 °C
20 min
cDNA Synthesis
Enzyme Inactivation
1
95 °C
10 min
Inactivation of Reverse Transcriptase and RNA hybrid denaturation
Denaturation
40
95 °C
15 s
DNA strands separation
Annealing/ Extension
60 °C
60 s
Primer binding and DNA synthesis.
The experimental procedures and molecular analyses were conducted at the central laboratory, college of science, university of Mosul, Iraq.
Statistical Analysis
Statistical analysis was performed using GraphPad Prism v.6 (RRID: SCR_002798). Differences between the patient and control groups were evaluated using the student’s t-test for normally distributed data or the Mann-Whitney U test for non-parametric distributions. For multiple comparisons, two-way ANOVA followed by Fisher's Least Significant Difference (LSD) test or repeated measures ANOVA was employed. All results were expressed as mean ± SD, and a P-value < 0.05 was considered statistically significant.
RESULT ANALYSES
Specificity of qPCR Amplification (Melt Curve Analysis)
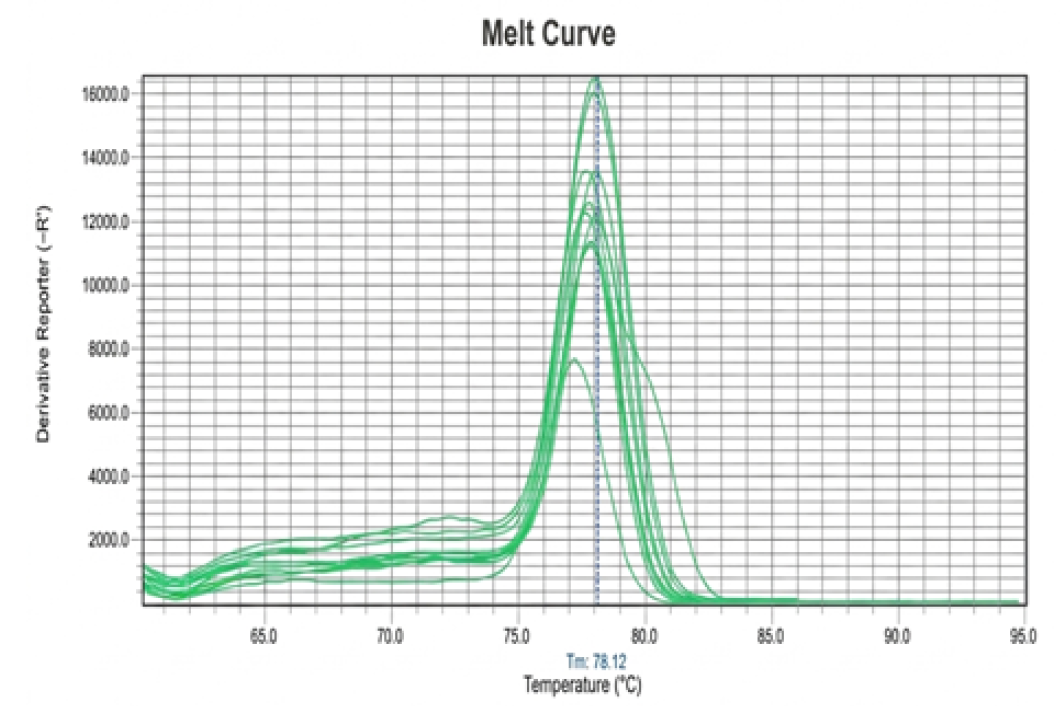
To verify the precision of the amplification process, show figure 3and 4, a melt curve analysis was conducted for the qPCR products. The analysis revealed a single, sharp peak at a melting temperature (Tm) of approximately 78.12 °C in (Figure 1).
Figure 1: Dissociation (Melt Curve) Analysis of qPCR Products
The presence of this unique peak indicates that the amplification was highly specific to the target DCN gene, with no evidence of non-specific by-products or primer-dimer formation [20].
Quantitative Analysis of Decorin Gene Expression
The relative expression of the DCN gene was assessed in whole blood samples from both patients and the healthy control group. The GAPDH gene was utilized as an internal reference (housekeeping gene) to normalize the expression levels see in Table 5.
Table 5: Cycle Threshold (CT) Value for DCN Gene Expression in Healthy and KOA Patients’ Blood Samples
Healthy Group Sample No.
CT mean value Healthy
KOA Patients Sample No.
CT mean value Patients
1
32.1
11
31.6
2
31.9
12
30.1
3
36.8
13
29.7
4
34.1
14
30.4
5
35.9
15
29.6
6
33.2
16
30.2
7
33.6
17
28.9
8
32.9
18
29.7
9
31.9
19
31.4
10
33.3
20
30.2
Average
33.57
Average
30.18
Calculation of ΔCt and ΔΔCt
The Ct (Cycle Threshold) values were recorded for each sample show in Table 6.
Table 6: Comparative Analysis of 2-ΔΔCt and Relative Fold Change for the DCN Gene Expression [20]
Group
Sample No.
Ct, DCN target gene
Ct, GAPDH
references gene
ΔCt
ΔΔCt
Fold Change (2-ΔΔCt)
Healthy Control
1
32.1
18
14.1
-1.47
2.77
2
31.9
18
13.9
-1.67
3.18
3
36.8
18
18.8
3.23
0.10
4
34.1
18
16.1
0.53
0.69
5
35.9
18
17.9
2.33
0.19
6
33.2
18
15.2
-0.37
1.29
7
33.6
18
15.6
0.03
0.97
8
32.9
18
14.9
-0.67
1.59
9
31.9
18
13.9
-1.67
3.18
10
33.3
18
15.3
-0.27
1.20
KOA Patient
11
31.6
18
13.6
-1.97
3.91
12
30.1
18
12.1
-3.47
11.08
13
29.7
18
11.7
-3.87
14.62
14
30.4
18
12.4
-3.17
9.00
15
29.6
18
11.6
-3.97
15.67
16
30.2
18
12.2
-3.37
10.33
17
28.9
18
10.9
-4.67
25.45
18
29.7
18
11.7
-3.87
14.62
19
31.4
18
13.4
-2.17
4.500
20
30.2
18
12.2
-3.37
10.33
Ct: Threshold cycle; DCN: Decorin (target gene); GAPDH: Glyceraldyhyde3-phosphate dehydrogenase (reference gene); ΔCt was calculated as (Ct,target - Ct,reference); ΔΔCt was calculated relative to the mean of the healthy control group; Fold change was determined using the 2-ΔΔCt method. Data represent individual biological replicates for healthy controls (n=10) and KOA patients (n=10)
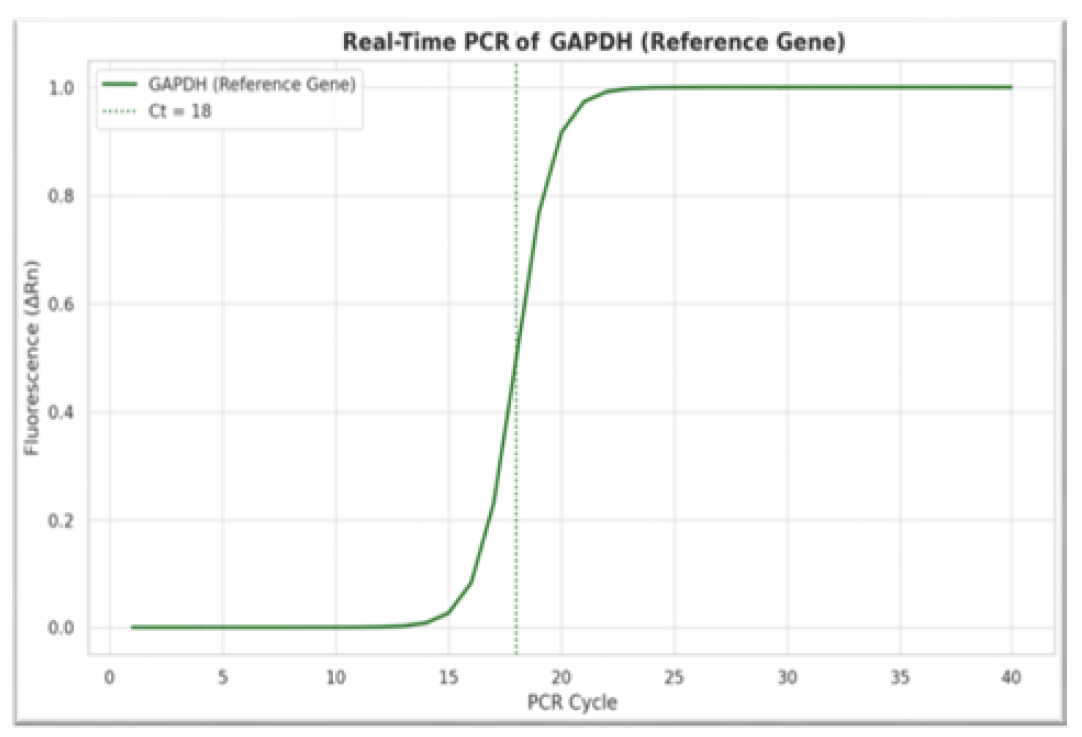
Notably, the Ct value for GAPDH remained constant at 18.0 across all samples Figure 2, ensuring a stable baseline for normalization [18,20].
Figure 2: Amplification Plots of the GAPDH Reference Gene
ΔΔCt Calculation: The arithmetic mean of the Ct values from the healthy group was used as a calibrator:
ΔΔCt = Sample ΔCt - Average ΔCt (Healthy Group)
Relative Fold Change
The relative fold change in DCN gene expression was determined using the following formula[22]: Fold Change = 2-ΔΔCt.
Our findings indicate that a negative ΔΔCt value corresponds to a higher expression of the DCN gene in the patient group compared to the control group, suggesting a significant upregulation of this biomarker in individuals with KOA.
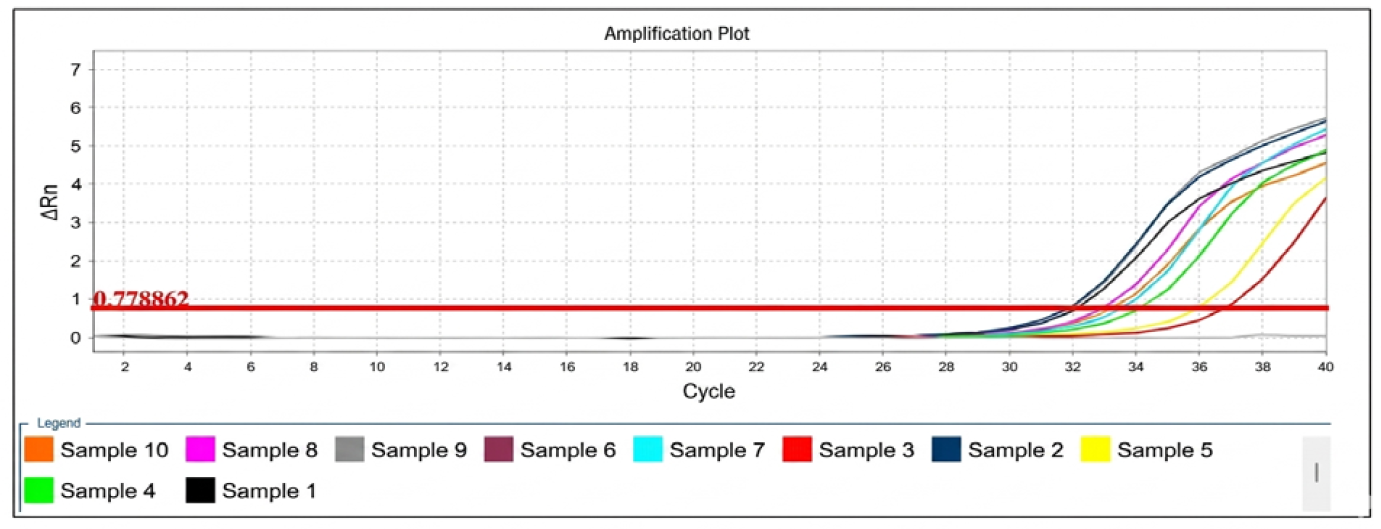
Figure 3: Real-time PCR Amplification Plots for the DCN Gene in Healthy
ΔRn is the magnitude of normalized fluorescence signal generated by the reporter at each cycle during the PCR amplification
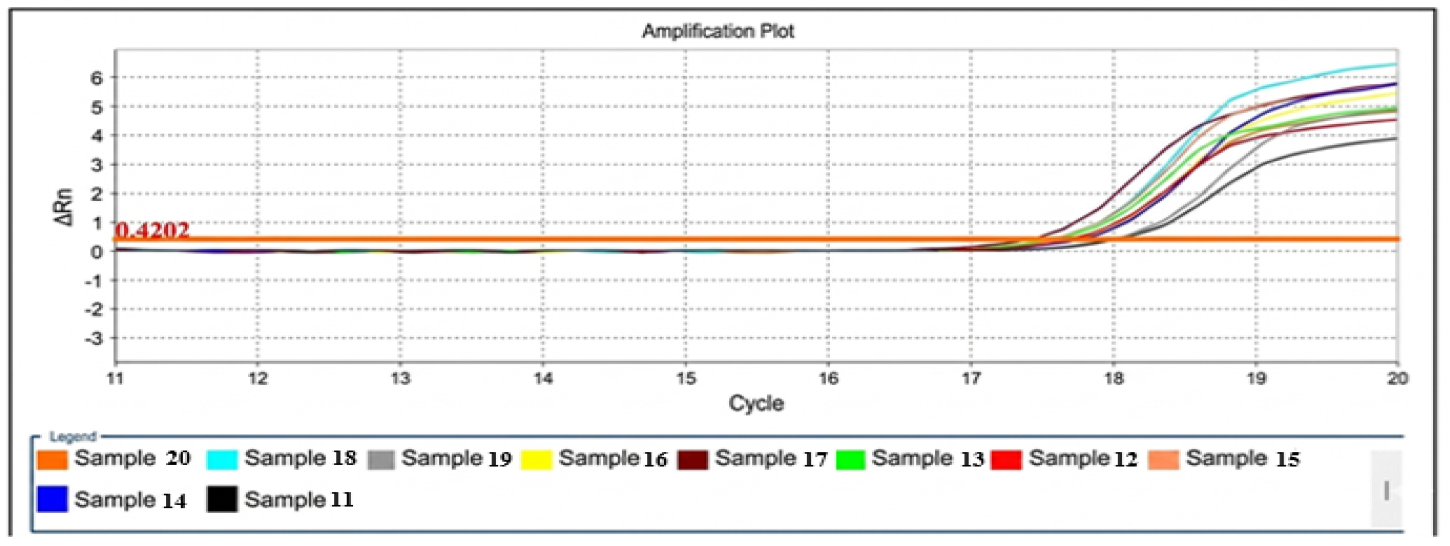
Figure 4: Real-time PCR Amplification Plots for the DCN Gene in KOA Patients.Note: ΔRn is the Magnitude of Normalized Fluorescence Signal Generated by the Reporter at Each Cycle During the PCR Amplification
Relative Fold Change of Decorin Gene
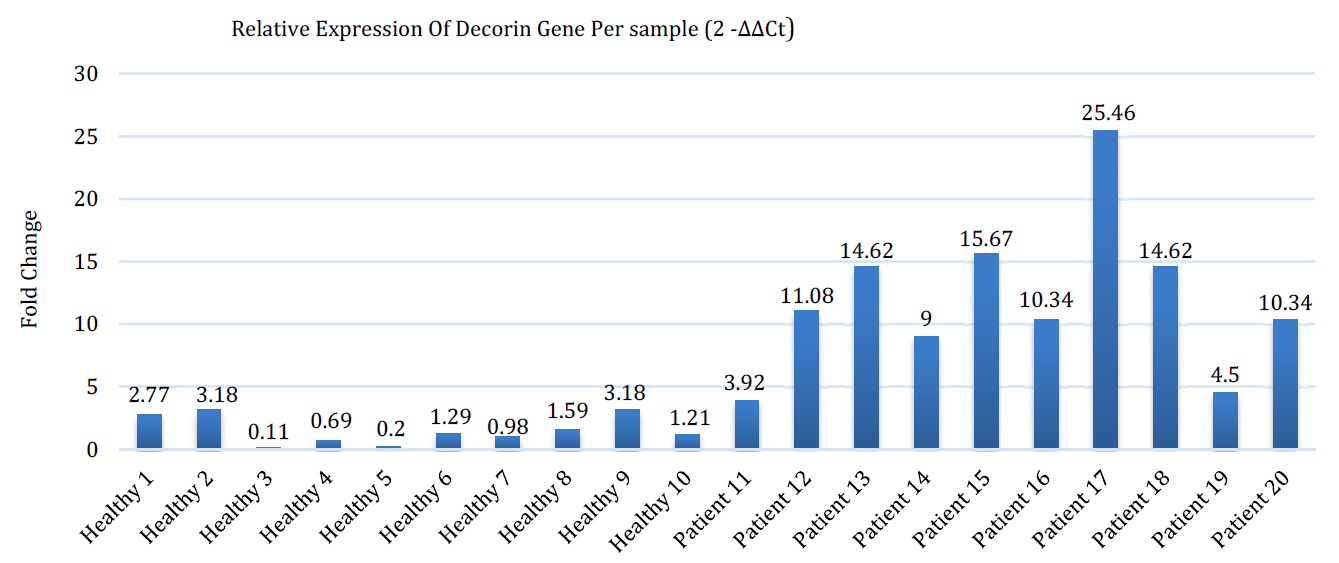
The results presented that most patient samples had significantly decreased ΔCt compared to the healthy control group, indicating higher expression of the DCN gene. When these values were converted to fold change, patients were found to have approximately 12-fold higher gene expression compared to healthy controls show in Figure 5.
Figure 5: Histogram Illustrating the Relative Expression Levels Of DCN Gene In Individual Groups For Healthy Compared To Koa Patient’s Groups, Using The 2-Δδct Method. Each Bar Shows One Sample, and Expression Levels were Calculated Relative to the Mean Δct in The Healthy Group (Used As A Control). Higher Expression Values in Koa Patients Diseased Samples Indicate A Significant Upregulation Of DCN Gene Compared to Healthy Controls
Statistics Analysis
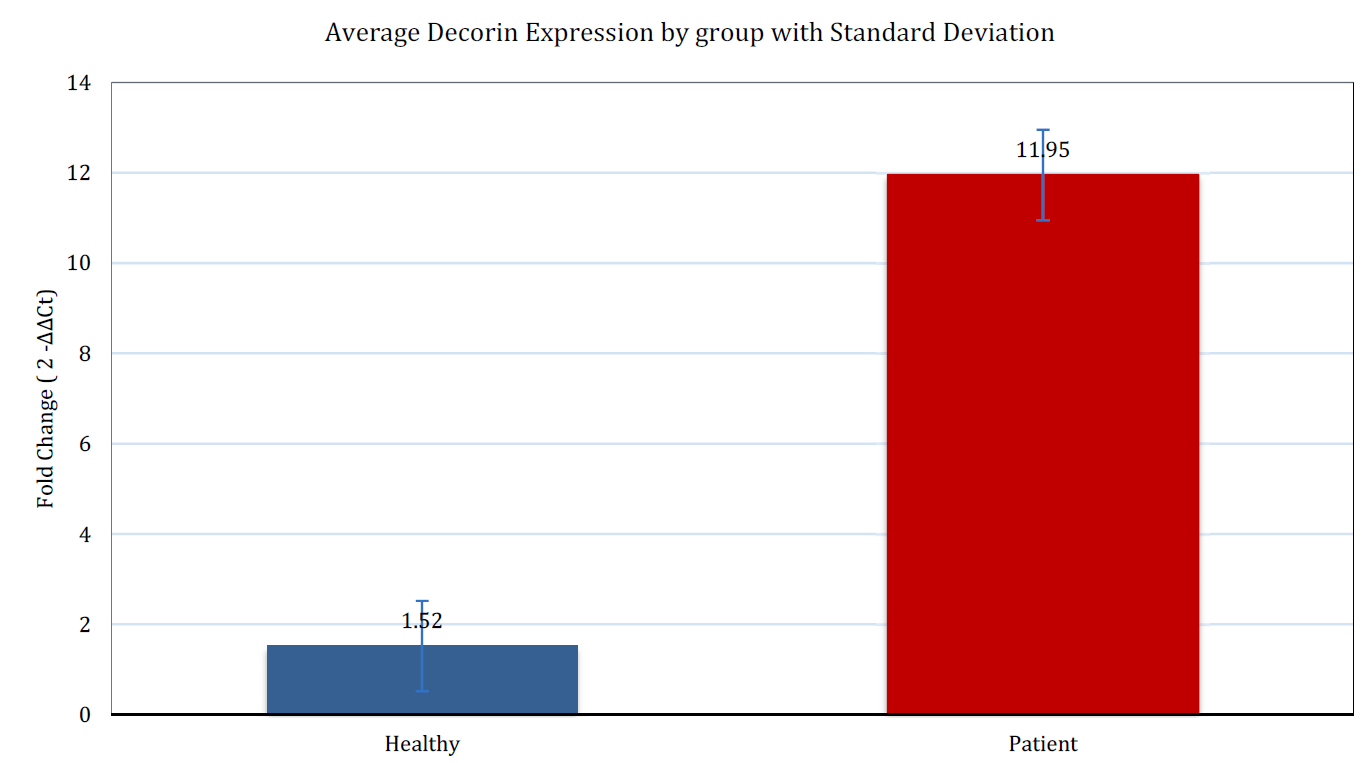
To evaluate the differences in gene expression between the study groups, an independent t-test was conducted. The results revealed a significant elevation in DCN gene expression among patients compared to the healthy control group. The mean fold change for patients was (11.95±6.19), whereas it was (1.52±1.15) for the healthy controls. This difference was found to be highly significant statistically, with a T-value of -5.24 and a p-value of (p<0.001), as detailed in Table 7.
Table 7: Statistical Analysis of DCN Gene Expression (Fold Change) in Healthy and Patient Group
Group
Average Fold Change
Standard Deviation
Number of Samples
T-statistic
p-value
Healthy
1.52
1.15
10
-5.24
0.000431
KOA Patient
11.95
6.19
10
-5.24
0.000431
DISCUSSION
Knee osteoarthritis (KOA) is characterized by clinical symptoms including pain, swelling, and limited mobility. It is a chronic and progressive condition marked by cartilage erosion and changes in bone and synovial membrane. Cartilage degeneration is the primary factor in the onset and progression of the disease. Decorin (DCN) regulates the integrity of the aggrecan network by promoting molecular adhesion between aggrecan and collagen [23], thereby enhancing the integration of this network within the extracellular matrix (ECM) of cartilage [24]. Collagen fibers play a vital role in the support and elasticity of the matrix, and elevated DCN levels indicate tissue damage associated with increased inflammation and proteolytic enzyme activity [25]. Research [26] indicates that DCN possesses anti-inflammatory, angiogenic, and fibroblast-protective properties and is associated with several disease conditions, including osteoarthritis, muscular dystrophy, Ehlers-Danlos syndrome, and certain eye diseases. The analyses in this study aimed to evaluate the gene expression of DCN in human samples from two groups (healthy and diseased) using real-time reverse transcription polymerase chain reaction (RT-PCR), with the GAPDH gene used as a reference gene to calibrate target gene expression. Our results show a clear and significant increase in DCN gene expression levels in patients compared to healthy individuals (P < 0.001), as illustrated in Table 7 and Figures 6.
Figure 6: Mean Relative Fold Change of DCN Gene Expression in KOA Patients and Healthy Controls
Furthermore, gene expression levels were observed to be significantly higher in advanced osteoarthritis compared to less severe cases, as shown in Figure 5. These results are consistent with another study [27] that found elevated levels of DCN in osteoarthritis patients, as well as with a study [28] conducted on 44 patients that demonstrated a direct correlation between levels of this protein and pain scores and motor function. Our findings are also consistent with a study [29] that revealed significantly higher levels of SLRP proteins such as DCN in the cartilage of osteoarthritis patients, reinforcing the hypothesis that DCN is an important biomarker for the disease. In contrast, [30] indicated no difference in serum DCN levels between early-stage and healthy patients, highlighting the importance of tissue type (cartilage versus blood) and disease stage in assessment. DCN loss exacerbates DCN depletion and surface fibrosis, accelerating cartilage degeneration [31]. Experiments in mice have shown that the absence of DCN leads to a significant decrease in aggrecan content, impairing the biomechanical properties of cartilage, such as reducing the modulus of elasticity and increasing hydraulic permeability [29]. The appearance of a single, sharp melting peak at the same temperature for all samples confirms the high specificity of the primer design and the absence of non-specific amplification, supporting the reliability of the extracted Ct data and Figure 1. Gene expression analysis is a powerful tool for understanding joint degeneration, revealing genes involved in vital functions such as metabolism, matrix synthesis, inflammation, and cell death, as confirmed by previous studies [32][33]. Based on the study results, elevated blood levels of DCN, along with disease progression, are independent risk factors that increase the likelihood of developing osteoarthritis, suggesting that elevated DCN may be a marker of accelerated proteoglycan synthesis as part of cartilage repair and regulation efforts during disease progression.
CONCLUSION
Gene expression analysis of DCN using Real-Time PCR (RT-PCR) via the 2-ΔΔCt method revealed significant variations between the patient and healthy control groups. The data indicated that the patient group, diagnosed with severe knee osteoarthritis, exhibited a substantial increase in gene expression, averaging approximately 12-fold higher than the healthy control group. The GAPDH gene served as an internal reference for normalization, ensuring the accuracy and reliability of the comparative results. This marked upregulation in patients likely reflects the pathological involvement of DCN in the progression of severe knee osteoarthritis and suggests its role in regulating cellular processes associated with the disease's advanced stages. These findings provide compelling evidence for the potential utility of DCN as a diagnostic molecular marker.
Conflict of Interest
The authors confirm that they have no competing interests, financial or otherwise, that could be perceived as influencing the objectivity of this work.
Funding
This research received no outside support or specific funding from any agency in the public, commercial, or not-for-profit sectors.
Acknowledgments
The authors express their sincere gratitude to all who contributed to the completion of this research. They also extend special thanks to the Department of Chemistry, College of Science, University of Mosul, for their ongoing support throughout the research process.
REFERENCE
Monica, T.H. et al. "From biochemical markers to molecular endotypes of osteoarthritis: a review on validated biomarkers." Expert Review of Molecular Diagnostics, vol. 24, 2024, pp. 23–38. https://doi.org/10.1080/14737159.2024.2315282
Hamodat, Z.M.A. "Cartilage oligomeric matrix protein: a biomarker for diagnostic and monitoring osteoarthritis review article." Medical Journal of Babylon, vol. 17, no. 4, 2020, pp. 311–317. https://doi.org/10.4103/MJBL.MJBL_52_20
Taha, M.A. and Hamodat, Z.M.A. "Osteopenia as a biomarker for diagnosing the severity of osteoarthritis." Ukrainian Biochemical Journal, vol. 96, no. 5, 2024. https://doi.org/10.15407/ubj96.05.031
Dube, B. "Characterising novel imaging biomarkers for use in knee osteoarthritis clinical trials." PhD Thesis, University of Leeds, Leeds, 2020.
Mudasir, M. et al. "An up to date on clinical prospects and management of osteoarthritis." Annals of Medicine and Surgery, vol. 72, 2021, pp. 103077. https://doi.org/10.1016/j.amsu.2021.103077
Yoke, Y.C. and Kok-Yong, C. "The role of inflammation in the pathogenesis of osteoarthritis." Mediators of Inflammation, 2020. https://doi.org/10.1155/2020/8293921
Gelse, K., Pöschl, E. and Aigner, T. "Collagens—structure, function, and biosynthesis." Advanced Drug Delivery Reviews, vol. 55, no. 12, 2003, pp. 1531–1546. https://doi.org/10.1016/j.addr.2003.08.002
Anne, C.B.J. et al. "Blood and urinary collagen markers in osteoarthritis: markers of tissue turnover and disease activity." Expert Review of Molecular Diagnostics, vol. 20, no. 1, 2020, pp. 57–68. https://doi.org/10.1080/14737159.2020.1704257
Claus, R.H. et al. "The glycosaminoglycan chain of decorin plays an important role in collagen fibril formation at the early stages of fibrillogenesis." FEBS Journal, vol. 274, 2007, pp. 4246–4255. https://doi.org/10.1111/j.1742-4658.2007.05951.x
Dipon, K.M. et al. "Decorin suppresses tumor lymphangiogenesis: a mechanism to curtail cancer progression." Proceedings of the National Academy of Sciences of the United States of America, vol. 121, no. 18, 2024, pp. e2317760121. https://doi.org/10.1073/pnas.2317760121
Mengying, W. et al. "Decorin knockdown affects the gene expression profile of adhesion, growth and extracellular matrix metabolism in C-28/I2 chondrocytes." PLoS One, vol. 15, no. 4, 2020, pp. e0232321. https://doi.org/10.1371/journal.pone.0232321
Nikos, K.K. et al. "Extracellular matrix-based cancer targeting." Trends in Molecular Medicine, vol. 29, no. 10, 2022, pp. 1000–1013. https://doi.org/10.1016/j.molmed.2021.07.009
Lourdes, A.R., Ramón, C. and Juan, M.D. "Proteoglycans in articular cartilage and their contribution to chondral injury and repair mechanisms." International Journal of Molecular Sciences, vol. 24, no. 13, 2023, p. 10824. https://doi.org/10.3390/ijms241310824
Goncalo, B. et al. "Soluble biglycan: a potential mediator of cartilage degradation in osteoarthritis." Arthritis Research and Therapy, vol. 17, 2015, pp. 379. https://doi.org/10.1186/s13075-015-0902-0
Corsi, A. et al. "Phenotypic effects of biglycan deficiency are linked to collagen fibril abnormalities, are synergized by decorin deficiency, and mimic Ehlers-Danlos-like changes in bone and other connective tissues." Journal of Bone and Mineral Research, vol. 17, no. 7, 2002, pp. 1180–1189. https://doi.org/10.1359/jbmr.2002.17.7.1180
Han, B. et al. "Differentiated activities of decorin and biglycan in the progression of post-traumatic osteoarthritis." Osteoarthritis and Cartilage, vol. 29, no. 8, 2021, pp. 1181–1192. https://doi.org/10.1016/j.joca.2021.03.019
Noor, M. et al. "In vivo, in vitro, and molecular docking study of rat pancreatic lipase inhibition using isopropyl salicylate." Ukrainian Biochemical Journal, vol. 97, no. 4, 2025, pp. 1–10.
Xiayu, R., Xuelin, H., Zhicheng, Z. and Xin, L. "An improvement of the 2−ΔΔCT method for quantitative real-time polymerase chain reaction data analysis." Biostatistics, Bioinformatics and Biomathematics, vol. 3, no. 3, 2013, pp. 71–85.
Robert, D.B. et al. "GAPDH as a housekeeping gene: analysis of GAPDH mRNA expression in a panel of 72 human tissues." Physiological Genomics, vol. 21, no. 3, 2005, pp. 389–395. https://doi.org/10.1152/physiolgenomics.00025.2005
Aleksandar, R. et al. "Guideline to reference gene selection for quantitative real-time PCR." Biochemical and Biophysical Research Communications, vol. 313, no. 4, 2004, pp. 856–862. https://doi.org/10.1016/j.bbrc.2003.11.177
Jo, V. et al. "Accurate normalization of real-time quantitative RT-PCR data by geometric averaging of multiple internal control genes." Genome Biology, vol. 3, no. 7, 2002, pp. 0034.1–0034.11. https://doi.org/10.1186/gb-2002-3-7-research0034
Livak, K.J. and Schmittgen, T.D. "Analysis of relative gene expression data using real-time quantitative PCR and the 2−ΔΔCT method." Methods, vol. 25, no. 4, 2001, pp. 402–408. https://doi.org/10.1006/meth.2001.1262
Magnusson, K., Turkiewicz, A. and Englund, M. "Nature vs nurture in knee osteoarthritis: the importance of age, sex and body mass index." Osteoarthritis and Cartilage, vol. 27, no. 4, 2019, pp. 586–592. https://doi.org/10.1016/j.joca.2018.12.018
Hui, Z. et al. "Human extracellular matrix (ECM)-like collagen and its bioactivity." Regenerative Biomaterials, vol. 11, no. 1, 2024, pp. rbae008. https://doi.org/10.1093/rb/rbae008
Biao, H. et al. "Decorin regulates the aggrecan network integrity and biomechanical functions of cartilage extracellular matrix." ACS Nano, vol. 13, no. 10, 2019, pp. 11320–11333. https://doi.org/10.1021/acsnano.9b04477
Shaimaa, M.H., Basma, S.E., Sarah, Y.A. and Maha, S.M. "Level of decorin as a small leucine rich proteoglycan in knee osteoarthritis patients." Journal of Recent Advances in Medicine, vol. 4, no. 1, 2023, pp. 23–29. https://doi.org/10.21608/jram.2022.140359.1169
Kenan, O. "Relationship between increased serum and synovial fluid decorin levels and knee osteoarthritis." Indian Journal of Medical Research, vol. 153, no. 4, 2021, pp. 453–458. https://doi.org/10.4103/ijmr.IJMR_2020_18
Bock, H.C. et al. "The small proteoglycans decorin and biglycan in human articular cartilage of late-stage osteoarthritis." Osteoarthritis and Cartilage, vol. 9, no. 7, 2001, pp. 654–663. https://doi.org/10.1053/joca.2001.0420
Jordi, M. et al. "Degradation of small leucine-rich repeat proteoglycans by matrix metalloprotease-13: identification of a new biglycan cleavage site." Arthritis Research & Therapy, vol. 8, no. 1, 2006, p. R26. https://doi.org/10.1186/ar1873
Qing, L. et al. "Decorin mediates cartilage matrix degeneration and fibrillation in post-traumatic osteoarthritis." Arthritis & Rheumatology, vol. 72, no. 8, 2020, pp. 1266–1277. https://doi.org/10.1002/art.41254
Denman, S.E., McSweeney, C.S. and Makkar, H.P.S. "Quantitative (real-time) PCR." In: Makkar, H.P.S. and McSweeney, C.S. (eds.), Methods in Gut Microbial Ecology for Ruminants. Springer. https://doi.org/10.1007/1-4020-3791-0_8
Soulhat, J., Buschmann, M.D. and Shirazi, A.A. "A fibril-network-reinforced biphasic model of cartilage in unconfined compression." Journal of Biomechanical Engineering, vol. 121, no. 3, 1999, pp. 340–347. https://doi.org/10.1115/1.2798330
Laurel, N. et al. "Individual cartilage aggrecan macromolecules and their constituent glycosaminoglycans visualized via atomic force microscopy." Journal of Structural Biology, vol. 143, no. 3, 2003, pp. 242–257. https://doi.org/10.1016/j.jsb.2003.08.006
Recommended Articles
Research Article
Histopathological Spectrum of Endometrial Biopsies in Abnormal Uterine Bleeding in Mosul City Iraq
Farah Talal Abdulraheem
Published: 30/06/2026
Download PDF
Research Article
A Study on the Levels for mRNA Gene Expression of NF-κB and miR-34a Genes in Human Patients with Breast Cancer: An Indication for Resistance to Chemotherapy
Najlaa O.H. Aljubury,
Salim Hussein Jari
Published: 15/12/2023
Download PDF
Research Article
Molecular Study to Detect Some Virulence Factors in Methicillin – Resistance Staphlococcus Aureus Isolated from Eye Infections in Wasit Province
Nofel Hossin Amhi Alshammari,
Haider Kareem Jassem
Published: 15/12/2023
Download PDF
Research Article
Occurrence of Multi-Drug Resistance of E. coli Isolated from Urinary Tract Infection in Najaf City
Alaa Hamza Jaber Al-Jelehawy,
...
Haneen Ali Kadham
Published: 05/10/2025
Download PDF
PO Box 101, Nakuru
Kenya.
Email: office@iarconsortium.org
Editorial Office:
J.L Bhavan, Near Radison Blu Hotel,
Jalukbari, Guwahati-India
Younus, S. A., M. A., Z. & None, H. (2026). Evaluation of Decorin (DCN) Gene Expression as a Potential Biomarker in Patients with Severe Knee Osteoarthritis: A Pilot Study. Scientific Research Journal of Medical Sciences, 6(1), 1-8.
MLA
Younus, Sarah A., Zahraa M. A. and Hamodatc . "Evaluation of Decorin (DCN) Gene Expression as a Potential Biomarker in Patients with Severe Knee Osteoarthritis: A Pilot Study." Scientific Research Journal of Medical Sciences 6.1 (2026): 1-8.
Chicago
Younus, Sarah A., Zahraa M. A. and Hamodatc . "Evaluation of Decorin (DCN) Gene Expression as a Potential Biomarker in Patients with Severe Knee Osteoarthritis: A Pilot Study." Scientific Research Journal of Medical Sciences 6, no. 1 (2026): 1-8.
Harvard
Younus, S. A., M. A., Z. and None, H. (2026) 'Evaluation of Decorin (DCN) Gene Expression as a Potential Biomarker in Patients with Severe Knee Osteoarthritis: A Pilot Study' Scientific Research Journal of Medical Sciences 6(1), pp. 1-8.
Vancouver
Younus SA, M. A. Z, Hamodatc H. Evaluation of Decorin (DCN) Gene Expression as a Potential Biomarker in Patients with Severe Knee Osteoarthritis: A Pilot Study. Scientific Research Journal of Medical Sciences. 2026 Jan;6(1):1-8.



 Download PDF
 Download XML