Data compression is the process of encoding information using fewer bits than the original representation. The main idea of compression is to eliminate the redundancy in the original representation. Data Compression technique is devided into two namely: lossy compression and lossless compression. This paper is studying lossy image compression based on three transformations: Curvelet, Wavelet and Contourlet of grayscale images. In this research, a comparison is presented for the digital image compression among three transformations by converting a color digital image of size 512*512 to a gray scale digital image then decomposing it to its coefficients at various levels, then reconstructing the image after neglecting the effect of some of its high frequencies to evaluate how much the compressed image is closed to the original image. Practical results clarify that Curvelet Transform is better than Wavelet while Contourlet is much better in image compression. Evaluation metrices are: Correlation, MSE, PSNR and CR. The numerical results have been achieved using MATLAB software.
Keywords
Wavelet Transform
Curevlet Transform
Contourlet Transform
Correlation
Peak Signal to Noise Ratio
Mean Square Error and Compression Ratio
INTRODUCTION
Data compression is important in many applications, such as the transfer of information through the digital communications network, as well as its importance in reducing the storage space in the memory which used to store that data, and its importance in the optimal use lies in the capabilities and resources available by reducing the cost, which leads to reducing the transfer time[1]. Images without compression can take very large space of memory. Also, it can take more time to move from one device to another [2].
In the field of image processing, the unique properties of the image curve can be accurately represented by a minimum number of evaluated coefficients. After that, the image is analyzed using transforms and most of the image information is concentrated in the coefficients. The energy is also more concentrated as a result of analyzing the important properties of the image such as edge and composition [3].
Performance Evaluation Metrics
A lot of metrics are available to evaluate the performance of the proposed ideas in this paper. This research focuses in the following parameters:
Correlation = corr2 (A,B) shows how close the original image (A) and the compressed image (B) are. When correlation is 1, this means that there is no difference between A and B. Correlation can be calculated by the equation (1) [1-4]:
Where m: row number, n: column number and A!, B! are averages of the values in (A) and (B) consecutively.
MSE: Mean Square Error calculates error ratio between the original grayscale image (A) and the compressed image (B). Small amount of MSE reduces the error and gives good quality image, equation 2 shows the evaluation [2-4]:
where M and N represent the number of rows and columns in the input image, respectively. A: Original image; B: Compressed image.
PSNR: Peak Signal to Noise Ratio is a measure of the peak error between the original and the compressed image. Large value of PSNR means a good quality of compressed image retrieval. It can be easily found using MSE. equation (3) shows the evaluation [1-4].
where R is the maximum value for the gray gradation in data image which almost equal to 255.
CR: Compression Ratio determines ratio of compression between the file source image and the file compressed image by equation 4 [5]:
Related Works
Abbas and Hind presented a study hybrid comparison between Wavelet filters to compress 7 samples of colored images. The study depended on 11 filters. The experimental results showed that the best filters were Daubechi's family [6].
G. Younes suggested a method for gray image compression using Karhunen-Loève Transform (KLT), by selecting the no. of eigen values and eigen vectors that can reconstruct the image which in result was very near to the original image by evaluating PSNR, MSE, correlation and compression ratio parameters [1].
N. Al-Shereefi suggested a method for obtaining a high compression ratio for images using a two-dimensional -daubechies Wavelet Transform and applying a comprehensive threshold function to all Wavelet Transform coefficients using different levels. The method achieved the desired results in terms of image quality while preserving the important details of the image [7].
Li et al. presented a novel scheme based on Curvelet Transform aimed to achieve a high compression ratio. The scheme embedded Machine Learning Method and Core Vector Machine (CVM). The researchers utilize the features of CVM to reduce large numbers of Curvelet coefficients. This scheme proved its performance in compression compared with other algorithms do not use CMV in PSNR and CPU time [8].
Kamlesh and Ranu presented an image compression algorithm using Discrete Curvelet transform by analyzing the source image into Curvelet coefficients depending on different scales with the help of the cutoff threshold value. Where an algorithm ignored the effect of the block at high compression rates. Practical results showed that the performance of the compression of that method gives good results based on PSNR, MSE and memory size [9].
P. Sudha and G. Elatharasan suggested a method that gives a description for image compression based on DCT (Discrete Cosine Transform), DWT (Discrete Wavelet Transform) and Contourlet Transform. Best results for performance have been obtained by evaluating CR, PSNR and MSE parameters [10].
S. Al-Samawal and I. Raneem improved the compression ratio of images based on Discrete Wavelet Transform using a reference stereoscopic image pair. The best compression ratio was achieved with mother wavelet (bior3.1) when used with (SPIHT) while the mother wavelet (db7) achieved the best quality of the reconstructed image [11].
A new method has been developed by L. Inour et. al. to compress grayscale images, especially those rich in edge information. It is based on the linkage between Haar Wavelet Transform, Curvelet transform and Set Partitioning In Hierarchical Trees (SPIHT) encoding. The results proved that the proposed algorithm provides a higher performance for edge detection compared to other techniques, and it proved to be robust at the computation time of, and there is an improvement in the compression ratio and PSNR [12].
M. AbhiRoop and Dr. I. Kullayamma presented an algorithm based on Contourlet Wavelet Transform (CWT). Experimental results gave better performance and valid and accurate results compared with H246 and Singular Value Decomposition (SVD) compression methods by evaluating Compression Ratio (CR) [13].
Z. Al-Rawi et al. proposed a method to compress several images at size 512*512 based on Contourlet transform by decomposing images at level 2 and then reconstructing coefficients smaller than threshold. The simulation results proved that the reconstructed images retain their quality. Also, the algorithm is implemented on the Wavelet transform. It can be found that Contourlet transform is more powerful than Wavelet transform [4].
Image Transformation
Image transformations are so useful to used to represent the digital image in different form to give hidden information in addition to other purpose. Some of these transformation are given below:
Wavelet Transform
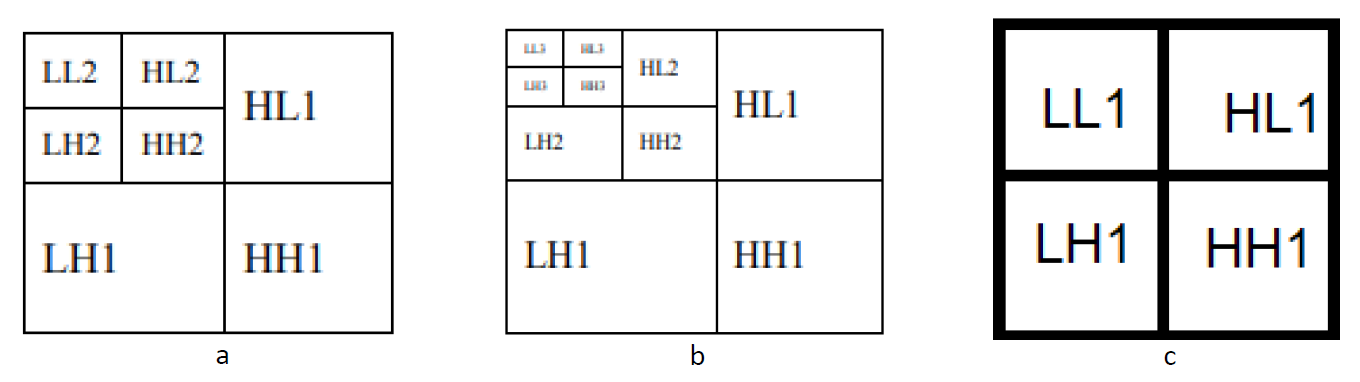
In Haar Wavelet Transform, the image is decomposed at level 1 into an approximation information and detail information. An approximation information (LL: low low) which is a coarser version of the original image carries low frequencies, while detail information carries high frequencies represented by LH: low high, HL: high low and HH: high high as seen in Figure 1.
Curvelet Transform
In 1999 Candes introduced a new multi scale geometric transform-Curvelet transform. Curvelet transform is one which represent the sparse representation of images, especially for the edges with competent handling of curve singularities. Comparing Curvelet and conventional Wavelet transform, the former is the best. In the wavelet transform there is an inability to represent edge discontinuity along the curves. So, the Wavelet domain needs large number of coefficients to represent the curves. Edges and other singularities along the Curvelet are represented much more efficient compared to other transform and this property belongs to its high anisotropy and multi resolution. to represent the edge of an image, Curvelet requires only 1/√N coefficients [14].
Figure 1: Decomposing the image by Wavelet Transform at: (a) level 1; (b) level 2; (c) level 3
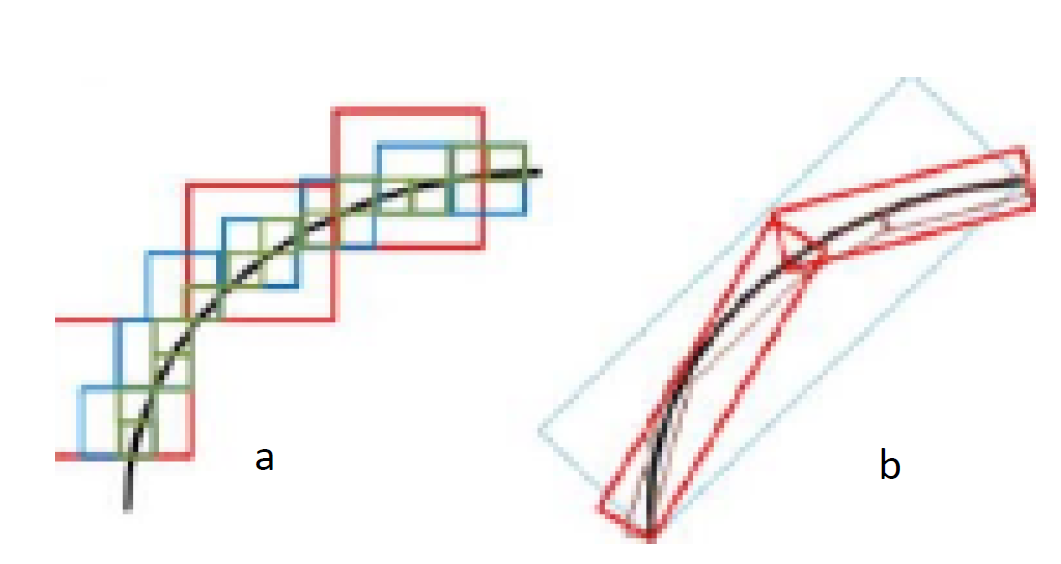
Figure 2: (a) Wavelet (b) Contourlet
Contourlet Transform
The other transformation, Contourlet, which is an efficient multiresolution and directional transformation, is based on an efficient two-dimensional multiscale and directional filter bank. It was developed by Do and Vetterli, which can be applied on images with smooth edges for effective outcome. Contourlet transforms not only possess the properties of wavelet (multiscale and Time-frequency localization), but also supply a high degree of anisotropy and directionality, as in Figure (2). What distinguishes this transform from the rest is that through the Contourlet, a number of flexible and different directions can be obtained at each level. In addition, it is a new real 2D transformation that allows the formulation of all visual coefficients, scale, space and direction [4].
This research is presented to compress the digital image by decomposing the image at different levels and different sizes using Wavelet, Curvelet and Contourlet transforms, and dropping some of its high frequency coefficients and then reconstructing the image. By calculating Correlation, MSE and PSNR metrics of the original image and the compressed image to show the robustness and performance of three transforms in field of compression by applying a comparison among three transforms.
The following steps describe the practical part of this research:
Step1: Acquiring the image and then rescaling it to a square matrix
Step2: Converting it into grayscale image
After that, the grayscale image is passed to three phases of transforms that are:
First Phase
Applying Haar Wavelet Transform by Adopting MATLAB 2013a (64-bit) software in the Following Steps
Decomposing the input image using Haar Wavelet Transform to its coefficients at levels: 1, 2 and 3 which achieved by (wavedec2) function in Wavelet Toolbox
Compressing the image by neglecting some of its high frequency coefficients (HH: High_High) coefficients
Reconstructing the image after zeroing HH coefficients using (waverec2) function
Calculating Correlation, MSE, PSNR and CR metrics between the source image and the compressed image
Second Phase
Curvelet Transform is applied using the Same MATLAB Software as Follow
Decomposing the input image using (fdct_wrapping) function in Curvelet Toolbox to its coefficients at scales: 2, 3 and 4 that used 8 angles
Also, Compressing the image by dropping some of its high frequency coefficients
Reconstructing the image after compressing the image using (ifdct_wrapping) function
Calculating Correlation, MSE, PSNR and CR parameters between the source image and the compressed image
By analyzing the same image by Curvelet Transform at level 2 using 8 angles, C: the cell array expressing Curvelet coefficients consists of <1*1 cell><1*8 cell>. The first cell represents low frequency coefficients. The second carries high frequency coefficients, some of these high coefficients are neglected, let be: C{1,2}{1,1}; C{1,2}{1,3}; C{1,2}{1,7}; and C{1,2}{1,8};
Third Phase
In this Phase, Contourlet Transform that Is Used Via the Same MATLAB Software by These Steps
Decomposing the input image using (nsctdec) function in Contourlet Toolbox to its coefficients at levels: 1, 2 and 3 and using ‘dmaxflat7’ as a directional filter and ‘maxflat’ as a pyramidal filter
Compressing the image by dropping some of its high frequency coefficients
Reconstructing the image after compressing the image using (nsctrec) function
Calculating Correlation, MSE, PSNR and CR metrics between the source image and the compressed image
Simulated Results and Discussion
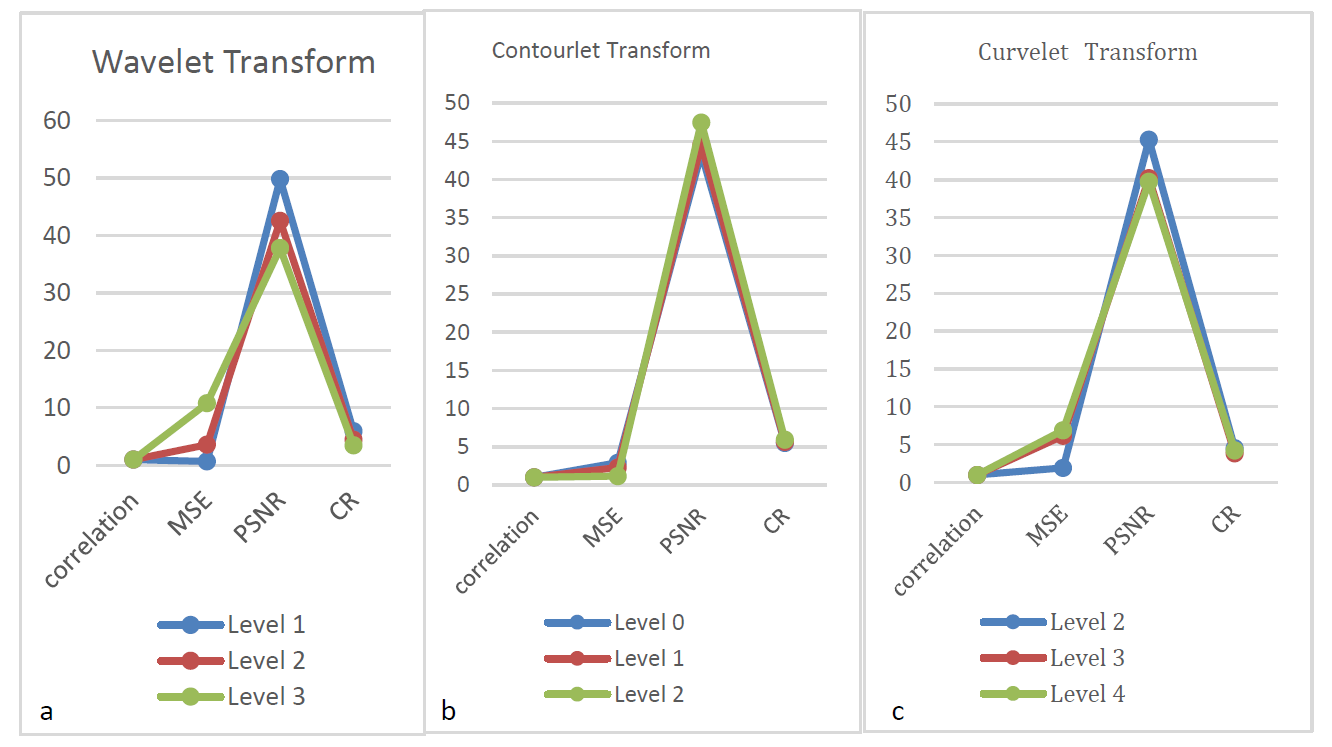
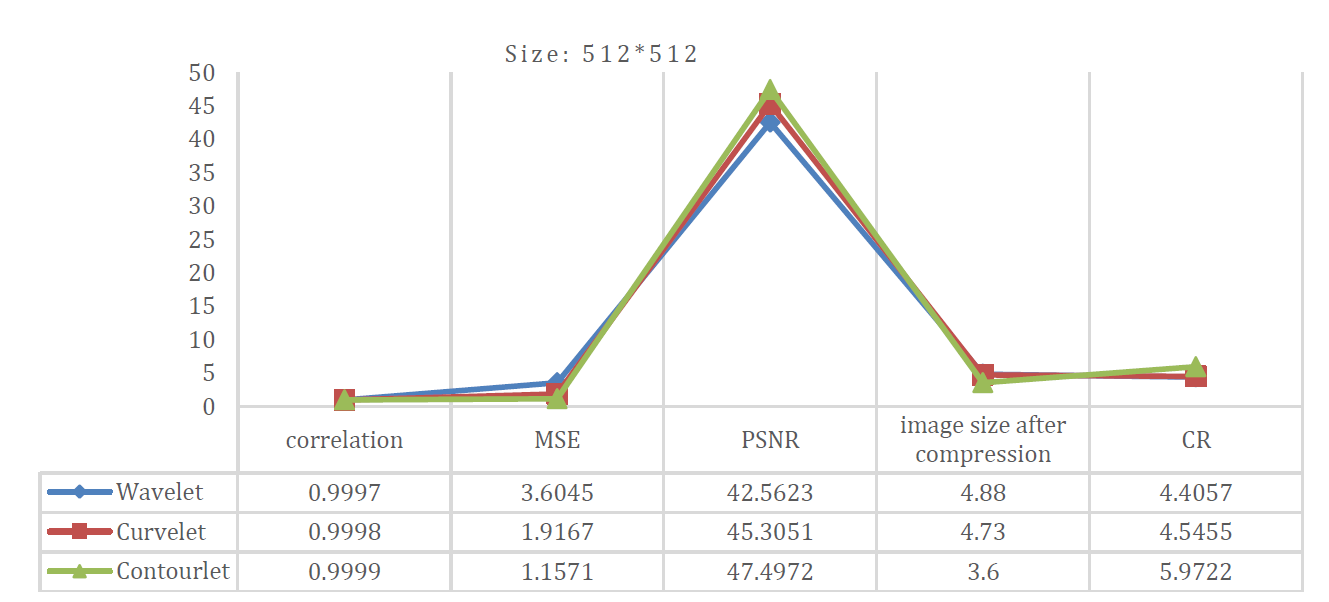
The proposed algorithm is evaluated on a standard image “monaliza.jpg” at size: 512* 512. These results are obtained by applying the system with its three transforms on the selected image. But to detail and understand the differences relying on the level at times and the size at times and according to the transform at other times, the results were distributed using charts. The results of MSE, PSNR and Correlation metrics of monaliza image at size: 512* 512 are listed in Table (1).
As seen from the inverse relation between the MSE and PSNR, a lower value of MSE means lesser error and this translates to a high value of PSNR. Logically, a higher value of PSNR is good because it means that the ratio of Signal to Noise is higher. Here, the 'signal' is the original image, and the 'noise' is the error in reconstruction. So, a compression scheme having a lower MSE (and a high PSNR), can be recognized as a better one. The greater the value of PSNR, the less distortion and closer to the original image. Figure (3).
It can be observed that the Correlation values decrease by small percentages between the original and compressed image by increasing the level of analysis by Wavelet and Curvelet transforms, while there is a slight increase in the Correlation values with Contourlet transform. By Curvelet Transform, MSE records low value. This value is increasing gradually by increasing level number (3,4). On the opposite manner, PSNR records high value and correlation which are decreasing by increasing level number. The same manner is followed at Wavelet Transform.
At Contourlet Transform, CR and PSNR increase, while MSE decreases by increasing the level of analysis.
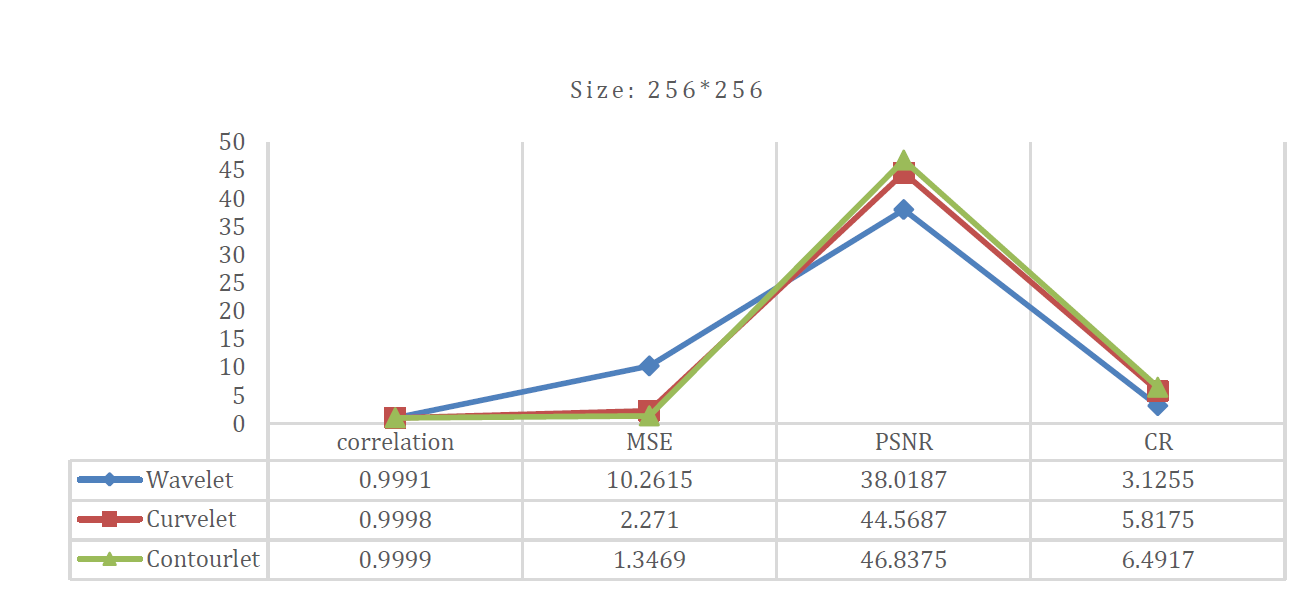
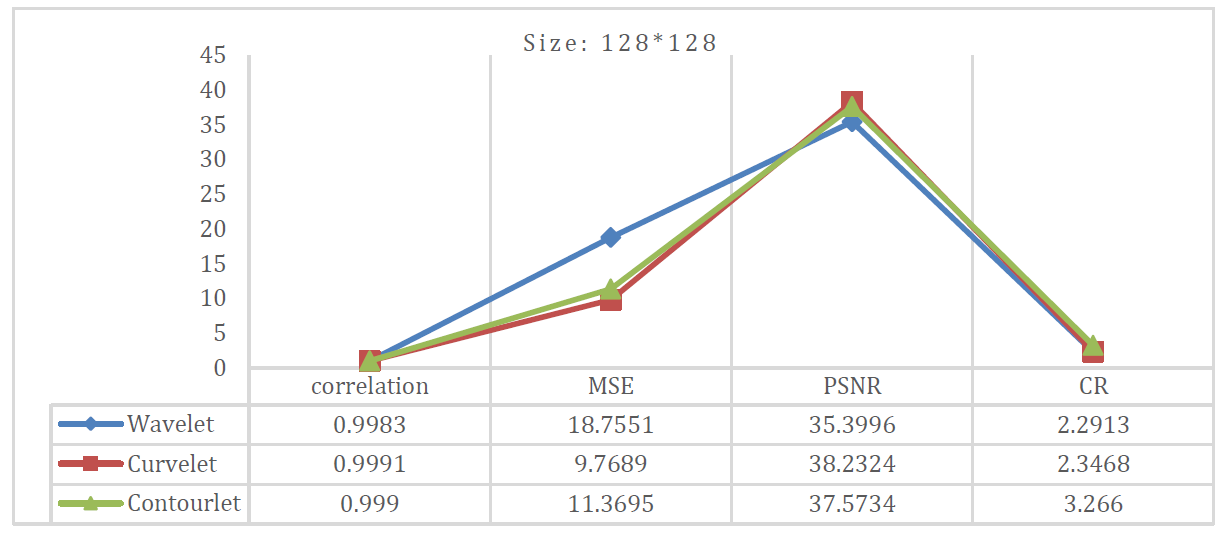
The system is applied to different size of monaliza image and the stability of the system was achieved by performance measures. Figure [4-5] show these results on the image of size: 256*256 and 128*128 respectively.
PSNR and CR. The best results are recorded with Contourlet transform: high values of Correlation, PSNR and CR with low values of MSE Table 2-3.
Table 1: Performance Metrics of Monaliza Image Of Size: 512*512 by Wavelet, Curvelet and Contourlet Transforms at Different Levels
Parameter metrics for Monaliza image of dimensions: 512*512 and memory size 21.5 KB
Correlation
MSE
PSNR
Memory size after compression in KB
CR
Wavelet Transform
Level 1
0.9999
0.6769
49.8255
3.63
5.9229
Level 2
0.9997
3.6045
42.5623
4.88
4.4057
Level 3
0.9990
10.7905
37.8004
6.17
3.4846
Curvelet Transform
Level 2
0.9998
1.9167
45.3051
4.73
4.5455
Level 3
0.9995
6.1690
40.2287
5.61
3.8324
Level 4
0.9994
6.9227
39.7281
5.05
4.2574
Contourlet Transform
Level 0
0.9997
2.9479
43.4356
3.91
5.4987
Level 1
0.9998
2.2946
44.5238
3.79
5.6728
Level 2
0.9999
1.1571
47.4972
3.60
5.9722
Figure 3: Performance Metrics of Monaliza Image of Size 512*512 at Levels 1, 2, 3 by: (a) Wavelet, (b): Curvelet, (c) Contourlet
Figure 4: Performance Metrics of Monaliza Image of Size 512*512 by Wavelet, Curvelet, Contourlet Transforms at level: 2
Figure 5: Performance Metrics of Monaliza Image of Size 256*256 by Wavelet, Curvelet, Contourlet Transforms at Level: 2
Table 2: Performance Metrics of Monaliza Image of Size: 256*256 by Wavelet, Curvelet and Contourlet Transforms at Different Levels
Parameter metrics for Monaliza image of dimensions: 256*256 and image file size 7.97 KB
Parameters
Correlation
MSE
PSNR
Memory size after compression in KB
CR
Wavelet Transform
Level 1
0.9998
2.7055
43.8083
1.64
4.8598
Level 2
0.9991
10.2615
38.0187
2.55
3.1255
Level 3
0.9980
21.9677
34.7130
2.83
2.8163
Curvelet Transform
Level 2
0.9998
2.2710
44.5687
1.37
5.8175
Level 3
0.9997
3.4921
42.7000
1.58
5.0443
Level 4
0.9991
9.4787
38.3633
1.85
4.3081
Contourlet Transform
Level 0
0.9988
13.4092
36.8568
1.69
4.7160
Level 1
0.9997
2.9878
43.3773
1.36
5.7279
Level 2
0.9999
1.3469
46.8375
1.20
6.4917
Table 3: Performance Metrics of Monaliza Image of Size: 128*128 by Wavelet, Curvelet and Contourlet Transforms At Different Levels
Parameter metrics for Monaliza image of dimensions: 128*128 and image file size 2.91 KB
Parameters
Correlation
MSE
PSNR
Memory size after compression in KB
CR
Wavelet Transform
Level 1
0.9994
6.4201
40.0554
0.9805
2.9679
Level 2
0.9983
18.7551
35.3996
1.27
2.2913
Level 3
0.9961
42.7306
31.8234
1.73
1.6821
Curvelet Transform
Level 2
0.9991
9.7689
38.2324
1.24
2.3468
Level 3
0.9992
8.2837
38.9486
0.8623
3.3747
Level 4
0.9986
16.0280
36.0820
1.17
2.4872
Contourlet Transform
Level 0
0.9974
29.1313
33.4872
1.06
2.7453
Level 1
0.9982
20.2473
35.0671
0.936
3.1090
Level 2
0.9990
11.3695
37.5734
0.891
3.2660
By compressing monaliza image at level 2 by Wavelet Transform, Results records high correlation to the original image and a proportional high MSE. Correlation becomes closer to 1 by Curvelet and MSE decreases with increasing in PSNR and CR. The best results are recorded with Contourlet transform: high values of Correlation, PSNR and CR with low values of MSE Table 2-3.
Figure 6: Performance Metrics of Monaliza Image of Size 128*128 by Wavelet, Curvelet and Contourlet Transforms at level: 2
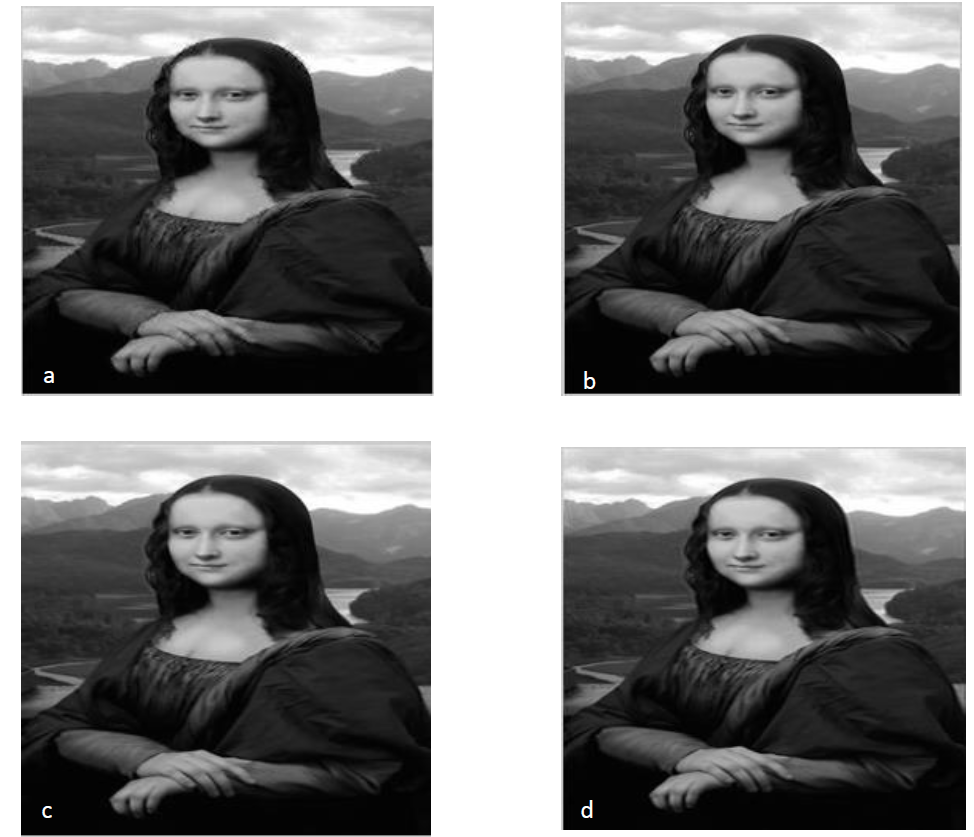
Figure 7: Monaliza Image with Dimension 256*256 with its Compressed Images at Level 2: (a) Original Image, (b) Compressed Image by Wavelet Transform, (c) Compressed Image by Curvelet Transform, (d) Compressed IPmage by Contourlet Transform
CONCLUSION
In this paper, a study for gray scale image compression is proposed. The suggested approach is based on dropping some of its high frequency coefficients after decomposing it by three different transformation: Wavelet, Curvelet and Contourlet Transforms.
The results show that image compression using Curvelet transform produces better performance for Correlation, MSE, PSNR and CR metrics over the Wavelet Transform. While Contourlet Transform is the better over the other two transforms.
In addition, the system gives good results of Correlation, MSE, PSNR and CR while decomposing at low levels than those of high levels over all three transforms.
REFERENCE
Younes, G. Digital image compression using Karhunen–Loeve transform. Al-Rafidaen Journal for Computer Science and Mathematics, vol. 10, no. 3, 2013.
Parmar, C. and K. Panchol. A review on image compression techniques. Journal of Information, Knowledge and Research in Electrical Engineering, vol. 2, no. 2, 2013.
Zhang, H. et al.An image fusion method based on curvelet transform and guided filter enhancement. Mathematical Problems in Engineering, 2020.
Al-Rawi, Z. et al.Image compression using contourlet transform. 1st Annual International Conference on Information and Sciences (AiCIS), 2018.
Ramo, F. and Y. Al-Deen. Compress digital image based on genetic meta-heuristic algorithm. Al-Rafidaen Journal for Computer & Mathematics Sciences, vol. 10, no. 2, 2013.
Abbas and Hind Khudayr. Comparison of wavelet transform filters using image compression. Ibn al-Haitham Journal for Pure and Applied Science, vol. 25, no. 1, 2012.
Al-Shereefi, N. Image compression using wavelet transform. Journal of Babylon University/Pure and Applied Sciences, vol. 21, no. 4, 2013.
Li, Y. et al.Curvelet based image compression via core vector machine. Optik, vol. 124, 2013, pp. 4859–4866.
Kamlesh, G. and G. Ranu. Novel approach for image compression using curvelet transform. International Journal of Signal Processing, Image Processing and Pattern Recognition, vol. 8, no. 7, 2015, pp. 199–212.
Sudha, P. and G. Elatharasan. A review of image compression based on transform coding. American-Eurasian Network for Scientific Information, vol. 11, no. 8, 2017.
Al-Samawal, S. and I. Raneem. Improving stereoscopic images compression ratio using discrete wavelet transform. Tartous University Journal for Research and Scientific Studies-Engineering Sciences Series, vol. 2, no. 2, 2018.
Inouri, L. et al.A fast and efficient approach for image compression using curvelet transform. Sensing and Imaging, vol. 19, 2018, p. 26, https://doi.org/10.10 07/s11220-018-0212-0.
Mule, A. and I. Kullayamma. Image compression using contourlet wavelet transform (CWT). International Journal of Scientific Research in Science and Technology (IJSRST), vol. 4, no. 7, 2018.
Parmar, C.K. Image compression based on curvelet transform. International Journal of Engineering Research and Technology (IJERT), vol. 2, no. 4, 2013.
Recommended Articles
Research Article
Paleoenvironmental Assessment of the Anah Formation (Upper Oligocene) from the Ostracod Morphological Adaptations and Bio-Distribution
Esraa N. Al-Taee,
Nisreen M. Aziz
Published: 19/09/2026
Download PDF
Research Article
The Effect of the TASC Model on Visual Reaction and Teaching the Speed of Defensive Movements in Futsal among Fourth-s Students
Hayder Majeed Shwayyea
Published: 27/09/2026
Download PDF
Research Article
The Impact of Digital Transformation on Enhancing Administrative Performance in Sports Institutions: A Field Study in the Directorates of Youth and Sports
Omar Salman Abd
Published: 07/10/2026
Download PDF
Research Article
The Effect of Proposed (Auditory-Skill) Exercises on Reflex Reaction Speed and Their Relationship to the Performance of Court Defense Skills (Side Roll - Forward Dive) for Advanced Volleyball Liberos
Mohammed Obaid Jameel,
Ghazwan Mohand Askandr
Published: 05/10/2026
Download PDF
PO Box 101, Nakuru
Kenya.
Email: office@iarconsortium.org
Editorial Office:
J.L Bhavan, Near Radison Blu Hotel,
Jalukbari, Guwahati-India
Qassab_Bashi, H. S. (2023). Image Transformations Comparison based on Digital Image Compression. Scientific Research Journal of Multidisciplinary, 3(2), 1-7.
MLA
Qassab_Bashi, Huda S.. "Image Transformations Comparison based on Digital Image Compression." Scientific Research Journal of Multidisciplinary 3.2 (2023): 1-7.
Chicago
Qassab_Bashi, Huda S.. "Image Transformations Comparison based on Digital Image Compression." Scientific Research Journal of Multidisciplinary 3, no. 2 (2023): 1-7.
Harvard
Qassab_Bashi, H. S. (2023) 'Image Transformations Comparison based on Digital Image Compression' Scientific Research Journal of Multidisciplinary 3(2), pp. 1-7.
Vancouver
Qassab_Bashi HS. Image Transformations Comparison based on Digital Image Compression. Scientific Research Journal of Multidisciplinary. 2023 Jul;3(2):1-7.



 Download PDF
 Download XML