Measuring the risk of the market using (VaR) and its impact on the performance of the growth and Value portfolio an analytical study in the Amman Stock Exchange
Doaa Noman Al-Husseini
1
,
Azeez Moso Khudeeda
1
1
College of Administration and Economics, University of Mosul, Mosul, Iraq
The primary objective of this study was to investigate market vulnerabilities while evaluating the performance of growth and value portfolios within the Amman Stock Exchange during the period from 2020 to 2022. Monthly data from 32 companies were analyzed using the Value at Risk (VaR) model to assess index risks. To differentiate between growth and value stocks, the study relied on the price-earnings ratio index. The value-at-risk index (J.P. Morgan) was employed to quantify market risk using established methodologies. The study found that the profitability multiplier index during the study period did not meet desired benchmarks. Additionally, statistical analysis revealed a noticeable impact of index risk on the performance of both value and growth portfolios. Interestingly, an inverse correlation emerged between the risk index calculated through value at risk and the performance exhibited by the portfolios in the study sample. This study concludes by emphasizing the importance for investors to understand the inherent market risks associated with investment portfolios. Furthermore, it underscores the significance of evaluating market risk through the value at risk methodology due to its superior accuracy compared to traditional measurement indicators.
Keywords
Market Risks
Growth and Value Portfolios
Profit Multiples
Value at Risk
INTRODUCTION
Portfolio formation is one of the important issues in the field of financial management because it is a financial matter of protecting investors from market risks. It is characterized by constant volatility, influenced by instability in political and economic factors. They mean a lot to the market in general and to investors in particular. Investors generally need to invest in financial instruments (stocks) that are expected to provide the highest returns with the lowest risk to protect their funds and investments from unwanted volatility in the financial markets. The investor's goal is to build an efficient portfolio that achieves the best return with the lowest risk. When investing in a particular financial instrument (stock), investors may have difficulty selecting stocks that are expected to generate future returns. Because stocks have different classifications. Financial analysts and economists use P/E indices to evaluate growth stocks and value stocks. This indicator shows that stock prices change according to market conditions (efficient and ineffective). All of this drives investor to choose stocks based on efficient portfolios and different strategies to build portfolios that can generate superior returns. For an investor to be able to manage this portfolio, it needs to have sound experience in the field and use scientific methods to formulate, control, evaluate and identify the expected risks to which it is exposed. Value at Risk (VaR). It represents the maximum loss that a financial asset portfolio may face at a given level of certainty within a given period. Therefore, this study seeks to understand the relationship between market risk as measured by VaR and its impact on growth and value portfolio performance on the Amman Stock Exchange. Help individual investors or companies understand and implement different investment strategies to obtain better returns and diversified financial asset portfolios. The study is divided into several parts. The first part includes approved methods and the second part focuses on previous research. Part Three looks at market risk and Part Four looks at the nature of growth stocks and value. Section V explores the VaR (value-at-risk)-based link between market risk and growth and value portfolio performance. Finally, Section VI is devoted to the standards framework. Some conclusions and recommendations were drawn from the investigation.
RESEARCH METHODOLOGY
Research Problem
Due to the spread of the COVID-19 pandemic during the study period, which cast its shadows on the entire financial system, especially the stock market and was accompanied by several risks, there was a call to adopt tools that generate accurate results for measuring market risks. The market and its effects on the performance of portfolios composed of tradable assets therein are summarized by the research problem in the following question: Does the market risk measured by VaR (Value at Risk) reflect on the performance of growth and value portfolios?
Research Significance
The importance of this study is evident in two dimensions. Firstly, from an academic perspective, it highlights modern methodologies in measuring market risks, specifically the value at risk. One of the important contemporary measures in modern financial thought quantifies the potential loss to an investor when investing in a specific financial instrument. The second dimension is represented by investors and their orientations in the process of investing in investment portfolios.
Research Objectives
The research aims to achieve an accurate estimation, with a certain degree of confidence, of the value that reflects the maximum loss portfolios of growth and value will endure during the study period. Additionally, it aims to determine the extent and magnitude of the impact of market risks measured by VaR (Value at Risk) on the performance of the targeted portfolios.
Research Hypothesis
Based on the preceding information, the following hypothesis can be formulated:
“Market risk measured in value at risk (VaR) has a significant impact on the performance of growth and value portfolios”
Previous Studies
In order to clearly identify the research gap, it was necessary to delve into some studies that explored certain research variables. )Ahlam( in her study, confirmed the impact of market risks on both the return and risk of shares of the International Bank for Trade and Finance in Syria for the period (2010-2020). Furthermore, the study determined the stability of the general index of the Damascus Securities Exchange during the examined period. The study revealed that the overall movement of the Damascus market during the examined period was not stable; rather, it was upward. In addition to the absence of any impact from the index's risk, as expressed by (VaR), on both the return and risk of the researched banks shares. The second study was titled 'Evaluating the Performance of Investment Portfolio According to Market Risks Using Value at Risk' [1]. This study aimed to assess the performance of two portfolios for two companies in the field of financial investment. These portfolios were compared to the performance of the Iraq Stock Exchange portfolio for the period (2013-2018) using the ISx60 market index. The study concluded with varying losses experienced by the mentioned portfolios, attributing this to the fluctuations in stock prices held within the portfolios, indicating mismanagement of the study's sample portfolios [2].
Market Risks and Their Significance in Evaluation
Market risks indicate the potential for losses resulting from adverse changes in the market price of a company due to variations in prices or fluctuations in fixed income instruments, equity instruments, commodities, currencies and off-balance sheet items. Market risks also arise from foreign exchange risks and general commodity risks. Consequently, the primary components of interest rate risks, exchange rate risks, commodity risks and currency risks each represent components of the overall market risks, in addition to other risks stemming from financial institutions [3]. Market risks refer to the overall movement in securities prices, where these prices move together due to external events. While the market experiences fluctuations in stock price movements, it is exceedingly difficult to predict the external events that will impact stock prices [4]. Market risks are characterized as being beyond the control of both investors and companies. Therefore, investors must attempt to forecast rather than prepare for them. The most effective way to mitigate the impact of these risks is long-term investing and constructing a balanced portfolio through the utilization of effective hedging strategies. Hence, market risks are classified into four types [6]: Currency exchange rate risks, interest rate volatility risks, securities price volatility risks and basic commodities price volatility risks. However, since this study focuses on the securities market, it is limited to two types of risks: stock price volatility risks. Exchange rates do not directly impact this market and as follows.
Interest Rate Risk
A change in the rate of return on financial assets due to fluctuations in interest rates, Interest rate risks refer to the fluctuation in the future market value of stocks and the expected income resulting from changes in interest rates, In the event of an increase in market interest rates, securities prices move in opposing directions for several reasons, the most important are.
The interest rate is an indicator of the discount rate used to evaluate financial assets (as the discount rate increases, the price of the financial asset decreases).
With an increase in the supply of financial assets, their price will decrease as investors will be more willing to sell these assets and hold onto them as low-risk bank deposits
An increase in interest rates leads to higher capital costs for companies, which in turn reduces corporate profits and results in a decrease in financial asset prices.
Interest rate risks refer to the fluctuation in the future market value of stocks and the expected income resulting from changes in interest rates. As for risk-free securities, the cost of money for companies issuing stocks and bonds moves in the same direction [6]
The Risk of Equity Instruments(The Risk of Securities Price)
Equity risks refer to the financial risks associated with owning shares in an investment. It arises from changes in the value of stock prices. Therefore, it is a risk related to the sensitivity of the value of an instrument or portfolio to fluctuations in stock prices. Given that the stock market is fraught with risks, it faces two types of stock risks. The first is the Unique Risk, which represents the specific risks associated with the individual stocks themselves. The second is Market Risk, which allows investors to overcome unique risks by maintaining a diversified portfolio. However, this diversification does not eliminate market risks [6].
The importance of evaluating market risks becomes evident due to its role in addressing or avoiding various risks that financial markets may encounter. The significance of assessing market risks can be elucidated as follows [7]:
Performance Evaluation: Allows deriving an additional rational system by calculating risk-to-reward ratios
Resource Allocation: Comparing returns with market risks in different areas of trade or investment and identifying areas where returns are higher. Capital can generate high returns per unit of risk faced by the company's resources
Administrative Information: This information highlights the risks that traders and investors might face to senior management by comparing the risk profile with the capital resources of the financial institution
Managerial Insights: This information highlights the risks that traders and investors might face to senior management by comparing the risk profile with the capital resources of the financial institution
Regulatory: The increase in prices due to certain risks prompts regulatory bodies such as the Basel Committee and the Federal Reserve to set higher capital requirements to hedge against regulatory (market) risks
Characteristics of Growth and Value Portfolios
Concept of Securities Portfolio: A collection of financial securities owned by an individual or legal entity, encompassing transactions in securities such as common stocks and debt bonds. If they consist solely of stocks, it is referred to as a securities portfolio or if it consists primarily of bonds, then due to the fact that a portfolio could comprise both, it is termed a hybrid portfolio [8]. It is worth mentioning that an investor may choose to construct their portfolio from a diverse range of stocks, with one of these types being growth and value stocks. Growth stocks are referred to as those stocks with a low book-to-market ratio. They are characterized by high earnings growth rates and a high market yield on equity. In the realm of investment, growth stocks possess several attributes that other types of stocks may not possess [9].
Over time, the market value grows substantially and at a higher rate than other types such as income stocks. Furthermore, their price exceeds the market average for cash flows and investors of growth stocks do not anticipate short-term gains. They aim to create future value for the stocks over time by investing in companies that seek market opportunities or investments aimed at gaining maximum market share. Investors anticipate the possibility of achieving higher returns as the market value of the company increases [10]. Conversely, value stocks are more stable in their returns and exhibit less volatility. They are a suitable option for short-term gains and are preferred by conservative investors, unlike growth stocks with high profits. The reason behind investors' attraction to value stocks, which have high book-to-market ratios in the market, lies in the anticipation of adjusting their value later to reach their intrinsic value. However, before acquiring value stocks based on their reduced market value in trading, it is essential to investigate the causes of this decrease. It may be fundamental, such as a decline in the company's production or a decrease in its market share. This leads to a decline in their prices in the near future or the decrease may be due to natural factors caused by speculation or any other factors that the company can overcome [11]. This is indicated by the Price-to-Earnings (P/E) ratio, which is one of the most used indicators to distinguish between growth and value stocks and is expressed as the ratio of the stock's price to its earnings. The market's expectations for earnings growth are reflected in the dividend yield, with a low yield indicating analysts' anticipation of low growth, while a high yield suggests the company's need to achieve high profit growth. The company's management believes that a high Price-to-Earnings ratio signifies the company's financial strength [12].
The Intellectual Relationship between the Market Risk Measured by VaR and the Performance of Growth and Value Portfolios
The philosophy of Value at Risk (VaR) is based on expressing the impact of market factors on investment activities over time. Since growth portfolios are characterized by high levels of risk and price volatility, they pertain to companies that achieve rapid value growth. When market risks are high, their negative impact on the performance of growth portfolios can lead to a loss in portfolio value. On the other hand, value portfolios rely on identifying companies whose intrinsic value is lower than their market value, with their stock values being low compared to their intrinsic values. As market risks increase, it becomes challenging to find suitable investment opportunities to capitalize on value differentials, which negatively affects the returns of value portfolios. Therefore, Value at Risk (VaR) models facilitate the construction of both growth and value portfolios, enabling investors to effectively address market risks, including the risks associated with macroeconomic variables that influence the portfolio itself. Moreover, these models enable the estimation of potential losses as accurately as possible based on the actual stock positions. They also facilitate the development of suitable financial strategies when constructing portfolios [13,14].
The Measurement Framework
Description of the Study Sample: The research population represents the Amman Securities Market, while the sample includes (32) companies listed on the market across various sectors. Some companies were excluded due to frequent data gaps and data scarcity from other companies was also considered, as including them in the research sample could lead to misleading results. Monthly data for the research sample companies for the period 2020-2022 were relied upon.
Analysis of Profitability Ratios
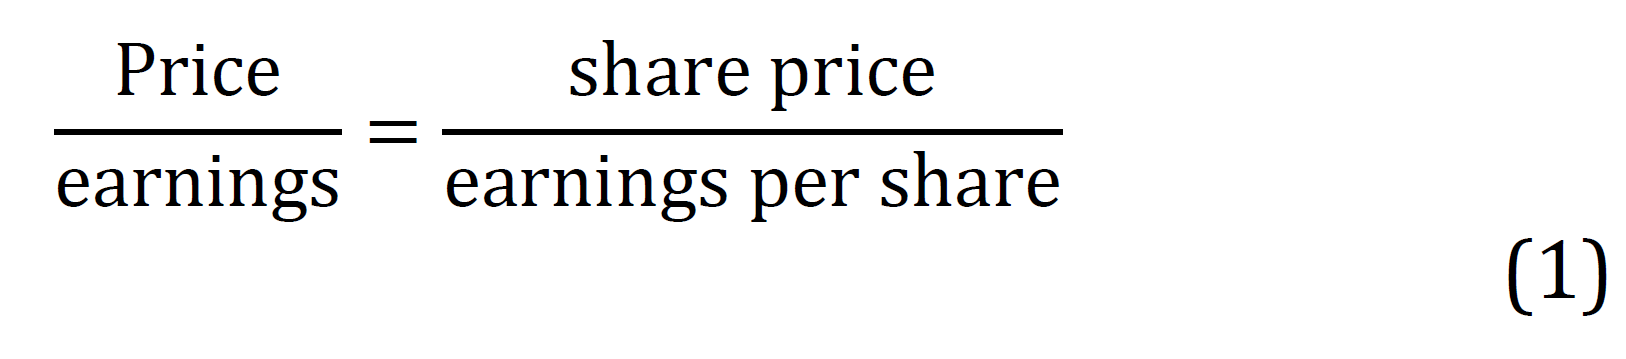
The Price-to-Earnings (P/E) ratio is calculated by dividing the closing price at the end of the financial year for the stocks listed in the Amman Securities Market within the research sample by the earnings per share for the research period (2022-2020), according to the following equation [11,15]:
Earnings Per Share (EPS) was also calculated by dividing net profit by the number of outstanding shares. These data were obtained from the year-end financial statements (balance sheet and income statement) of the research sample companies for the period (2022-2020). Additionally, the closing prices of the stocks in the research sample were obtained from the official website of the Amman Securities Market (http://www.ase.com. jo/ar/bullet). The Table 1 presents the average Price-to-Earnings ratio for the research sample companies.
The Table 1 indicates the results of calculating the average Price-to-Earnings ratios for the studied companies listed in the Amman Stock Exchange. The highest Price-to-Earnings ratio was obtained by the (Jordanian Free Markets), reaching (18.835) times. This increase in the Price-to-Earnings ratio reflects higher growth expectations in the per-share earnings anticipated by the market, along with a decrease in the required rate of return on the investment in the stock due to the decline in (market risks). This implies that these stocks are valued at more than their intrinsic value (Overpriced) and are usually referred to as Growth stocks, those stocks which exhibit above-average growth in earnings and returns during the study period. When growth expectations for per-share earnings increase, the market tends to value these stocks with higher multiples, meaning it pays a higher price compared to the earnings generated by the company.
Description of Study Variables and Utilized Indicators
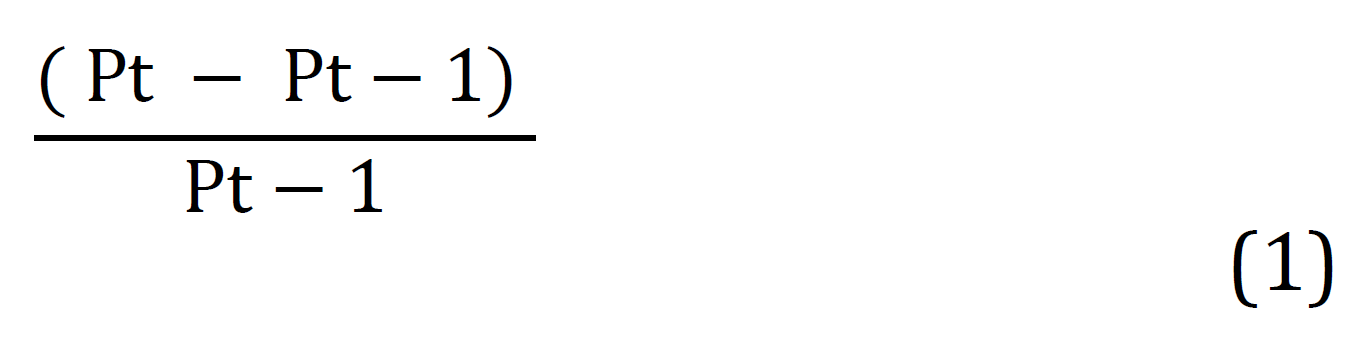
Dependent Variable (Performance of Growth and Value Portfolios): The study relies on the dependent variables, which encompass the returns and risks of the growth and value portfolios. To calculate the portfolio performance, it is imperative to compute the monthly return (Rt) of the stock and the monthly closing price (Pt) of the stock. This calculation was performed for the sample companies, totaling 32 firms, during the period (2022-2020), according to the following equation [16]:
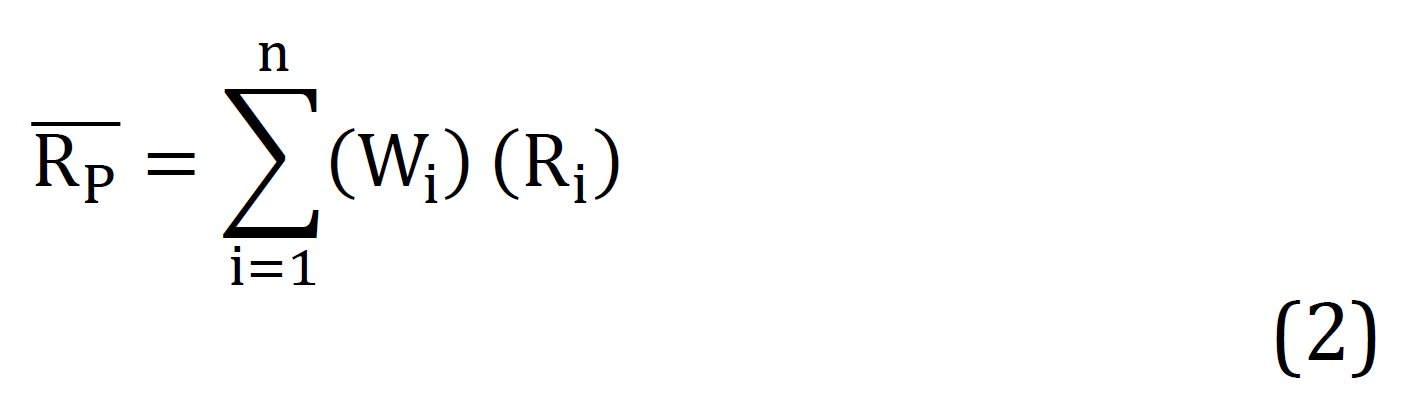
whereas, RL: Represents the monthly return of the stock, Pt: Denotes the current closing price of the stock and Pt-1: Signifies the previous closing price of the stock. Subsequently, the monthly return for the growth and value portfolios was calculated using the following equation [16]:
Table 1: The Average Price-to-Earnings Ratio for the Companies in the Study Sample During the Period (2020-2022)
T
Multiplier Earnings
T
Multiplier Earnings
T
Multiplier Earnings
Jordan Islamic Bank
0.649
investment bank
0.135
Arab International Hotels
1.346
Jordan Commercial Bank
0.624
Arab Corporation Bank
0.321
Mediterranean for tourism investments
0.054
The Housing Bank for Trade and Finance
0.336
Investment advisory group
0.506
Jordanian duty free shops
18.835
Arab Jordan Investment Bank
0.134
Zarqa for education and investment
9.082
Jordan Center for International Trade
16.085
Safwa Islamic Bank
0.659
Petra Education
0.131
Jordanian commercial facilities
0.087
Union Bank
0.363
Dar Al-Dawa for Development and Investment
6.944
Specialized in trade and investments
0.097
Jordan Ahli Bank
1.008
Al Hayat Pharmaceutical Industries
2.023
Jordan Telecom
0.378
Arab Bank
2.500
Jordanian woven factories
1.000
Jordanian insurance
1.001
Bank of Jordan
0.558
Arab for the manufacture of pesticides and veterinary medicine
0.924
East for investment projects
0.005
Jordan Money Bank
1.243
Intermediate petrochemical industries
5.726
Foundations for investment
0.001
Cairo Amman Bank
0.768
Jordanian hotels and tourism
0.159
The table: Prepared by the researcher based on computer-generated outputs
Table 2: The Components of the Value Portfolio in the Amman Stock Exchange for the Period (2020-2022)
Company
Multiplier Earnings
Company
Multiplier Earnings
Bank of Jordan
0.588
Specialized in trade and investment
0.097
Union Bank
0.363
Jordanian commercial facilities
0.087
Arab Jordan Investment Bank
0.134
East investment projects
0.005
Housing Bank
0.336
Advisory and investment group
0.506
Arab Corporation Bank
0.321
Foundations for investment
0.0017
investment bank
0.351
Jordan Telecom
0.378
Jordan Commercial Bank
0.624
The average for tourism investments
0.054
Petra Education
0.131
Jordanian hotels and tourism
0.159
Source: Compiled by the researcher using Excel software
Table 3: Components of the Growth Portfolio in the Stock Market for the Period (2020-2022)
Company
Multiplier Earnings
Company
Multiplier Earnings
Arab Bank
2.500
Jordan Center for International Trade
16.085
Jordan Money Bank
1.243
Dar Al-Dawa for Development and Investment
6.944
Jordan Ahli Bank
1.008
Al Hayat Pharmaceutical Industries
2.023
Jordan Islamic Bank
0.649
Industry pesticides and veterinary drugs
0.924
Cairo Amman Bank
0.768
Petrochemical industries
5.726
Safwa Islamic Bank
0.659
Jordanian wool factories
1.000
Jordanian insurance
1.001
Arab International Hotels
18.147
Zarqa Education
9.705
Jordanian duty free shops
50855
Source: Compiled by the researcher using Excel software
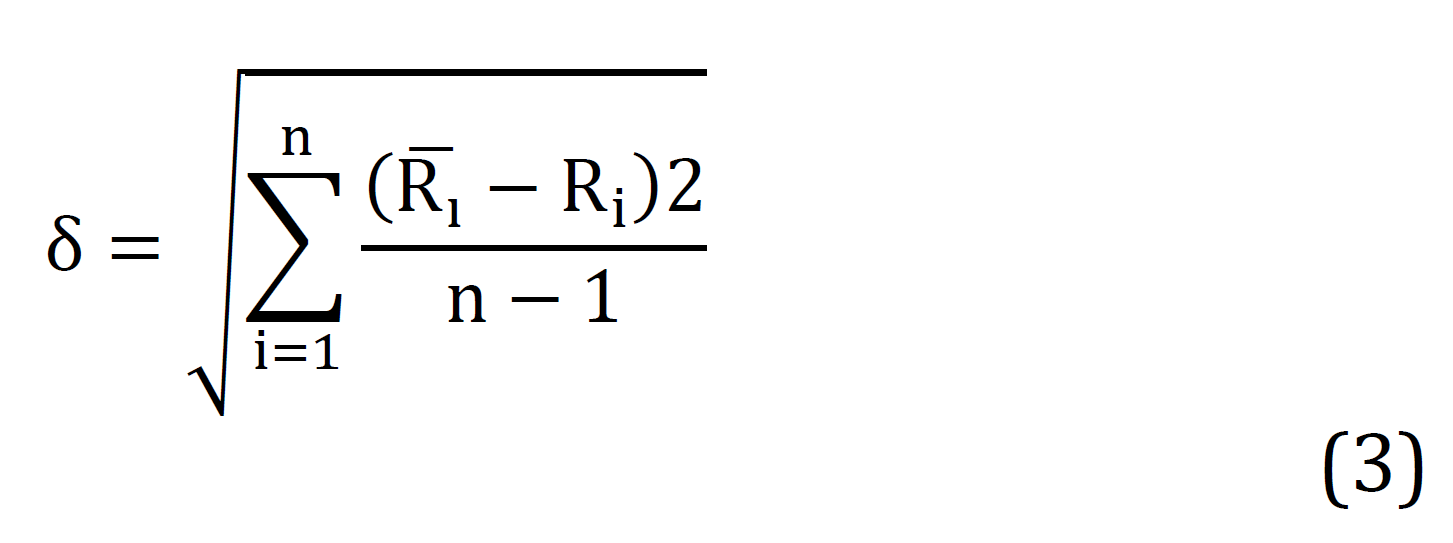
where, Rp: Represents the average monthly portfolio return, Wi: Stands for the relative weight of the stock within the portfolio and Ri: Denotes the monthly return of the stock. Additionally, the calculation of the stock risk relied on the standard deviation indicator, expressed as a measure of the dispersion among stock returns. This can be computed as follows [16]:
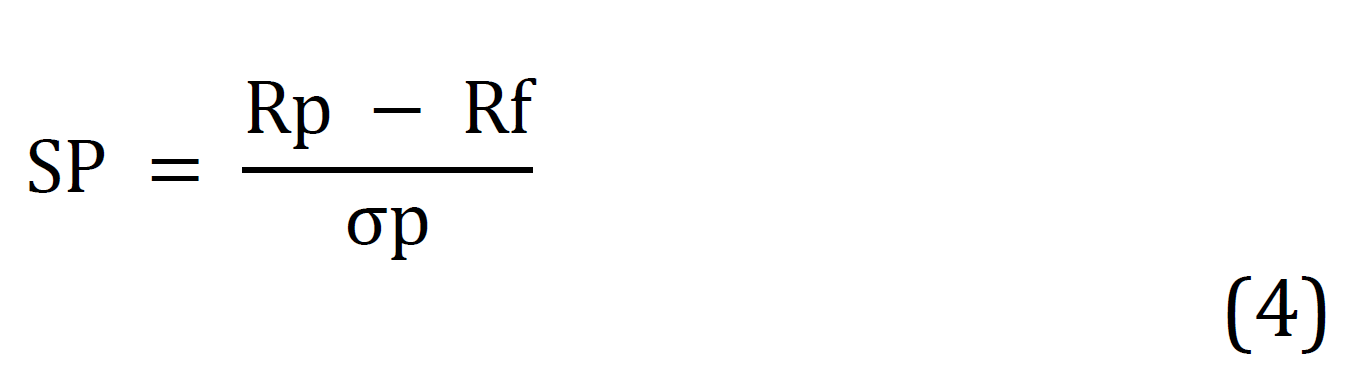
where, δ: Represents the standard deviation and n: Stands for the number of observations. The (Sharpe) ratio was utilized to measure the performance of growth and value portfolios, calculated using the following equation [17]:
where, sp: Represents the value of the reward-to-volatility ratio index, Rp: The average portfolio return, Rf: Stands for the risk-free rate of return and : Signifies the portfolio risk measured by the standard deviation.
Independent Variable (Market Risk)
Researchers rely on Value at Risk (VaR) as a modern measure of market risk volatility. Using VaR, market risk will be computed by adopting the market index as the portfolio, as well as growth and value portfolios. The historical method is one of the simplest ways to model Value at Risk (Variance-Covariance Method), developed by J.P. Morgan in the early 1990s when publishing risk metrics (Risk Metrics). This represents a standardized model with analytical techniques based on the fundamental assumption of normal distribution of returns as follows [18]:
Where, : Value at Risk for the portfolio, z: The standard deviation of the portfolio, p: The value of the portfolio: The amount invested in the portfolio and Za: Standard Value, which represents the standard deviations on the left side of the mean at a certain confidence level (cumulative normal distribution within a specific confidence interval).
Building Investment Portfolios
In order to achieve the research objectives and test the adopted hypothesis, two portfolios were constructed based on the Price-to-Earnings (P/E) ratios. The P/E ratios were calculated for each stock in the sample companies. The stocks were then ranked from lowest to highest P/E ratios, forming the Value Portfolio, which consists of 16 stocks. Additionally, a second portfolio was formed, composed of stocks from the sample companies with higher P/E ratios, named the Growth Portfolio, also consisting of 16 stocks. The average return for each stock was calculated to determine the average return of the investment portfolio. According to the portfolio theory, the total average return of the stocks with their relative weights is obtain ned. Table 2 illustrates the components of the value portfolio with lower P/E ratios, while Table 3 presents the components of the growth portfolio with higher P/E ratios.
Since the first portfolio (Value Portfolio) consists of (16) stocks distributed across market sectors, it was observed that the Financial sector with a value of (2.717) holds the largest share within the Value Portfolio sectors. The lowest percentage was represented in the Telecommunications sector, which amounted to (0.378). As for the second portfolio (Growth), consisting of (16) stocks distributed across various analyzed market sectors, the Commercial sector had the largest share, reaching (21.943). The lowest percentage was allocated to the Insurance sector due to the investment in a single company within the sector, with a value of (1.001).
Study Variables Analysis
The research relied on the monthly data of two variables: market risks (independent variable) which were measured based on the exposed value to the risk and the performance of growth and value portfolios (dependent variables) which were measured according to the Sharpe model. Table 4 presents the analysis results.
Table 4: The Results of the Analysis of Research Variables' Data for the Amman Securities Market Over the Period (2020-2022)
Date
Growth portfolio performance Y1
Growth portfolio performance Y2
(VaR) X1
January 2020
6.646154645
2.546858341
452.8957488
February 2020
6.620250677
1.997467731
544.3271621
March 2020
7.12639516
1.86115732
950.8527867
April 2020
7.41375897
1.91822452
967.2636807
May 2020
6.78338267
1.94469182
1021.866334
June 2020
5.99091645
2.10635472
1105.875119
July 2020
5.90560629
1.80756872
1147.927777
August 2020
6.26481625
1.6387818
1163.684962
September 2020
6.17086736
1.5940005
1136.320669
October 2020
5.57822068
1.59678022
1205.610807
November 2020
5.41128856
1.7220315
1164.07769
December 2020
4.94132925
1.90809044
991.5847852
January 2021
4.985931887
1.943981445
830.2212775
February 2021
4.446422093
1.874224008
744.0727339
March 2021
3.91965444
2.02958109
716.0433715
April 2021
4.25987406
2.10674234
655.3445621
May 2021
4.80949645
2.75101259
143.8356553
June 2021
4.46313766
2.33318538
309.8581213
July 2021
4.47025361
2.16453914
268.5285623
August 2021
4.68981126
1.9313958
175.3039601
September 2021
4.51966853
1.8701697
215.8787582
October 2021
3.99447897
1.91674444
392.1336759
November 2021
4.22596463
1.89031105
161.0281391
December 2021
3.51413177
1.75419027
561.4572506
January 2022
3.438425574
1.70926945
496.9754734
February 2022
3.218437397
1.559631035
815.7729713
March 2022
3.40057479
1.77860173
1613.847881
April 2022
4.12885845
1.76681424
1926.257894
May 2022
4.54088034
1.5747391
1943.727476
June 2022
4.454736057
1.55599719
2624.039485
July 2022
4.00534377
1.58576398
2304.62346
August 2022
4.13177016
1.58821962
1981.638688
September 2022
4.28509207
1.35916093
1776.447668
October 2022
4.2953716
1.31014103
2028.033861
November 2022
4.33657265
1.57322331
2071.887393
December 2022
4.18687823
1.53469422
2071.88735
Source: Compiled by the researcher using Excel software
Table 5: The Impact of Market Risk According to VaR on the Performance of the Growth Portfolio
Moral value Estimated p-value
T-value estimated
Coefficient of determination (R2)
Correlation coefficient (R)
Constant
Sample
0.015
3.78
0.67
0.49
0.142
The general index of the market
N = 36
The critical T value with a degree of freedom (35,1) = 1.966
Source: Prepared by the researcher from the results of simple linear regression analysis based on data from Table 4
To test the research hypothesis, it was evident from Table 5 that the effect of market risk on the performance of the growth portfolio was revealed. The coefficient of determination (R2 = 0.67) was attained, which can be considered as a substantially explanatory value for the independent variable in the dependent variable. The estimated significance value of the simple linear regression equation (0.015) was lower than the assumed significance level of the study (0.05), affirming the influence of market risk according to VaR on the performance of the growth portfolio. This signifies that investors who prefer to invest in a risk-seeking, growth-oriented portfolio, in pursuit of achieving high returns by investing in stocks of rapidly and highly growing companies, notwithstanding the possibility of incurring losses due to market risk.
Table 6 illustrates the impact of market risk measured by the exposed value to risk on the performance of value portfolios in the Amman Securities Market during the period from (2020-2022).
Through Table 6, it becomes evident that the impact of market general index risks on the performance of the value portfolio is demonstrated by relying on the calculated T-value, which was equal to (3.433), surpassing the tabulated value (1.966) at a degree of freedom of 35. Furthermore, the study's hypothesis can be substantiated by comparing the estimated significant value of the simple linear regression equation, which amounts to (0.013), being less than the assumed study significance level (0.05). This supports the affirmation of the effect of market risk according to VaR on the performance of the value portfolio.
Investors in value portfolios comprising stocks of companies with market values lower than their intrinsic values tend to be either risk-neutral or averse to entering risks altogether, as reflected in the elevated values of their portfolios' stocks reaching their intrinsic values in the future, while accepting a low level of risk. However, if market risks exceed the acceptable threshold in the future, these investors will be exposed to undesirable further losses.
As for Table 7 it illustrates the impact of market risks measured by the risk exposure value on the performance of growth and value portfolios in the context of the Amman Securities Market, like Table 7.
Table 7 indicates the impact of market risks measured by the VaR (Value at Risk) indicator on the joint performance of the growth and value portfolios.
The combined explanatory power of the model reached a value of (75%) and the estimated significance level was (0.037), which is lower than (0.05). This implies the appropriateness of the model's specification and the accuracy of its results.
Table 6: The Impact of General Market Index Risk according to VaR on the Performance of the Value Portfolio
Moral value
Estimated p-value
T-value
estimated
Coefficient of determination (R2)
correlation coefficient (R)
Constant
Sample
0.013
3.433
0.48
0.69
0.32
The general index of the market
N = 36
The critical T value with a degree of freedom (35,1) = 1.966
Source: The researcher prepared the results of simple linear regression analysis based on the data from Table 4
Table 7: The Effect of Market Index Risk According to VaR on the Growth and Value of Portfolios
Moral value
Estimated p-value
T- value
estimated
Coefficient of determination (R2)
correlation coefficient (R)
Constant
Sample
0.037
2.942
0.75
0.62
-0.128
The general index of the market
N = 36
The critical F value with a degree of freedom (35,1)= 2.887
Source: Prepared by the researcher from the results of regression analysis
CONCLUSION
The study tackled the verification of the main hypothesis, namely, 'There is an effect of the independent variable of market risks measured by the risk exposure value on the performance of growth and value portfolios in Jordan.' The study arrived at the following outcomes:
It is recommended to establish a precise measurement scale for assessing market risks, such as the risk exposure value indicator in the Amman Securities Market. This measure yields outcomes that investors can rely upon when shaping their investment portfolios
The study demonstrated the statistically significant and positive impact of market risks on the performance of the growth portfolio
The study illustrated a statistically significant and positive effect of market risk on the performance of the value portfolio
The results of the analysis of the explanatory variable and its impact on the dependent variables clarified that market risk measured by the risk exposure value exerts a positive impact on the combined performance of the growth and value portfolios, with an explanatory power of 75%
As the study also proposed a number of suggestions to enhance the research topic and contribute to further subsequent investigation into evaluating market risk and its impact on growth and value portfolios.
Recommendations
Investors should maintain a general awareness of the economic climate and for companies in which they have specific investments, they should possess a level of financial knowledge that enables them to make informed decisions and mitigate potential losses
Investment strategies rely on the principle of diversification, utilizing financial instruments and tangible tradable assets to reduce risks to a certain extent
Investors are advised to employ modern scientific methods and techniques to assess the performance of investment portfolios, measure returns and risks. This approach will assist them in directing their funds towards more profitable and secure investment avenues
REFERENCE
Khalaf, A. et al. “VaR Stock Exchange Portfolio on the Returns and Risks of Shares of the International Bank for Trade and Finance.” Journal of Hama University, vol. 3, no. 4, 2020.
Jawad, N.H. “Assessment of Consultative Portfolio Management According to Market Risks Using Value at Risk (VaR).” Al-Ghri Journal of Economic and Administrative Sciences, vol. 1, 2021, p. 17.
Kunduz, A.K.A. Banking Risks and Methods of Measuring Them. Training and Capacity Building Institute Studies, Arab Monetary Fund, 2020.
Al-Khafaji, M.H. “The Impact of Market Risks on Payment Default and Some Liquidity Indicators for Banks.” Journal of Banking & Finance, Elsevier, 2019.
Najjar, H. “Basel Accord and Its Possible Effects on the Algerian Banking System.” Journal of Economic Sciences and Management Sciences, vol. 7, no. 13, 2013, pp. 123-135.
Faisal, B. and H. Ahmed. Estimation of Value at Risk for Securities Portfolio: Case Study of Tunis Stock Exchange. Master’s thesis, Elsevier, 2021.
Al-Wandawi, H.T. and A.A. Al-Shammari. “The Impact of Exchange Rate and Inflation Risks on Local Financial Investments: An Analytical Study of the Iraqi Stock Exchange.” Accounting and Financial Sciences Journal, vol. 2, no. 7, 2022.
Hamoudi, H.S. and B. Reima. The Impact of Behavioral Finance on the Volatility of Investment Portfolio Returns: A Case Study of Paris and London Stock Exchanges. Doctoral thesis in Economic Sciences, Emerald Publishing Limited, 2019.
Goyal, K.A. and S. Agrawal. “Risk Management in Indian Banks: Some Emerging Issues.” International Economic Journal of Research, vol. 1, no. 1, 2010, pp. 102-109.
Maginn, J.L. et al.Managing Investment Portfolios: A Dynamic Process. vol. 3, John Wiley & Sons, 2007.
Meshaal, M.A.M. The Role of the Profitability Multiplier in Evaluating the Performance of the Investment Portfolio: An Analytical Study in the Iraq Stock Exchange. University of Mosul, 2019.
Ghazal, A.M. Evaluating the Performance of Value and Growth Stocks. Master’s thesis, Wiley Online Library, 2017.
Arouri, M.E.H. et al. “Volatility Spillovers between Oil Prices and Stock Sector Returns: Implications for Portfolio Management.” Journal of International Money and Finance, vol. 30, no. 7, 2011, pp. 1387-1405.
Juniar, A. et al. “Value at Risk in the Formation of Optimal Portfolio on Sharia-Based Stocks.” International Journal of Recent Technology and Engineering, vol. 8, no. 5, 2020, pp. 1198-1203.
Al Qaralleh, A.S. “Jordan and Syrian Humanitarian Refugees’ Dilemma: International Law Perspective.” Heliyon, 2022.
Khalaf, I. and B. Thabet. “Predicting the Returns of Financial Portfolios Using Time Series: A Case Study on the Qatar Stock Exchange.” Journal of North African Economies, Bashir Ibrahimi Institute University, 2020.
Stewart, S.D. et al.Portfolio Management: Theory and Practice. John Wiley & Sons, 2019.
Baker, H.K. and G. Filbeck. Investment Risk Management. Oxford University Press, 2014.
Recommended Articles
Research Article
The Effect of Employer Attractiveness and Compensation on Job Persuit Intention to Fmcg Companies in Indonesia: Coporate Reputation as an Intervening Variable
Download PDF
Research Article
Country of Origin and Foreign Branding on Perceived Quality of Local Products in Indonesia: The Moderating Role of Consumer Ethnocentrism
Download PDF
Research Article
The Effect of Self-Efficacy and Working Environment on Work Achievement with Organizational Commitment as Mediation
Sri Wahyuni,
...
Veithzal Rivai Zainal
Download PDF
Research Article
The Effect of Beauty Vlogger on Purchase Decision for Local Skincare Products in Indonesia: Brand Image as a Mediating Variable
Download PDF
PO Box 101, Nakuru
Kenya.
Email: office@iarconsortium.org
Editorial Office:
J.L Bhavan, Near Radison Blu Hotel,
Jalukbari, Guwahati-India
Al-Husseini, D. N. & Khudeeda, A. M. (2023). Measuring the risk of the market using (VaR) and its impact on the performance of the growth and Value portfolio an analytical study in the Amman Stock Exchange. Scientific Research Journal of Economics and Business Management, 3(2), 1-8.
MLA
Al-Husseini, Doaa N. and Azeez M. Khudeeda. "Measuring the risk of the market using (VaR) and its impact on the performance of the growth and Value portfolio an analytical study in the Amman Stock Exchange." Scientific Research Journal of Economics and Business Management 3.2 (2023): 1-8.
Chicago
Al-Husseini, Doaa N. and Azeez M. Khudeeda. "Measuring the risk of the market using (VaR) and its impact on the performance of the growth and Value portfolio an analytical study in the Amman Stock Exchange." Scientific Research Journal of Economics and Business Management 3, no. 2 (2023): 1-8.
Harvard
Al-Husseini, D. N. and Khudeeda, A. M. (2023) 'Measuring the risk of the market using (VaR) and its impact on the performance of the growth and Value portfolio an analytical study in the Amman Stock Exchange' Scientific Research Journal of Economics and Business Management 3(2), pp. 1-8.
Vancouver
Al-Husseini DN, Khudeeda AM. Measuring the risk of the market using (VaR) and its impact on the performance of the growth and Value portfolio an analytical study in the Amman Stock Exchange. Scientific Research Journal of Economics and Business Management. 2023 Jul;3(2):1-8.



 Download PDF
 Download XML




 : Signifies the portfolio risk measured by the standard deviation.



