Environmental Pollution and Degradation toward Sustainable Development of Bangladesh
Sirajul Islam
1
,
Nusrat Sharmin
2
1
Assistant Professor, Department of Economics, Bangladesh University of Business and Technology (BUBT), Dhaka Commerce College Road, Mirpur-2, Dhaka-1216, Bangladesh
2
Executive Admin Affairs, Premier School Dhaka, Bangladesh
This paper discusses the relationship of environmental pollution and degradation on sustainable development of Bangladesh by taking time series data from 1972 to 2011. The paper uses the variables like net national welfare (as a proxy of sustainable development), total GDP, total pollution and total resource rent (i.e., degradation) to establish the relationship. Here, the researchers use net national welfare for measuring sustainability. Statistical tools such as; Unit root test, the Hordick-Prescott filter, Co-integration test and Granger Causality test are used to establish the relationship. Unit root test ensures that all data are stationary in first difference. The Hordick-Prescott filter shows data trends are smooth in the long-run. Co-integration verifies that dependent and independent variables are co-integrated in the long-run. Normalized co-integration coefficients show that GDP has positive but pollution and natural resource rent (degradation)have negative effect on net national welfare. There is no alternative to control pollution and environmental degradation for sustainable development in Bangladesh.
Keywords
Net National Welfare
Hordick-Prescott Filter
Total Resouce Rent
Co-integration Test
Granger Causality Test
INTRODUCTION
Sustainable development implies the fulfillment of the needs of present generation without compromising the needs of future generation. Therefore, sustainability is something where the environment and development of the society all together have to reach the point of reconciliation [1]. This concept discusses about economic as well as social development. It includes the importance of protecting the natural resources and the important role of environment. If we cannot think the environment as a part of the economy, then the economic and social well-being cannot be improved. All development has to take into account by thinking about not only the present generation but also the future generation.
Bangladesh has made outstanding progress in MDGs achievement. Except environmental sustainability, most of the MDGs have been met by Bangladesh. Therefore, achieving sustainable development environment is getting priority in Bangladesh. The GDP growth rate in Bangladesh is increasing and becoming close to double digit. Bangladesh is also showing a positive trend in HDI. HDI value which was 0.39 in 1990 has been increased to 0.55 in 2010. All the indicators of HDI showed positive trends. Industrialization is increasing at a rapid rate in Bangladesh. The service sector is also expanding day by day. But all these positive development efforts must have some negative effects. Rapid urbanization and industrialization hamper environment. Unplanned industrialization and disposing of waste materials pollute environment. Due to unplanned urbanization, forests and arable lands are decreasing largely in Bangladesh. As a result, environmental capitals are falling in a large scale. So considering environmental issues in development activities are now time demanding topic.
LITERATURE REVIEW
Awan [2] analyzed the relationship between environment and sustainable economic development. The researcher found that developed countries are using excessive resources to produce surplus goods for exports, on the other hand, poor countries are exploiting their existing resources to feed their growing population and end poverty. The researcher concluded that judicious use of environmental resources is an imperative need for sustainable economic development.
Attah [3] discussed the concept of environmental sustainability with a focus on global efforts to achieve this and also discussed the need to strive towards a balance between environmental sustainability and economic growth. The researcher suggested that sustainable environment and growth can be achieved only by the integration of policies which connect the environment, the economy and the society.
Christmann [4] analyzed the determinants of global standardization of multinational companies’ environmental policies. The researcher found that the MNC characteristics affect environmental policy standardization and also the nature of stakeholder demands affects firms’ responses to stakeholder pressures.
Oskamp [5] explained the long-term threat facing the world is the danger that human actions are producing irreversible, harmful changes to the environmental conditions that support life on Earth, described a variety of motivational approaches toward reducing the problem and proposed that we should view the achievement of sustainable living patterns as a super ordinate goal. The researcher found that this threat is caused by human population growth, overconsumption and lack of resource conservation.
Haque [6] suggested that it is necessary to re-conceptualize sustainable development itself, important to transcend the neo-liberal beliefs underlying contemporary pro-market policies, essential to restructure the existing international conventions and agreements related to environment. While Mohammad [7] explained the understanding of origin and growth relating to the concept of environment and sustainable development in domestic and international laws and also showed the rationality of enlisting the environment as a basic right in the constitution that can be helpful to protect this value from the detrimental activities of private entities and states.
Elkington [8] examined the sustainable development policies of far-sighted governments to the increasing environmental awareness and cynicism of consumers, while Bansal [9] discussed the operationalizes corporate sustainable development and examined its organizational determinants. The researcher found that both resource-based and institutional factors influence corporate sustainable development by exploring time-related effects.
Ahmad [10] discussed the concept of sustainable development, its relevance for Bangladesh and policies and strategies for promoting it in Bangladesh. The researcher used economic growth, population growth, mobilization of resources, the role of women, devolution and decentralization, equity and protection of the environmental base as the key issues and the emphasis given to the effective implementation of strategies for promoting sustainable development.
This paper is unique in the sense that it tries to analyze the impact of environmental pollution and degradation on sustainable development of Bangladesh.
MATERIALS AND METHODS
Theoretical Framework
Net national welfare can be defined as the total annual output of both market and non-market goods and services minus the total externality and cleanup cost associated with these products, minus the depreciation of capital, both natural and human made used in production [11].
NNW = Total Output-Costs of Growth-Depreciation
(1)
Here we are assuming; total GDP as total output, the air pollution as total pollution and total resource rent as degradation which includes depreciation of capital, both natural capital and machines, plants, equipment’s and physical infrastructure as well as much government investment in human capital such as, spending on education and health care. Thus:
NNW = Total GDP-Total Pollution-Total Resource Rent
(2)
We can run a simple regression of the above equation, which is as follows:
NNWt = β1+β2 GDPt β3TPt β4 TRRt+ut
(3)
Taking Natural logarithm:
lnNNWt = α+β2 lnGDPt β3 lnTPt β4 lnTRRt+vt
(4)
Empirical Part
This part has been organized by Unit root test, Hordick-Prescott filter, Co-integration test and Granger causality test.
Unit Root Test
In this part Unit root test need to run in order to know whether Net National Welfare (NNW; which is termed here as a dependent variable) and three independent variables such as- total GDP, total pollution and total resource rent are co-integrated or not. This is done by the Augmented-Dickey-Fuller test. The following equation represents the augmented D-F test with a constant and a trend as:
where, ΔYt = Yt–Yt-1 and Y is the variable which is in consideration and m represents lag of dependent variable with the Akaike Information Criterion and ei represents stochastic error term. In case of unit root the null hypothesis requires that Ω = 0 (Dicky and Fuller).
Co-integration Test
Performing Co-integration test requires that variables in the time series analysis should have the characteristic that
they must be integrated in the same order. For this purpose, we can use a special method called Engle-Granger two-steps method [12]. In first step the integration between the variables need to identify and in the second step the Ordinary Least Square (OLS) is employed to estimate the residuals. Engle-Granger method verified that variable LnNNW (Natural Log of Net National Welfare) is co-integrated with the independent variables such as LnGDP (Natural Log of Total GDP) and LnTP (Natural Log of Total Pollution) and also LnTRR (Natural Log of total Resource Rent) are co-integrated.
The Co-integration between these two series was made through the Johansen-Juselius Co-integration technique. Two types of test statistics are used to justify the co-integrated vectors, as Trace test and Maximum Eigen value test statistic. These are given below:
In the max statistic alternative roots which are r, r+1should be tested. Where r+1 will be tested to verify it is rejected or not in favor of r root. Johansen [13] argued these two tests have non-standard distribution under the null hypothesis which provides approximate critical values for the statistic represented by Monte Carlo methods. The alternative hypothesis of trace test requires that the co-integrating vector is either equal or less than r+1, where as r+1 is hold for the maximum Eigen value test. Replacing NNW with LnNNW, GDP with LnGDP, TP with LnTP and TRR with LnTRR, it carries out the Johansen’s maximum likelihood procedure.
The Hordick-Prescott Filter
The HP filter is based on the assumption that a time series process can be modeled as the sum of a cyclical component and a growth component [14]:
yt = ygt+yct
(8)
In the real business cycle literature, it is desirable to remove the growth component, whether it be a stochastic or deterministic trend, in order to study the behavior of the cyclical component and to compare that behavior between different series. The HP filter achieves this by defining the cyclical component as:
yct = yt−ygt
(9)
where, yctbecomes the desired detrended series. The filter minimizes the variance of Equation 9, while penalizing for excessive changes in the growth component. This can be expressed in terms of the following minimization problem:
where, λ is termed the “smoothing parameter”, since its value determines the penalty applied to excessive changes in the growth rate of the series. The value chosen for λ will differ depending on the sampling frequency of the data and represents the trade-off between smoothness and goodness of fit in the resulting series. The first order condition from this minimization problem can be manipulated to produce the filter:
Hc(L) = L−2(1−L)4/ +L−2(1−L)4
(11)
Which will yield the cyclical component when applied to a time series. That is yct = Hc(L)yt.
In the frequency domain, the squared gain or frequency response, of this filter is:
HP(ω) = 4[1−cos (ω)]2/+4[1−cos (ω)]2
(12)
where, ω is frequency measured in radians. This representation allows us to see the effect the filter has on cycles of different frequencies in the data.
Granger Causality Test
Finally, the Granger Causality test is carried out for checking the causal relationship between two variables such as X and Y. It is a prediction based econometrical concept. If a single value of X Causes Y, then it is assumed that the previous values of X must have some information that assists predict Y before and after the information contained in the previous values of Y alone assuming both variables are stationary. This test is solely based on the time series data and for making prediction the following regressions is used:
vi and hi are the white noise disturbance terms which are assumed stationary where m and n are lags. Both equations represent Present Values of any one of the variables are related to the past values of itself and another variable. X will Granger Cause Y if the calculated F-statistics is significant at conventional level and similar will occur in case of Y to X. The lag length should be taken on the basis of Akaike information criterion.
RESULTS AND ANALYSIS
In this study the annual data on net national welfare, total GDP, total pollution and total resource rent have been taken for the period 1972 to 2011 of Bangladesh. The main source of data is the Data Bank of the World Development Indicators published by World Bank. Here, all variables are converted into natural log term but only for the Hordick-Prescott Filter uses normal data. The results are obtained by using econometric software Eviews version 7. According to the methodology mentioned above, sets of data are examined and empirical results are presented in this section.
Table 4: Granger Causality Test for Net National Welfare, Total GDP, Total Pollution and Total Resource Rent
Null Hypothesis
Obs
F-Statistic
Prob.
LN_T_GDP does not Granger Cause LN_NNW
39
5.56245**
0.0239
LN_NNW does not Granger Cause LN_T_GDP
1.64894
0.2073
LN_TP does not Granger Cause LN_NNW
39
0.96087
0.3335
LN_NNW does not Granger Cause LN_TP
7.20064**
0.0109
LN_TRR does not Granger Cause LN_NNW
39
5.82074**
0.0211
LN_NNW does not Granger Cause LN_TRR
5.99361**
0.0194
LN_TP does not Granger Cause LN_T_GDP
39
0.63696
0.43
LN_T_GDP does not Granger Cause LN_TP
6.27928**
0.0169
LN_TRR does not Granger Cause LN_T_GDP
39
2.32379
0.1361
LN_T_GDP does not Granger Cause LN_TRR
5.97584**
0.0195
LN_TRR does not Granger Cause LN_TP
39
0.01048
0.919
LN_TP does not Granger Cause LN_TRR
1.3883
0.2464
Unit Root Test (ADF) for LnNNW, LnGDP, LnTP and LnTRR
Variables are tested for the unit root to find out whether they are stationary or non-stationary according to the ADF test. Here test is applied in series in level and first differences with lag parameters determined by Akaike Information Criterion. The results are reported in Table 1.
The result of ADF unit root test shows that with the presence of unit roots in the original series such as in LnNNW and LnGDP, LnTP, LnTRR which are non-stationary in the levels. But in their first differences they are stationary as the first differences remove these unit roots, that is, they are integrated of the order one i.e., I (1); it is necessary to take step for the co-integration tests to determine whether there is any long-run connection between these dependent and independents variables.
Table 1: Unit-Root Test of Net National Welfare, Total GDP, Total Pollution and Total Resource Rent
Without Trends
With Trends
Variables
Levels
First difference
Levels
First difference
LnNNW
3.273705
-2.715576*
-0.004848
-11.41454***
LnGDP
2.165913
-8.619691***
-0.746291
-10.44370***
LnTP
-1.636888
-10.58757***
-3.877944**
-10.77813***
LnTRR
-1.469810
-8.313057***
-2.572380
-8.188232***
*’ ** and ***Represent significant at 1, 5 and10% level, respectively. In terms of Akaike information criteria, it is assumed that the optimal leg length is 1
Co-integration Test for LnNNW, LnGDP, LnTP and LnTRR
The Table 2 represents the results of Cointegration among the four variables.
The Johansen and Juselius [15] test has been done here with taking 1 lag length where Eigen value, 5 percent critical value and trace tests are simultaneously represented. Eigen value statistic is used to determine whether co-integration within the variables exists or not. The critical values are lower than the trace values that are co-integrated in the long run and only one equation has been found as not co-integrated in the long-run. The tests are used to determine the co-integration rank; r.LnNNW and LnGDP, LnTP, LnTRR are co-integrated in the long run as the trace values exceed the max values. Therefore, there is a long-run co-integration between LnNNW and three independent variables LnGDP, LnTP, LnTRR.
The value of the coefficient of net national welfare is given in Table 3.
The Table 3 shows that the net national welfare will increase 1% when total GDP rises 1%, the net national welfare will decrease 0.08% as total pollution rises 1%, and the net national welfare will be decreased by 0.06% with one percent increase in total resources rent. Therefore, it is clearly observed that GDP growth has a perfect (positive) effect on net national welfare. However, pollution and natural resource rent reduce the welfare of Bangladesh. That means ipollutionand environment degradation should be checked for increasing net national welfare of Bangladesh.
Table 3: Normalized Co-Integrating Coefficients (Sign of the Original Result of Coefficients has been Reversed here for Estimating Easily)
LnNNW
LnGDP
LnTP
LnTRR
1
1.090659
-0.08295
-0.06124
The Hordick-Prescott Filter for NNW, GDP, TP and TRR
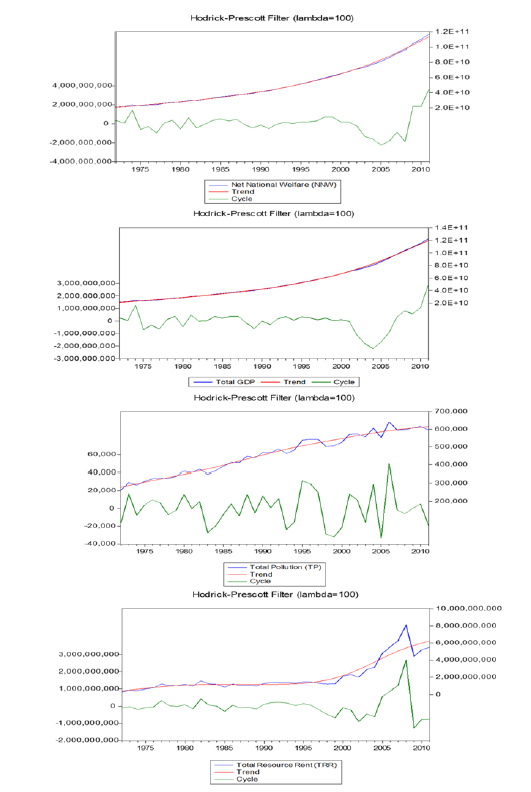
This part shows the Hordick-Prescott Filter for net national welfare, total GDP, total pollution and total resource rent. According to Hordick-Prescott, for four variables the researcher uses 100 as a lambda value. As we know that this filter is used for smoothing the trend of the variables.
The Figure 1 illustrate the Hordick-Prescott filter for the net national welfare, total GDP, total pollution, total resource rent and as all data are annual data so the researcher uses lambda (λ) value = 100 for all variables. Using this value, the researcher found smooth trends of net national welfare, total GDP, total pollution as well as total resource rent in the long-run. All variables show positive trends in the long-run. And the line showing fluctuation named cycle which is showing the cycle of net national welfare is fluctuating but the rate is quite smooth and increasing, for total GDP fluctuation in the cycle can be seen but the fluctuation is not much rough but cycle of total pollution is fluctuating in a greater range.
Granger Causality Test for LnNNW, LnGDP, LnTP and LnTRR
The Table 4 represents the results of Granger Causality test.
Here, the null hypothesis between total GDP and net national welfare has been rejected because the probability value is lower than 0.05 which means that GDP Granger Cause NNW, that means total GDP tends to change the net national welfare; on the other hand, net national welfare does not Granger Cause total GDP as the null hypothesis could not be rejected, so there is unidirectional causality between these two variables. The probability between total pollution and net national welfare is accepted because it is greater than 0.05 so it shows no Granger cause, on the other hand net national welfare leads to change total pollution as the null hypothesis has been rejected and shows Granger cause and also shows unidirectional causality between these two variables. The probability between total resource rent and net national welfare is lower than 0.05 and shows that TRR Granger cause NNW and also NNW Granger cause TRR and there is bidirectional relation between these two variables as both has great impact on each other. The total pollution and total GDP shows unidirectional relation as the total pollution has no impact on total GDP, while total GDP leads to change in total pollution and there is GDP Granger Cause TP. The total resource rent leads no change in total GDP because the null hypothesis has been accepted while the total GDP leads to change in total resource rent as the null hypothesis has been rejected here; it means there is unidirectional relationship between these two variables. The total resource rent and total pollution do not have any impact on each other and shows no relation between these two because there is no Granger Cause between them and the probability is greater than 0.05 and null hypothesis has been accepted.
Table 2: Co-Integration Test for Net National Welfare, Total GDP, Total Pollution and Total Resource Rent
Hypothesized No. of CE(s)
Eigenvalue
Trace Statistic
0.05 Critical Value
Probability**
None*
0.687261
79.65048
47.85613
0.0000
At most 1*
0.396708
36.64224
29.79707
0.0070
At most 2*
0.359275
17.94412
15.49471
0.0210
At most 3
0.039039
1.473379
3.841466
0.2248
*’ ** and ***Denote Rejection of the Hypothesis at 1, 5 and 10% significance level, respectively. L.R. test indicates 1 co-integrating equations at 5% significance level, Test assumption: Linear deterministic trend in the data, Series LnNNW and LN (GDP, TP, TRR), Lag interval-1
Figure 1: Time Series Plots of Annual Data of Net National Welfare, Total GDP, Total Pollution and Total Resource Rent with the HP Trend and Cycle
CONCLUSION
Aesthetic and healthy environment has positive impact on welfare of a nation. To enhance net national welfare (sustainable development) the GDP must increase along with controlling pollution and reducing environmental degradation (depreciation of natural resources). Government must adopt some environmental protective policies like imposing pollution tax on polluting firms and enforcing the polluting firms to use environment friendly technologies. However, a number of such policies have already been taken by the government but the implantation is not yet done prefectly. Therefore, the government should focus on the implementation of such policies.
REFERENCE
Kamal, M. Analyze the Major Challenges of Sustainable Development in Bangladesh. Thesis paper, 2016.
Awan, A.G. “Relationship between Environment and Sustainable Economic Development: A Theoretical Approach to Environmental Problems.” International Journal of Asian Social Science, vol. 3, no. 3, 2013, pp. 741-761.
Attah, N.V. “Environmental Sustainability and Sustainable Growth: A Global Outlook.” University of Pennsylvania ScholarlyCommons, 2010, Philadelphia, Pennsylvania.
Christmann, P. “Multinational Companies and the Natural Environment: Determinants of Global Environmental Policy.” Academy of Management Journal, vol. 47, no. 5, 2004.
Oskamp, S. “Psychology of Promoting Environmentalism: Psychological Contributions to Achieving an Ecologically Sustainable Future for Humanity.” Journal of Social Issues, vol. 56, no. 3, 2000.
Haque, M.S. “The Fate of Sustainable Development under Neo-Liberal Regimes in Developing Countries.” International Political Science Review, vol. 20, no. 2, 1999.
Mohammad, N. “Environment and Sustainable Development in Bangladesh: A Legal Study in the Context of International Trends.” International Journal of Law and Management, vol. 53, no. 2, 2011, pp. 89-107.
Elkington, J. “Towards the Sustainable Corporation: Win-Win-Win Business Strategies for Sustainable Development.” California Management Review, vol. 36, no. 2, Winter 1994, University of California Press, California, USA.
Bansal, P. “Evolving Sustainably: A Longitudinal Study of Corporate Sustainable Development.” Strategic Management Journal, vol. 26, no. 3, 2004, Ontario, Canada.
Ahmad, Q.K. “Policies and Strategies for Sustainable Development in Bangladesh.” ELSEVIER Journal of ScienceDirect, vol. 24, no. 9, 1992, pp. 879-893.
Goodstein, E.S. Economics and the Environment. John Wiley & Sons, Inc., 2010, Ch. 6, pp. 90.
Engle, R.F. and C.W. Granger. “Cointegration and Error Correction Representation, Estimation and Testing.” Econometrica, vol. 55, 1987, pp. 251-276.
Johansen, S. “Statistical Analysis of Cointegrating Vectors.” Journal of Economic Dynamics and Control, vol. 12, 1998, pp. 231-254.
Doorn, D.J. “Consequences of Hodrick-Prescott Filtering for Parameter Estimation in a Structural Model of Inventory Behavior.” Proceedings of the Annual Meeting of the American Statistical Association, August 2001.
Johansen, S. and K. Juselius. “Maximum Likelihood Estimation and Inference on Cointegration-With Applications to the Demand for Money.” Oxford Bulletin of Economics and Statistics, vol. 52, 1990, pp. 169-210.
Recommended Articles
Research Article
The Effect of Employer Attractiveness and Compensation on Job Persuit Intention to Fmcg Companies in Indonesia: Coporate Reputation as an Intervening Variable
Download PDF
Research Article
Country of Origin and Foreign Branding on Perceived Quality of Local Products in Indonesia: The Moderating Role of Consumer Ethnocentrism
Download PDF
Research Article
The Effect of Self-Efficacy and Working Environment on Work Achievement with Organizational Commitment as Mediation
Sri Wahyuni,
...
Veithzal Rivai Zainal
Download PDF
Research Article
The Effect of Beauty Vlogger on Purchase Decision for Local Skincare Products in Indonesia: Brand Image as a Mediating Variable
Download PDF
PO Box 101, Nakuru
Kenya.
Email: office@iarconsortium.org
Editorial Office:
J.L Bhavan, Near Radison Blu Hotel,
Jalukbari, Guwahati-India
Islam, S. & Sharmin, N. (2022). Environmental Pollution and Degradation toward Sustainable Development of Bangladesh. Scientific Research Journal of Economics and Business Management, 2(1), 1-6.
MLA
Islam, Sirajul and Nusrat Sharmin. "Environmental Pollution and Degradation toward Sustainable Development of Bangladesh." Scientific Research Journal of Economics and Business Management 2.1 (2022): 1-6.
Chicago
Islam, Sirajul and Nusrat Sharmin. "Environmental Pollution and Degradation toward Sustainable Development of Bangladesh." Scientific Research Journal of Economics and Business Management 2, no. 1 (2022): 1-6.
Harvard
Islam, S. and Sharmin, N. (2022) 'Environmental Pollution and Degradation toward Sustainable Development of Bangladesh' Scientific Research Journal of Economics and Business Management 2(1), pp. 1-6.
Vancouver
Islam S, Sharmin N. Environmental Pollution and Degradation toward Sustainable Development of Bangladesh. Scientific Research Journal of Economics and Business Management. 2022 Jan;2(1):1-6.


 Download PDF
 Download XML








 +L−2(1−L)4