Introduction: Globally, Tuberculosis (TB) remains a major public health problem. It is one of the top 10 causes of death worldwide. According to World Health Organization (WHO) TB report 2019, globally, an estimated 10 million people fell ill with TB in 2018. Material and Methods: A cross-sectional study was conducted among the patients of tuberculosis diagnosed at I.G.M.C. Shimla to assess the profile of T.B patients and assess the knowledge levels and stigma among the patients. Results: Among all the participants enrolled for study (52.38%) were males. Only 19 % were educated up to university level. Among all the participants, 47.6% were unemployed. Among all the patients included in the study, extra pulmonary tuberculosis was diagnosed in 54.3% patients visited I.G.M.C Shimla.27.6% of participants were exposed to TB patients at home or workplace. Conclusion: There is high proportion of extra pulmonary tuberculosis among study participants. Diabetes mellitus, HIV and COPD were detected as co-morbidities in participants. Social stigma was present in study participants for seeking treatment.
Keywords
Tuberculosis
Patient Profile
Knowledge
Stigma
INTRODUCTION
Globally, Tuberculosis (TB) remains a major public health problem. It is one of the top 10 causes of death worldwide. According to World Health Organization (WHO) TB report 2019, globally, an estimated 10 million people fell ill with TB in 2018. It is the main cause of deaths related to antimicrobial resistance and the leading killer of people with HIV. Sustainable development goal target 3.3includes ending TB epidemic by 2030.
The WHO reported that TB caused an estimated 1.2 million deaths among HIV-negative people and there were an additional 2, 51, 000 deaths from TB among HIV-positive people. India contributed more than one fourth (27%) of global burden of TB cases. About 1.7 billion people, 23% of the world’s population, are estimated to have a latent TB infection, and are thus at risk of developing active TB disease during their lifetime.
In India, an estimated incidence of TB cases in 2018 was 27 lacs. According to TB India report 2019, India was able to achieve a notification of 21.5 lac in 2018. Drug resistance is a continuous threat with an estimated incidence of multi drug resistance (MDR) being 5 lacs globally and 1,30, 000 in India. Since there is paucity of data regarding T.B patients in Himachal Pradesh, this cross-sectional study was planned to study the profile of T.B patients and assess the knowledge levels and stigma among the patients.
MATERIALS AND METHODS
A cross-sectional study was conducted among the patients of tuberculosis diagnosed at I.G.M.C. Shimla and notified from DOTS center from 1st August 2018 through 31st July 2019. A consecutive sample of 105 patients was collected after satisfying the eligible criteria of the patients of tuberculosis diagnosed. All new cases of pulmonary and extra-pulmonary TB patients aged 18 years and above were included in the study after taking written informed consent from the participants. Data was collected from patients through face-to-face interviews at the time of their registration for treatment at DOTS centre. Data was entered in Microsoft excel spread sheet, cleaned and analyzed using Epi.info version 7.2.2 software. Descriptive statistics were used to summarize the quantitative variable as mean, median, standard deviation, and percentage. Qualitative variable expressed in frequencies, percentage along with 95% confidence interval.
RESULTS
Among all the participants enrolled for study (52.38%) were males. Only 19 % were educated up to university level. Among all the participants, 47.6% were unemployed (Table 1).
Table 1: Demographic Profile of the Study Participant
No.
Characteristic (n = 105)
n (Percentage)
n (Percentage)
Total N (Percentage)
1
Sex
Male
Female
55(52.38)
50(47.62)
105 (100)
2
Residence
Urban
20 (19.04)
22 (20.95)
42 (39.99)
Rural
35 (33.34)
28(26.67)
63 (60.01)
3
Marital status
Married
42 (40)
28 (26.67)
70 (66.67)
Unmarried
13 (12.38)
22(20.95)
35 (33.33)
4
Education
University or higher
8 (7.62)
12 (11.43)
20 (19.05)
Secondary
5 (4.76)
8 (7.62)
13 (12.38)
Middle
17 (16.19)
13 (12.38)
30 (28.47)
Primary
23 (21.90)
13 (12.38)
36 (34.29)
Illiterate
2(1.90)
4 (3.81)
6 (5.71)
5
Occupation
Professional
4 (3.80)
1(0.95)
5 (4.75)
Clerical/worker
9 (8.57)
7 (6.67)
16 (15.24)
Student
12 (11.43)
22 (20.95)
34 (32.38)
Unemployed
30 (28.58)
20 (19.05)
50 (47.63)
6
Socioeconomic status
I
9 (8.57)
9 (8.57)
18 (17.14)
II
8 (7.63)
9 (8.57)
17 (16.20)
III
13 (12.38)
10 (9.52)
23 (21.90)
IV
20 (19.05)
17(16.19)
37 (35.24)
V
5 (4.76)
5 (4.76)
10 (9.52)
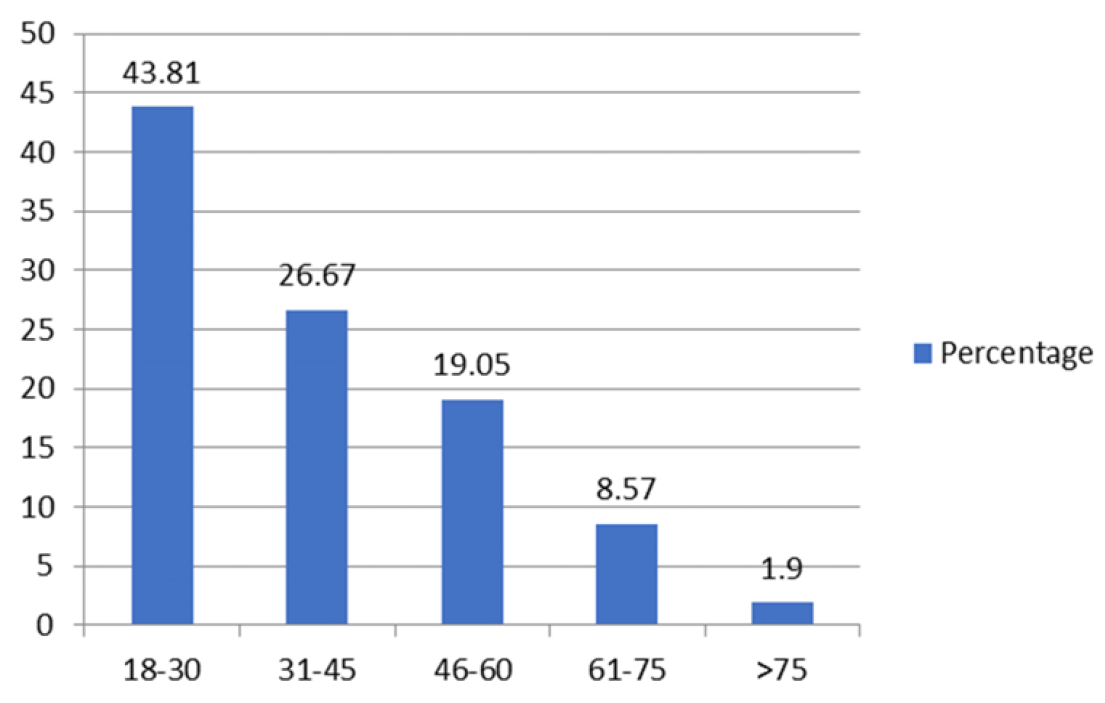
The mean age of participants was 38.80 ± 16.39 year with range of 18-82 years. Majority of the patients (70%) were in age group 18-45 years (Figure 1).
Figure1: Age Distribution of Study Participants (In Years)
There were 36 participants who ever smoked. Out of those who smoked, 7 were females. Only 10 participants were using smokeless tobacco (Table 2).
Table 2: Distribution of Participants by Tobacco Use
Parameters
Male n (Percentage)
Female n (Percentage)
Total N (Percentage)
Smoking pattern
Current smoker
16 (15.24)
4 (3.81)
20 (19.05)
Past smoker
13(12.38)
3 (2,86)
16 (15.24)
Non smoker
26(24.76)
43 (40.95)
69 (65.71)
Type of tobacco smoked
Cigarette
9 (8.57)
0
9 (8.57)
Bidi
20 (19.05)
7 (6.67)
27 (25.72)
Quantity of tobacco smoked (pack years)
<10
8 (7.63)
2 (1.90)
10 (9.53)
11-20
12 (11.43)
4 ((3.80)
16 (15.23)
>20
9 (8.57)
1 (0.95)
10 (9.53)
Smokeless tobacco use
Khaini
10 (9.52)
0
10 (9.52)
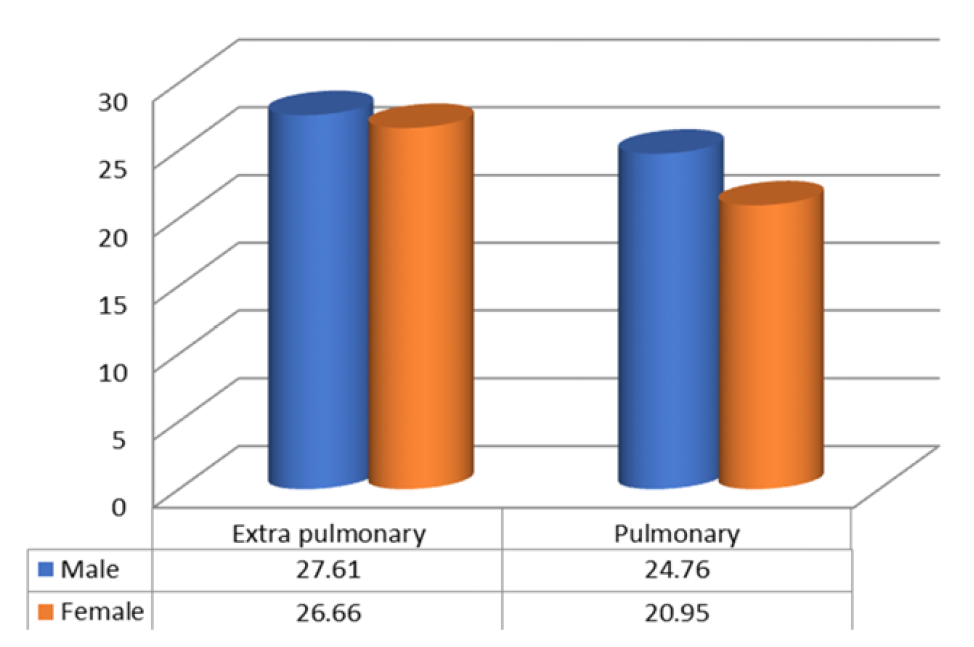
Among all the patients included in the study, extra pulmonary tuberculosis was diagnosed in 54.3% patients visited I.G.M.C Shimla (Figure 2).
Figure 2: Distribution of Participant According to Type of Tuberculosis
27.6% of participants were exposed to TB patients at home or workplace (Table 3).
Table 3: Distribution of Previous Exposure to TB Patient among Study Participants
No.
H/O contact with TB patient at home /workplace (n=105)
Male n (Percentage)
Female n (Percentage)
Total N (Percentage)
1
Yes
18 (17.14)
11(10.47)
29 (27.61)
2
No
37(35.2)
39(37.15)
76 (72.39)
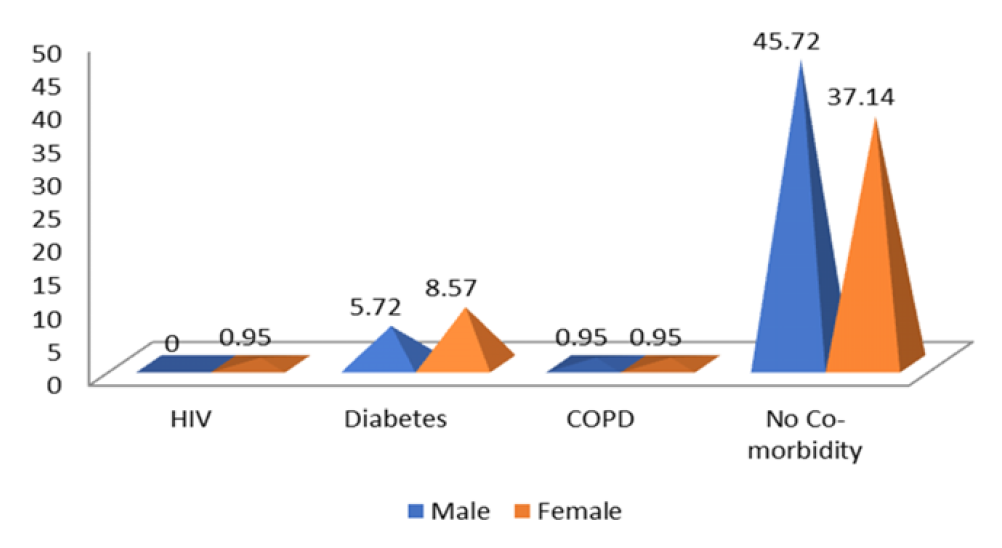
Majority of patients (82.8%) had no associated co-morbidity. Out of total enrolled, diabetes mellitus was detected in 14.2% patients (Figure 3).
Figure 3: Distribution of Co Morbidities among Study Participants n = 105
Among all the patients, those who presented at health facility with cough, fever and haemoptysis were 41.8 %. Out of total, 36.1 % presented with swelling of lymph node and other symptoms (Table 4).
Table 4: Symptoms with Which Participants Presented at Health Facility
No.
Symptoms (n = 105)
Male n (Percentage)
Female n (Percentage)
Total N (Percentage)
1
Cough with Fever
17 (16.19)
15 (14.28)
32 (30.47)
2
Cough with Fever and Haemoptysis
7 (6.67)
5(4.76)
12 (11.43)
3
Cough and Haemoptysis
7 (6.67)
8 (7.62)
15 (14.29)
4
Cough with chest pain
3 (2.86)
5 (4.76)
8 (7.62)
6
Others (swelling L.N, pain abdomen etc.)
21 (20)
17 (16.19)
38 (36.19)
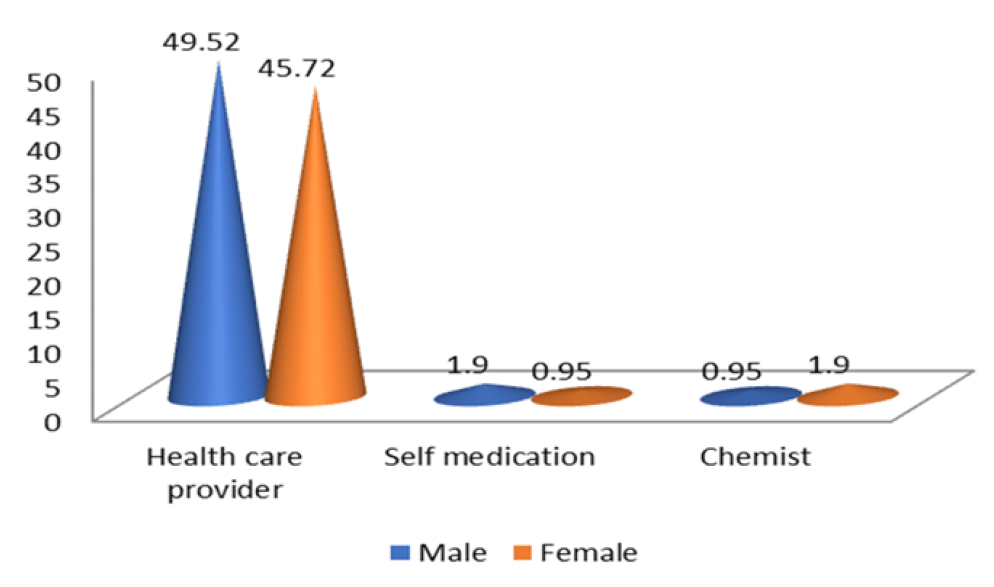
Majority of patients (95.24%) preferred to consult health care provider with onset of symptoms. Only (1.90%) patients had taken medicine from chemist for relief of their symptoms (Figure 4).
Figure 4:Description of Initial Response of Participants with Onset of Symptoms
Among all the enrolled patients, majority (77.14%) visited the C.H.C/C.H/D.H. Out of total, 10.48% visited private practitioner for treatment (Table 5).
Table 5: Description of Type of Health Facility Preferred for First Consultation
No.
Parameters
n (Percentage)
n (Percentage)
N (Percentage)
Name of health facility
Male
Female
Total
1
P.H.C
5(4.76)
6 (5.72)
11 (10.48)
2
C.H.C/C.H./D.H
41(39.05)
40 (38.09)
81 (77.14)
3
Private practitioner
7 (6.67)
4 (3.81)
11 (10.48)
4
Ayurvedic health Centre
2 (1.90)
0 (0)
2 (1.90)
Knowledge among patients regarding vaccine for TB was 10.50%. Knowledge regarding previously heard of TB was 87.37% (Table 6).
Table 6: Knowledge regarding TB
Question knowledge regarding TB
Yes N (Percentage)
No N (Percentage)
1. Have you previously heard of TB?
92(87.37)
13(12.63)
2. What kind of disease do you have?
91(86.87)
14(13.13)
3. Is TB hereditary?
28 (26.70)
77(73.30)
4. Is TB contagious?
83 (79)
22 (21)
5. Is TB curable?
96 (91.40)
9 (8.60)
6. Do you know if there is a vaccine for TB?
11 (10.50)
94 (89.50)
7 Do you know the approximated duration of Treatment
70 (66.66)
35 (33.34)
8. Do you know the kind of TB drugs?
86 (81.90)
19 (18.10)
Among all the patients (37.14 %) felt ashamed of having TB and 40 % had to hide TB diagnosis from others. 47.61% patients agreed that TB affects relation with others (Table 7).
Table 7: Describing TB Stigma
Question related to TB stigma
Agree N (Percentage)
Do not agree N (Percentage)
1. Do you feel ashamed for having TB?
39 (37.14)
66 (61.86)
2. Do you have to hide TB diagnosis from the other people?
42 (40)
63 (60)
3. Does TB affect relation with the others?
50 (47.61)
55 (42.39)
4. Is TB very costly due to long duration of the disease?
48 (45.71)
57 (54.39)
5. Do you prefer to live isolated since you got TB diagnosis?
43(40.95)
62 (59.15)
6. Does the TB affect your work performance?
45 (42.85)
57 (57.15)
7. Does TB affect marital relation?
42 (40)
63 (60)
8. Does TB affect family responsibilities?
49 (46.66)
56 (44.34)
9. Do you think there is less chances of marriage due to TB diagnosis?
45 (42.85)
60 (57.15)
10. Does TB affect your family relations?
50(47.61)
55 (52.39)
DISCUSSION
Tuberculosis affects adults in their most productive years of life. However, all age groups are at risk of developing tuberculosis.
In the present study, 70% of patients were in the age group of 18-45 years. The mean age of study participants was 38.8 years ±16.39. Patients in the age group of 18-45 years were more exposed to risk factors like smoking, harmful use of alcohol consumption. Globally 90 % TB cases were present in age group of more than 15 years. Similar findings were also observed in previous studies done in India and abroad [1].
In our study TB was diagnosed more in men (52%) as compared to women 46.6%. Almost similar findings are seen globally also, where 57% men suffered with TB as compared to 32% women. Similar findings were also observed in study conducted by Ukwaja KN et al. [2] Higher prevalence of TB among men could be explained by the fact that women generally lags behind in seeking health care due to social barriers of our society. However, notification in women had been improving due to increased awareness and decreased social stigma.
In our study 66.7% of the patients were in middle and lower socio-economic status. According to WHO 90% of TB is prevalent in low- and middle-income countries [3]. A study conducted in India also found that TB is more common in poor people [4]. This can be attributed to under nutrition, poor housing conditions and economic constraint for seeking care in patients of lower socio-economic status.
The present study found that most of the TB patients were educated up to primary 34.29%, middle 28.47%, secondary 12.38 and university or above 19.02%. Similar findings were also observed in studies conducted in Bangladesh and Uzbekistan.It may be due the reason that overall literacy in Himachal Pradesh is already high (82.8 [5]
In current study, 48% of the patients were unemployed and 34% were students. A similar study conducted in China showed that 41.7% participants were unskilled workers while 12.8% were students [6]. In a study done by Jaysri findings were Contrary to our findings [7].
In the present study 60% of the patients belonged to rural area. Similar findings were found in studies done in India [8]. Comparatively, higher proportion of TB patients in rural areas can be ascribed to the reason that in rural areas, the infrastructure for TB diagnosis is not adequate.
Most of the patients in present study presented at health facility with symptoms of cough with fever and hemoptysis. Majority (95%) of the patients visited public hospitals for diagnosis and treatment of TB. This finding is contrary to other study done in Nepal where patients first taken treatment from traditional healer, self-medication and treatment from chemist [9]. In context to our study in HP, patients visited the public hospitals because peoples mostly rely upon health services provided by public sector [10].
In the present study, only 12.4% visited the private practitioner. This observation was contrary to a study done in Ethiopia where patient visited first to private practitioners were 41.6% [11]. The availability of health services in private sector are less and peoples of Himachal Pradesh mostly rely on government hospitals.
CONCLUSION
The present study revealed that majority of patients were from younger age group, educated and belonged to middle class families. Gender distribution in present study was almost equal. Half of study participants were unemployed and 34% were students. There is high proportion of extra pulmonary tuberculosis among study participants. Diabetes mellitus, HIV and COPD were detected as co-morbidities in participants. Social stigma was present in study participants for seeking treatment.
REFERENCE
Alavi, Seyed Mohammad et al. “Factors associated with delay in diagnosis and treatment of pulmonary tuberculosis.” Journal of Microbiology, vol. 8, no. 3, March 2015, e19238.
Bhatt, Arun N. and Manjunath K. “Delays are still a challenge in tuberculosis control: Cross-sectional study from south India.” Indian Journal of Basic and Applied Medical Research, vol. 6, no. 1, December 2016, pp. 307–313.
Dos Santos, M.A. et al. “Risk factors for treatment delay in pulmonary tuberculosis in Recife, Brazil.” BMC Public Health, vol. 5, March 2005, pp. 25.
Gali, J.H. et al. “Hurdle in the eradication of tuberculosis: Delay in diagnosis.” The Egyptian Journal of Chest Diseases and Tuberculosis, vol. 68, no. 1, January 2019, pp. 32–.
Meyssonnier, V. et al. “Factors associated with delayed tuberculosis diagnosis in China.” The European Journal of Public Health, vol. 23, no. 2, April 2013, pp. 253–257.
Rabin, A.S. et al. “Prescribed and self-medication use increase delays in diagnosis of tuberculosis in the country of Georgia.” The International Journal of Tuberculosis and Lung Disease, vol. 17, no. 2, February 2013, pp. 214–220.
San Pedro, Alexandre et al. “Tuberculosis as marker of inequalities in the marker of socio-spatial transformation.” Revista de Saúde Pública, vol. 51, 2017. https://www.ncbi.nlm.nih.gov/pmc/articles/PMC5308553/.
Thakur, R. and M. Murhekar. “Delay in diagnosis and treatment among TB patients registered under RNTCP, mandi, Himachal Pradesh, India, 2010.” Indian Journal of Tuberculosis, vol. 60, no. 1, January 2013, pp. 37–45.
Ukwaja, K.N. et al. “Healthcare-seeking behavior, Treatment delays and its determinants among pulmonary tuberculosis patients in rural Nigeria: A cross-sectional study.” BMC Health Services Research, vol. 13, January 2013, pp. 25. https://doi.org/10.1186/1472-6963-13-25.
Yamasaki-Nakagawa, M. et al. “Gender difference in delays to diagnosis and health care seeking behaviour in a rural area of Nepal.” International Journal of Tuberculosis and Lung Disease, vol. 5, no. 1, January 2001, pp. 24–31.
Census 2011. “Himachal Pradesh Population Census 2011 Data.” https://www.census2011.co.in/census/state/himachal+pradesh.html.
Recommended Articles
Research Article
Imaging Evaluation of Ultrasonography Versus Magnetic Resonance,
Imaging in Diagnosis of Carpal Tunnel Syndrome among Female Patients with Positive Nerve Conduction Study
Download PDF
Research Article
An evaluation of Profile of Medico-legal autopsies conducted at Dr. Radhakrishnan Govt. Medical College, Hamirpur, Himachal Pradesh
Download PDF
Research Article
The Efficacy of 5- Fluorouracil Cream and 25% Podophyllin Solution in Treatment of Plantar Warts in Alternative Day Regimen ; An Open Therapeutic Trial.
Download PDF
Research Article
Silent Threats: Evaluating Knowledge of Pelvic Inflammatory Disease Among Reproductive-Age Women in District Kangra
Pankaj sharma,
Kritika Katoch
Published: 27/11/2024
Download PDF
PO Box 101, Nakuru
Kenya.
Email: office@iarconsortium.org
Editorial Office:
J.L Bhavan, Near Radison Blu Hotel,
Jalukbari, Guwahati-India
None, R. S., None, P., None, D. D., None, A. M. & None, V. B. (2022). A Cross-Sectional Study to Assess the Profile and Knowledge Levels and Stigma among Tuberculosis Patients in a Medical College in North India. International Academic Research Journal of Internal Medicine & Public Health, 3(1), 1-5.
MLA
None, R. Singh, et al. "A Cross-Sectional Study to Assess the Profile and Knowledge Levels and Stigma among Tuberculosis Patients in a Medical College in North India." International Academic Research Journal of Internal Medicine & Public Health 3.1 (2022): 1-5.
Chicago
None, R. Singh, Priyanka , D. Dhadhwal , A. Mahajan and V. Barwal . "A Cross-Sectional Study to Assess the Profile and Knowledge Levels and Stigma among Tuberculosis Patients in a Medical College in North India." International Academic Research Journal of Internal Medicine & Public Health 3, no. 1 (2022): 1-5.
Harvard
None, R. S., None, P., None, D. D., None, A. M. and None, V. B. (2022) 'A Cross-Sectional Study to Assess the Profile and Knowledge Levels and Stigma among Tuberculosis Patients in a Medical College in North India' International Academic Research Journal of Internal Medicine & Public Health 3(1), pp. 1-5.
Vancouver
R. Singh RS, Priyanka P, D. Dhadhwal DD, A. Mahajan AM, V. Barwal VB. A Cross-Sectional Study to Assess the Profile and Knowledge Levels and Stigma among Tuberculosis Patients in a Medical College in North India. International Academic Research Journal of Internal Medicine & Public Health. 2022 Jan;3(1):1-5.


 Download PDF
 Download XML