
+91 6002993949
submission@iarconsortium.org
Open Access
ISSN (Print) : 2708-6259
ISSN (Online) : 2708-6267
Kafue lechwe (Kobus leche kafuensis), is an endemic sub-species of semi aquatic antelope that is restricted to the Kafue Flats which covers an area approximately 6, 035 km2 in extent, encompassing Blue lagoon and Lochinvar National Parks and Kafue Flats Game Management Area. The first comprehensive survey that was done in 1931 estimated 250,000 lechwe. the last count done in 1975 before the construction of the Itezhi-tezhi dam estimated the population at 80,774. That figure was 32% lower than the 1931 estimate, representing a 68% loss. After commissioning the Itezhi-tezhi dam in 1979, the first count was done in 1981 that recorded 45,867 which was 18% of the 1931 population or representing a 81% loss. The mean population size before the construction of the dam was 120,139 which dropped by 60% to 48,144 after the dam. In 2005 which we considered to be a turning point the population had further declined to 38,448 which was 15% of the 1931 estimate representing 85% decline. By 2015 the population had continued to decline to 28, 660 which is 11% and 88% loss of the 1931 estimate. By 2005 there was an annual loss of 2,464 or 7 lechwes/day of which only one lechwe was attributed to legal hunting and the remaining six to poaching and other factors. The year 2005 inevitably marked a turning point in the protection of the species as it clearly signifies a precipitous population decline depicting high levels of environmental resistance and or failure to regulate in terms of population dynamics. A comprehensive strategy more rigorous including but not restricted to captive breeding or time bound lease to the private sector to breed and return may be required. Routine law-enforcement operations in terms of boots on the ground and patrols, reducing hunting quotas or outright ban of hunting seem not to have worked in favour of the species. The impact of competition for forage with cattle will require detailed monitoring developing an improved foraging strategy for cattle including the making of hay and silage so that cattle herds are reduced on the Flats despite the political sensitivity of the matter may have to be experimented in order to save the lechwe. Increasing cattle populations and human encroachment on lechwe habitat is a factor that should not be ignored.As the populations decline into hundreds, the stochastic problems including inbreeding may set in. At this point it may too late to save the species.
The Kafue lechwe (Kobus leche kafuensis Haltenorth) is a gregarious semi aquatic antelope (Figure 1) which is an endemic subspecies restricted to the Kafue Flats formed and maintained by the flooding of the Kafue River which divides the area almost into two oblong halves named Kafue Flats north and south banks. The Lochinvar National Park is located in the south bank and Blue Lagoon in the north but the Kafue Flats Game Management Area (GMA) spans both banks. Subsisting records show that the first comprehensive effort to estimate the population was during the colonial era when the country was called Northern Rhodesia and was carried out by Pitman [1] who had been hired by the colonial government after carrying out some similar work in Uganda. At this time in 1931 the population size was approximately 250,000 individuals. There is no other known estimate larger than this. Since then, as already eloquently elaborated by Chomba et.al. [2] the number has continued to decline rapidly suggesting a significant decline of 85% or an annual decline of 1.05% by 2005. Numerous reports on the species indicate a rapidly declining population. Despite the alarming and precarious status of the species, the only response from authorities has been routine foot patrols. In fact, at one point, and particularly during the transformation of the Department of National Parks and Wildlife Service (NPWS) into the Zambia Wildlife Authority (ZAWA) coupled with loss of staff due to HIV related conditions which were very prevalent at the time, staff attrition was so bad that the area had remained with a highly conservative estimate of less than 40% of the pre-ZAWA era. Response from the international community to save the species has been at best subtly absent. The concern over the status of the Kafue lechwe is that since it is an endemic species with no possibility of repopulation through immigration, the loss of the last pair would signify extinction. It is understandable at the time of the endemic flightless bird the dodo (Rhaphus cucullatus) going into extinction, because, the level of technology was very low, conservations were almost nonexistent, unlike today when humanity has scored tremendous achievements in the area of molecular and cell biology, and international Nongovernment organizations including UN agencies interested in nature and natural resources with well trained and skilled staff look for projects to fund. It would be and will be recorded in our annals of history as an irresponsible generation which has capacity to do things but which lacks passion and commitment. We considered the 2005 estimated of 38,448 recorded by Chansa and Kampamba [3] as a turning point.

Figure 1: Kafue Flats lechwe (Kobus leche kafuensis), a gregarious semi-aquatic antelope endemic to the Kafue Flats
Source: Common.wikimedia.org/wiki/File.Kafue_Lechwe.jpg
The population update by Chomba et al. [2] was a reminder to the government and the international community to take steps beyond the ordinary routine functions to save the species. The mere community involvement has failed and more strenuous but science-based strategies are needed and urgently. Such a strategy would be carried side by side with a regular population monitoring programme to know the performance and identify key environmental parameters responsible for the precipitous decrease of the population. Major concerns have been raised regarding pastoralism which has led to sudden increase of cattle keeping communities taking advantage of the rich natural pasture on the Flats. Artisanal fishing is also permitted and has led to unplanned and often unregulated fishing camps along the entire river length of the Kafue Flats. Such multiple land use systems require monitoring particularly with regard to their effects on the endemic Kafue lechwe, which is more vulnerable to increasing human settlements and associated activities.
The Kafue flats is approximately 6,035 km2; comprising 860 km2 or 17 %, (combined area for Lochinvar 410 km2 and Blue Lagoon 450 km2) and 5,175km2 (83 %) of the Kafue Flats GMA (Figure 2).
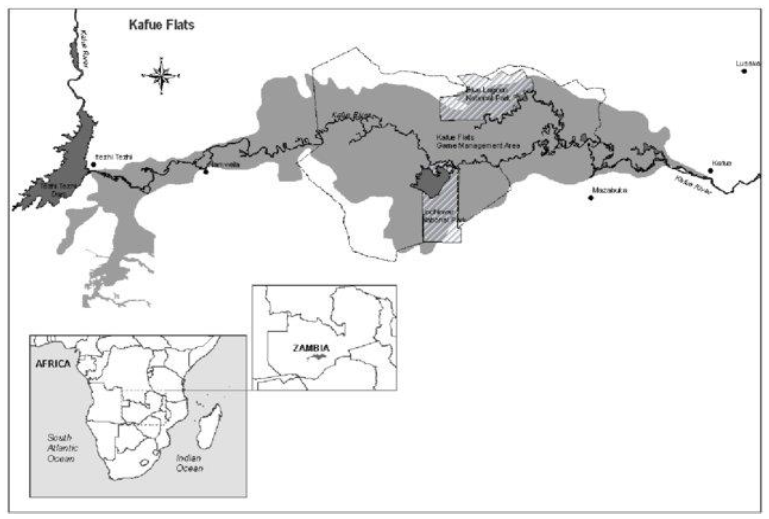
Figure 2: Location of Kafue Flats, habitat for the endemic Kafue lechwe (Kobus leche kafuensis), Zambia
Data collection in this review paper involved two approaches:
a visit to the National Archives in Lusaka and the National Parks and Wildlife library for an intensive desk review of all the population data collected from previous surveys since 1931
intensive review and critique of internal reports from Department of National Parks and Wildlife Service, Zambia Wildlife Authority and Department of National Parks and Wildlife as well as survey reports facilitated by the World-Wide Fund for Nature (WWF), Zambia Country Office in Lusaka.
Review of the survey methodology used in 2005 and 2015, which were in my view more comprehensive and covering a larger area and also included the survey of cattle herds and fishing camps, factors that were omitted in other surveys. Like in the previous surveys for instance, the 2005 survey also used an aerial stratified random sampling technique using a fixed high wing Cessna 206 aircraft, a method consistent with the previous surveys. The technique used in this survey is similar to the one described by Bell et al. [4] for lechwe census, subsequently improved and used by Howard, Jeffery and Grimsdell [8] when estimating black lechwe population of the Bangweulu Swamps in 1983. The 2005 survey was further improved by, observers writing animal sightings on each side of the plane in a note book and later entered into a desk top computer at the base camp. Global Positioning System (GPS) was used and the Geographical Information System (GIS) was also used in mapping the spatial distribution of animals, fishing camps, and cattle herds.
Observations by both observers (left observer and right observer) included recording; cattle and fishing camps, incidents of fire as these also had an impact on the habitat quality and lechwe population in general. To take note of the official forms of mortality, data on trophy and meat hunting for the period before and 2005, specifically up to 2014 were also collected from ZAWA licencing office as this is a form of mortality which may if not properly managed by way of unsustainable quotas or not monitoring hunters in the field have a negative impact on lechwe population increase.
In both surveys GPS coordinates of areas of occurrence of lechwe herds were taken and used to identify, stratify, and draw strata boundaries based on density distribution. The strata then being classified as low, medium and high. This reduced variance of the total area when the individual strata are combined, thereby making findings and estimates more accurate, precise and reliable. North - South bearing transects were flown in each population density stratum in the north and south banks of the Kafue River.
The 2005 utilized a sampling intensity of 20% which was good enough as it is an open area and this provided an opportunity of maximizing searching effort, area coverage and reliability of data collected.
A Cessna 206 fixed high wing aircraft was used (Figure 3) as in many other surveys in the area.
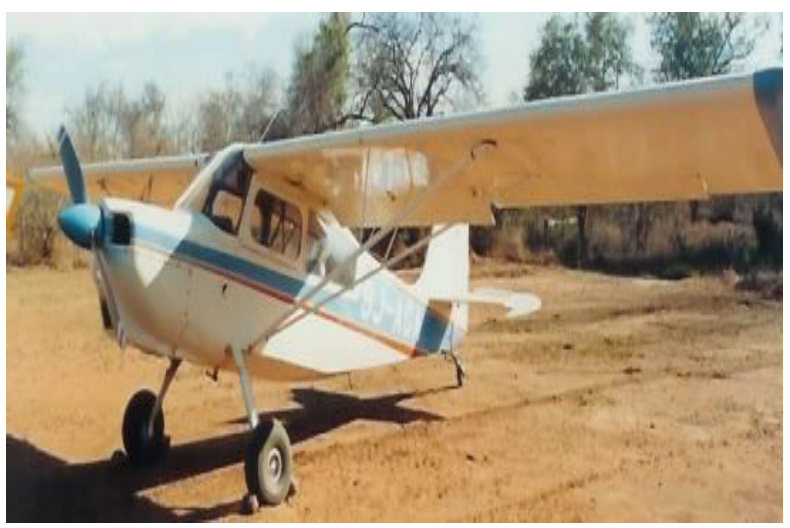
Figure 3: Fixed high wing aircraft with wing struts for attaching streamers suitable for aerial surveys, Kafue Flats, Zambia
The aircraft was fitted with a Radar Altimeter and survey crew consisting of; one pilot, one navigator, two observers, and one GIS specialist/data recorder. As a standard approach, two observers counted animals within the swathes one on each side of the aircraft. The two observers were considered to be mutually dependent and observations were treated as coming from a single transect just as the area covered on the ground on each side of the aircraft was also combined as if it were one strip.
In both surveys reviewed, the location of coordinates for all transects were entered into a GPS each day before taking off from the base and used for navigation when flying. Transects were flown at an average speed of 150 km/hour a speed good enough to allow the observers to locate identify and count. The nominal (theoretical) height was 61 m a.g.l which was low enough for improved.
visibility but also high enough for the pilots maneuverability and safety. As a standard practice, while flying along the transects, observers kept their heads in a constant position with reference to a masking tape marking on the window to avoid parallax error. Observers recorded the species and number of animals seen and were reminded by the navigator every two minutes to block the counts to facilitate plotting of animal densities. All lechwe, sighted between the streamers were counted and recorded. Extraordinarily large herds were photographed. Time of counting was set in such a way as to avoid exhausting observers which may introduce error.
The data analysis followed the standard method using a special software package for wetland areas as described by Bell et al. [4] which is based on Jolly’s [5] and the parameters were calculated as follows:
Y (i) = ΣNiYi Where;
Ni = the total number of units in the i th stratum,
Y(i) = the estimate of the population size,
Yi = the average number of animals per unit over the number of units sampled per stratum.
The standard error of Y(i) = √variance (Y (i))
Where;
Where r is the exponential rate of increase or decrease, and e is the base of natural logarithm taking the value 2.7182817 and t is the time between the censuses. The exponential rate of increase being calculated as; r = ln (Nt/No)
Cattle - Lechwe Metabolic Ratios
The comparison of cattle and lechwe metabolic ratios were based on Kleiber's law, Holling’s disk equation and Marginal Value Theorem, where metabolic rate (q0) of an animal is the mass of the animal (M) raised to the 3/4 power: q0 = M3/4 (or raised to 0.75). The importance of this calculation is analyzing the potential competition for forage on the Kafue Flats between lechwe and the larger herds of free ranging cattle. In Kleiber’s equation, the mass of the animal increases at a faster rate than the metabolic rate, which then explains the relationship between the size of the animal and the feeding strategy it uses. In this case cattle (about 500kg) versus lechwe (about 120kg). If the food eaten is reasonably the same, such as cattle and lechwe, the ratio of their metabolic weight gives the exchange ratios between the two species and would be used to interpret the potential competition between the two species. In order to get the metabolic size of cattle and lechwe, the weight of one cow was assumed to be equivalent to one animal unit (450/500 kg), and the weight of lechwe was obtained from literature as being about 120 kg [6]. Weight in kilogrammes for each species being raised to the power of 0.75 or ¾ (Kg 0.75). It is on this basis that the metabolic equivalents are calculated.
Analyzing the Population Estimates
The population estimates for the period 1931 – 2005 showed a precipitous populating decline of 85% from the 1931 estimate of 250,000 (Table 1; Figure 4), which is comparable to model (d) in Figure 5.
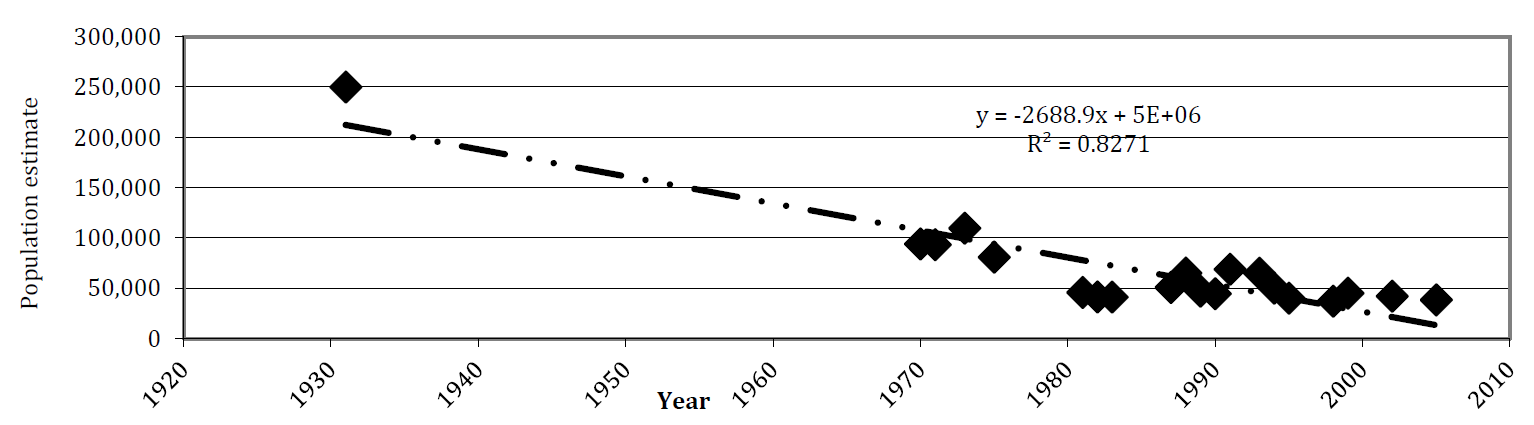
Figure 4: The precipitous decline of the Kafue lechwe (Kobus leche kafuensis) on the Kafue Flats, Zambia
Source: Chomba, et al. [2]
Table 1. Kafue Lechwe Population Trend Analysis for The Period 1931 To 2005, Kafue Flats, Zambia [3]
Year | Population Estimate | Source | Expected Overall Mean (Before and After the Dam) | Difference Between Estimate and Overall Mean | (%) Remaining of the 1931 Estimate |
1931 | 250,000 | Pitman, 1934 | 68,714 |
|
|
1970 | 94,075 | Bell et al. 1973 | 68,714 | 25,361 | 38.00 (62% loss) |
1971 | 93,215 | Bell, et al. 1973 | 68,714 | 24,501 | 37.28 |
1972 | 93,158 | Bell et al. 1973 | 68,714 | 24,444 | 37.26 |
1973 | 109,612* | Osborne et al. 1973 | 68,714 | 40,898* | 43.84* |
1975 | 80,774 | Osborne et al. 1975 | 68,714 | 12,060 | 32.30 |
1981 | 45,867 | Howard et al. 1983 | 68,714 | -22,847 | 18.34 (82% loss) |
1982 | 41,345 | Howard, et al. 1983 | 68,714 | -27,369 | 16.00 |
1983 | 41,155 | Howard et al. 1983 | 68,714 | -27,559 | 16.00 |
1987 | 50,715 | Howard, et al. 1987 | 68,714 | -17,999 | 20.28 |
1988 | 65,018 | Howard, et al. 1988 | 68,714 | -3,696 | 26.00 |
1989 | 47,145 | Jeffrey, et al. 1988 | 68,714 | -21,569 | 18.85 |
1990 | 44,538 | Jeffrey, et al. 1990 | 68,714 | -24,176 | 17.81 |
1991 | 68,872 | Jeffrey, et al. 1991 | 68,714 | 158* | 27.54 |
1993 | 64,940 | Kapungwe, 1993 | 68,714 | -3,774 | 25.97 |
1994 | 50,000 | Jeffrey, 1994 | 68,714 | -18,714 | 20.00 |
1995 | 40,000 | Tembo, 1995 | 68,714 | -28,714 | 16.00 |
1998 | 37,120 | Kampamba, et al. 1998 | 68,714 | -31,594 | 14.84 |
1999 | 45,000 | Kampamba, et al. 1999 | 68,714 | -23,714 | 18.00 |
2002 | 42,000 | Kampamba, et al. 2002 | 68,714 | -26,714 | 16.00 |
2005 2015 | 38,448 28,660 | Chansa & Kampamba Shanungu & Kaumba | 68,714 68,714 | -30,266 -40, 054 | 15.00 (85% loss) 11 (89%) |
(Original data from Chomba, et al. [2])
shows almost perfect regulation to the equilibrium level with only minor fluctuations about k
shows less accurate regulation at first but gradually the equilibrium level is reached and then maintained
shows that perfect regulation is never achieved; instead, the population shows a constant cycle of change, oscillating with k in a regular way. (This is called a stable limit cycle); and
shows an extreme case of failure to regulate; the population overshoots k so much that k itself is reduced and eventually the population plunges itself to extinction, [7]
Three distinct strata or phases are observed:
the first significant decline observed by 1970 when only 30% of the 1931 population remained
the second in1981 which was two years after the commissioning of the Itezhi-Tezhi dam in 1979 when only 18% of the population remained and
in 2005 when there was a loss of 85% of the original population (Figure 5)
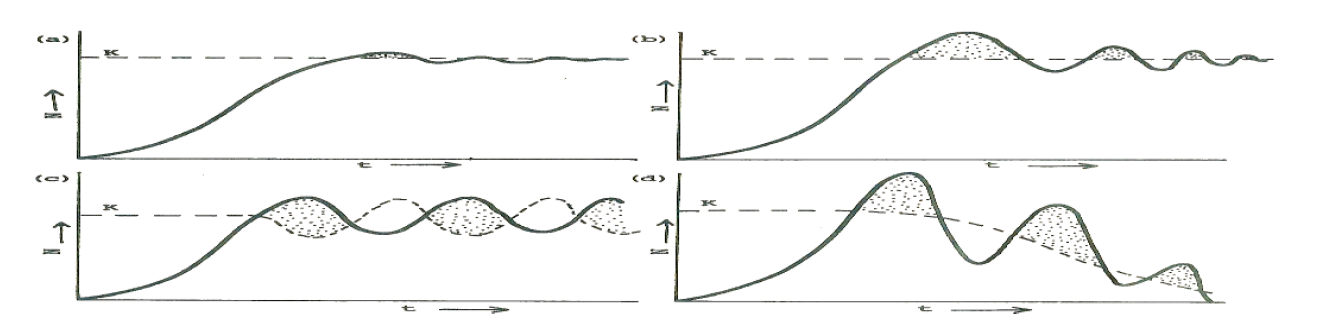
Figure 5: Models of Population Regulation
We considered this estimate as a turning point at which drastic measures to save the population should have started. The slope signifying decline has steepened (Figure 4 and 6). By the 1970s, the population had stabilized around 100,000, the differences of which were in part attributed to counting error or improvements made to the flight procedures, types of aircrafts, counting and data analysis. In 1981 commissioning the Itezhi – Tezhi Hydroelectricity dam, the population declined to about 50, 000 (a proportion of 0.4) until 1994 and to 40,000 by 1995. In 2005, the turning point, the loss reached 85% of the 1931 estimate. The population’s overall mean of 68,714 individuals was however surpassed in 1984 (Table 1). The regression equation shown in Figure 4 gives a slope of b = –2, 699.9, which implies a net loss of (–2, 688.9 individuals each year or seven individuals on a daily basis (–2, 688.9/365 = 7 individuals) giving an annual decline of 1.05%. If 1931 is taken to be the starting population, then in 1970 when the second survey was carried out, the proportion remaining was about 0.4 (Figure 4), which declined again to below 0.2 in 2005 and might have declined further by now.
Comparison of the Population before and After Dam Construction
Many reports attribute the significant losses in population to the construction of the Itezhi-Tezhi dam and its accompanying alteration of the flooding regime which has been reported to contribute significantly to reduction of lechwe habitat. A comparison was therefore made between the era before and after the construction of the dam. The first significant decline is recorded after the construction of the Itezhi-Tezhi dam in 1979 after which only an average of 20% of the 1931 estimate survived. Mann Whitney U test showed a significant difference between the lechwe population estimates before and after the construction of the dam (U 0.05 (2) 6, 15 = 71, P<0.001, (see Table 1; Figure 6).

Figure 6: a) Comparison of Lechwe Population Estimates and Proportion of The First Estimate Before Construction of The Itezhi -Tezhi Hydroelectricity Dam 1931-1979, And After Commissioning the Dam 1980 - 2005, B) Population Trends for The Period 1931 – 2005.
Source: Chomba, et al. [2] [Populations estimates before and after the Itezhi tezhi dam are shaded differently]
This comparison of population estimates before 1979 and after the construction of the Itezhi-Tezhi dam disrupted the flooding regime and resulted into a significant difference in the lechwe population (Table 1). By the 1970s, the population had stabilized around 100,000. Soon after commissioning the Itezhi – Tezhi dam the population declined to about 50, 000 until 1994 and to 40,000 by 1995, which is below the carrying capacity K of 100,000. The downward trend has continued to about 38,000 recorded in the 2005 study. The population’s overall mean of 68,714 individuals was however surpassed much earlier in 1984 (Table 2).
Table 2. The Mann-Whitney U Test for Comparison of Kafue lechwe numbers estimated before and after the Itezhi tezhi dam, Kafue flats, Zambia
Population Estimates before Dam Construction | Population Estimates after Dam Construction | ||||
Year | Population estimate | Rank | Year | Population estimate | Rank |
1931 | 250,000 | 1 | 1981 | 45,867 | 13 |
1970 | 94,075 | 3 | 1982 | 41,345 | 17 |
1971 | 93,215 | 4 | 1983 | 41,155 | 18 |
1972 | 93,158 | 5 | 1987 | 50,715 | 10 |
1973 | 109,612 | 2 | 1988 | 65,018 | 8 |
1975 | 80,774 | 6 | 1989 | 47,145 | 12 |
- |
| R1 = 21 | 1990 | 44,538 | 15 |
- | Mean = 120,139 | n1= 6 | 1991 | 68,872 | 7 |
- | - | - | 1993 | 64,940 | 9 |
- | - | - | 1994 | 50,000 | 11 |
- | - | - | 1995 | 40,000 | 19 |
- | - | - | 1998 | 37,120 | 21 |
- | - | - | 1999 | 45,000 | 14 |
- | - | - | 2002 | 42,000 | 16 |
- | - | - | 2005 | 38,448 | 20 |
- | - | - | - | - | R2 = 210 |
- | - | - | - | - | n2 = 15 |
- | - | - | - | Mean = 48,144 |
|
U 0.05 (2) 6, 15 = 71, P < 0.001, Source: Chomba, et al. [2]
These results do not however, exclusively attribute all the losses to the impact of the dam, there could be other reasons through these calculations suggest the impact of the dam to be a significant factor (Table 1).
Distribution
The surveys until 2005 showed a skewed distribution in favour of the North bank and secondly around Blue Lagoon and Lochinvar National Parks. This in a way, tended to avoid areas with heavy human encroachment in form of fishing camps and cattle grazing areas in the past. This pattern has since not changed, although the north bank is within approximately 100km from Lusaka the capital city and hence more prone to poaching incursions. Given the weak law-enforcement strategy, the threat will continue to be a source of concern and one of the factors to be included in the rising mortality of lechwe.
Number of Lechwe Hunted
The mean number of lechwe hunted for the period 2006 – 2014 was 432 for resident hunters and only 35 for non-resident /Safari (Table 3).
Table 3. Number of Lechwe Hunted under Resident and Nonresident/Safari for the Period 2006- 2014, Kafue Flats, Zambia.
Year | Hunting quota | Total | |
| Resident | Non-Resident (Safari) |
|
2006 | 580 | 31 | 611 |
2007 | 484 | 61 | 545 |
2008 | 605 | 52 | 657 |
2009 | 879 | 29 | 908 |
2010 | 217 | 28 | 245 |
2011 | 644 | 49 | 693 |
2012 | 482 | 44 | 526 |
2013 | 0 | 6 | 6 |
2014 | 0 | 12 | 12 |
Total | 3,891 | 312 | 4,203 |
Mean | 432 | 35 | 467 |
Daily loss (/365) | 1.18 | 0.09 | 1.27 |
Source: Zambia Wildlife Authority Licencing Office, 2015
A combination of the two off-take quotas had a collective loss of only one lechwe/day for which resident hunting was responsible for 93% of the daily single loss. Thus given 7 losses of lechwe per /day, (based on slope of b = (–2, 688. /365 = 7 individuals), legal hunting only took away one lechwe per/day and the other six were attributed to poaching and other factors. The major weakness through is the weak law-enforcement and monitoring of hunting suggesting that the number harvested could be much higher than the figures shown in Table 3. There has been and continues to be a dispute of whether hunting should continue or cease. Whatever decision the management agency may take, may not wholistically address the current drastic losses. A more science based comprehensive strategy is required.
Reduction of Lechwe Range Resolving the Conundrum
The Kafue lechwe foraging range has declined, being restricted to areas close to and between Lochinvar and Blue Lagoon National Parks. The north bank, mainly the area between Blue Lagoon and the Kafue River eastwards towards the Kafue Sugar Plantation is currently where most of the lechwe are concentrated, and inevitably the most important lechwe range as it also the area with minimal human disturbance a factor also recorded in 2005 survey by Chansa and Kampamba [3,]. This observation represents a significant reduction in the distribution range for Kafue lechwe recorded by Howard et al. [8], at which time the lechwe covered the whole area shown in Figure 2.
In this matter, it may be inevitable to consider other options including taking the species to other Agroecological regions where it never existed because the species has no natural dispersal area. Although a dichotomy exists for conservation-oriented translocations regarding the release of organisms into known historic ranges on one hand and releases outside historic distributions on the other. In this case of the Kafue lechwe it may be absolutely necessary to redeem the species by taking to areas where safety is guaranteed even if it may be outside the Kafue flats. Zambia has many large wetlands where these trials can be done.
That is why in this article we emphasize the need to consider various options. It is absolutely necessary for the conservation agency to consider moving away from the dictates and restrictions imposed by the historical species distribution requirements, toward the inclusion of more risky interventions that will be required to respond to habitat loss due to anthropogenic impacts particularly loss of grazing land to cattle, poaching, fishing camps and many more. These coupled with the unknown negative effects of climate change should compel the conservation community to take action now. Attempts may also be made where feasible to consider efforts towards restoring the ecology and active ecological community re-construction.
Cattle Populations Addressing the Challenges
In 2005 an upper limit of the cattle population was 18,841 with a metabolic equivalent of 56, 523 lechwe, that outnumbered the lechwe population of 38, 448 individuals (Figure 7). The Kafue flats hold some of the largest herds of cattle under traditional free ranging system. Although some households may hold large herds the management system is still at subsistence level. In such a system, it is difficult for communities and the state to agree on the best way of sharing pasture. Communities feel the state is an invader on their land, while the law allows multiple use of the area as a Gama management area (GMA).
Figure 7. A Comparison of Cattle and Lechwe Estimated Population and Their Metabolic Biomass Equivalents, Kafue Flats, Zambia
Source: Chomba et al. [2]
Population Status
The 2015 survey results show that the lechwe population has declined from 250,000 in 1931 to an estimated 28,660 (+/). Traditionally scientists and managers have attributed these losses to the Itezhi -tezhi dam construction and altering of the flooding regime which may have caused habitat transformation. Although Sayer and van Lavieren [9,10]; Schuster [11-13] and Rees [14] argued that the alteration of the flooding regime could disrupt the lechwe breeding behaviour and social organization. We agree with this assertion, since lechwe depends on floods for the lek system, a reproductive behaviour developed over a very long period of time. Sayer and van Lavieren [10] further predicted that the area flooded will be reduced thereby reducing the carrying capacity and a large reduction of the size of the population of lechwe was expected as a result of the construction of the dam. This prediction was also correct as the current results show a sharp decline after 1980. According to Rees [14,15] the future of lechwe population was bleak because the Itezhi-Tezhi dam would reduce the flood regime affecting plants and modifying herbage available to the lechwe. While this is a scientific fact that may not be disputed for now, one would have expected the population to have stabilized at a lower carrying capacity for instance of about 100,000 which was not the case. We agree with Kapungwe’s [16] standpoint which was that the altered flooding regime did not contribute significantly to the population decline; he attributed the decline to poaching alone. Despite this view, the lechwe population decline was sharp after the commissioning of the dam in 1979 and every scientist agrees with this (Figure 4, Table 1 and 2) because the population changed from 80,774 in 1975 to 45, 867 in 1981 representing a loss of greater 44%.
However, given the subsisting statics and poor management of the protected area, the construction of the dam, should no longer be the main factor, because it was a one-off incident although some of its effects may continue in the future although the degree of such effects may not be easy to measure. Since then, there have been new anthropogenic factors; fishing camps that were previously seasonal and temporary are not permanent settlements with fishers demanding for social amenities such as health centers and schools; cattle herds have increased with increase in human population; invasive species such as Mimosa pigra have taken away portions of the pasture land for lechwe and cattle.
If this is true, then lechwe population estimates of 68,872 in 1991 and 64, 940 in 1993 were over estimates. This is because it would not be possible to have an increase of 24,000 individuals in a single year in an area where poaching is the main factor in population decline as noted and acknowledged by Kapungwe [16]. The increase of 24,000 per single year cannot be explained and hence discounted. It is also difficult to explain the loss of 15,000 individuals in a single year between 1993 and 1994 as reflected in Table 1. Kampamba et al. [17] noted a further decline from the 1980s to the 1990s during which time the population fluctuated between 40,000 - 45, 000. This further confirms that the estimates for 1991and 1993 are likely to have been over estimates. It is in this line of thought that the 2005 estimate of 38, 448 confirm this population decline and we considered it as the turning point for the lechwe signifying the need to call for immediate attention from authorities. Reasons given by Shanungu and Chaka [18] in the ZAWA internal report of Mimosa pigra as one of the major factors in the current population decline is for now discounted because, while the invasive alien species poses a major threat for the future, the current area covered by Mimosa pigra is outside the key lechwe distribution and foraging range which according to the 2005 is in the north bank. This argument to discount the impact of Mimosa pigra does not in any way suggest that the alien species should not be eliminated, but rather to discount it for now as one of the major causal factors for the precipitous decline in lechwe population and perhaps even lower by now.
The declines detected in the population, signal the need for government to take action at its earliest convenience. It is relatively much easier to address the species’ decline while the numbers are still reasonably abundant than waiting until the species is in few hundreds at which time the stochastic problems characteristic of small populations step in.
The population performance shown in Figure 5 (d) is indicative of signs of failure to regulate based on the population models provided by Sinclair and Grimsdell [7]. If no action is taken the lechwe may eventually plunge to extinction (Figure 5b). Increased herds of cattle under subsistence management regime is a major anthropogenic factor that should be cautiously tackled as mishandling of the matter may evoke calls to have the GMA degazetted.
The issue of permanent fishing camps is within the ambits of government through the department of fisheries. The granting of permits to fishers may need to be strictly monitored. It may require combined effort with the Department of National Parks and Wildlife because the presence of former in the field is virtually absent and the monitoring division of the department (DOF) is equally weak.
Cattle - Lechwe Metabolic Ratios
Cattle having a larger body size has a comparative advantage over lechwe and since lechwe is seen as the property of the state, it is likely that communities may opt to have lechwe exterminated so that they can retain the entire Kafue Flats for cattle grazing. This would be catastrophic.
It may be necessary for government to institute intervention measures which reduces cattle’s dependency on natural pasture. Currently, all cattle keepers practice the traditional and subsistence open range grazing. Government can mobilize its staff in different ministries to help transform cattle management regime in the area. For instance, can grow pasture, in which in case they would need a reliable water supply to irrigate the pasture. Farmers can through extension services be taou8ght how to grow lucerne (Medicago sativa) a deep-rooted perennial pasture legume which is highly nutritious and well adapted to mixed farming systems. Additionally, farmers can also be taught to make hay and silage.
Silage would ensure that cattle would have nutritious fodder during the dry season when pasture is scarce. Silage, is better than hay, because it preserves nutrients increasing the potential yield of nutrients from available land, decreases feed costs, lowers harvest losses and increases forage quality. This may reduce the need for free ranging.
Viewed from this angle, the farmers may need to transform from subsistence to mechanized management systems. If this is not considered as an option, disputes may arise among pastoral communities in future when the human population increases beyond current levels, and cattle numbers increase the Kafue Flats may not be adequate to meet needs of every farmer.
Recommendations
There is no doubt based on the current population estimates that urgent action is needed to save the Kafue Lechwe. We suggest some of the action points as follows:
Strengthen law-enforcement activities on the Kafue Flats by having optimal staffing levels at Lochinvar and Blue Lagoon, with appropriate land, water and air transport, field equipment and other equipment for boots on the ground
Consider where feasible the use of drones for monitoring
Engage cattle keepers to transform the cattle management system from subsistence and open range to a mechanized system
Encourage the making of hay and silage by the communities to minimize their direct dependency on natural pastures so that they can prepare hay and make silage for their animals and reduce the dependency on natural pastures
Consider working with the private sector to secure some lechwe herds on their private properties on behalf of the state
Consider out of range but within Zambia stocking of other wetlands where security is guaranteed as a form of assisted colonization of the species in other habitats (wetlands) away from the Kafue Flats [19]
Acknowledgment
We wish to thank most sincerely Mr. Chaka Harrod Kaumba for his artistic talent in preparing the maps. Dr. George Kampamba for calibrating the and setting streamers on the light aircraft during the 2005 aerial survey.
Conflict of Interest
The authors of this article declare no competing professional or personal interests to affect the results/ findings or the validity of this research publication.
Pitman, C.R.S. A Report on a Faunal Survey of Northern Rhodesia with Special Reference to Game, Elephant Control and National Parks. Government Printer, Livingstone, 1934.
Chomba, C. et al. “An Updated Population Status of the Endemic Kafue Lechwe (Kobus leche kafuensis) on the Kafue Flats, Zambia for the Period 1931–2015.” Global Journal of Biology, Agriculture and Health Sciences, vol. 4, no. 3, 2015, pp. 154–164.
Chansa, W. and G. Kampamba. “The Population Status of the Kafue Lechwe in the Kafue Flats, Zambia.” African Journal of Ecology, vol. 48, 2009, pp. 837–840.
Bell, R.H.V. and J.J.R. Grimsdell. “The Persecuted Black Lechwe of Zambia.” Oryx, vol. 12, 1973, pp. 77–92.
Jolly, G.M. “Sampling Methods for Aerial Census of Wildlife Populations.” East African Agriculture and Forestry Journal, vol. 34, 1969, pp. 46–49.
Skinner, J.D. and H.N. Smithers. The Mammals of the Southern African Subregion. University of Pretoria, 1990.
Sinclair, A.R.E., and J.J.R. Grimsdell. Population Dynamics of Large Mammals. African Wildlife Foundation, Nairobi, 1982.
Howard, G.W. et al. “Census and Population Trends of Black Lechwe in Zambia.” African Journal of Ecology, vol. 22, 1984, pp. 175–179.
Van Gils, H. Environmental Profile, Western Province, Zambia. International Institute for Aerospace Survey and Earth Sciences (ITC), Enschede, 1988.
Sayer, J.A. and L.P. Van Lavieren. “The Ecology of the Kafue Lechwe Population of Zambia Before the Operation of the Hydroelectric Dams on the Kafue River.” East African Wildlife Journal, vol. 13, 1975, pp. 9–37.
Schuster, R.H. “The Social Organization of the Kafue Lechwe.” Development and Ecology in the Lower Kafue Basin in the Nineteen Seventies, edited by G.W. Howard, University of Zambia, 1977.
Schuster, R.H. “Will the Kafue Lechwe Survive the Kafue Dam?” Oryx, vol. 15, 1980, pp. 476–489.
Schuster, R.H. “Reproductive Social Organization of Kafue Lechwe: Implication for Management and Survival.” Proceedings of the Fourth Regional Wildlife Conference for Eastern and Central Africa, National Parks and Wildlife Service, Lusaka, 1976.
Rees, W.A. “The Ecology of Kafue Lechwe.” Journal of Applied Ecology, vol. 15, 1978, pp. 167–217.
Rees, W.A. “Do the Dams Spell Disaster for the Kafue Lechwe?” Oryx, vol. 14, 1978, pp. 231–236.
Kapungwe, E.M. Carrying Capacity and Management of the Kafue Lechwe (Kobus leche kafuensis) in the Kafue Flats, Zambia. MSc thesis, University of Zimbabwe, 1993.
Kampamba, G. The Ecology of the Kafue Lechwe (Kobus leche kafuensis): The Influences of Resource Limitation, Disease and Poaching on Population Regulation. MSc thesis, University of Zimbabwe, 1998.
Shanungu, G. and C.H. Kaumba. Aerial Survey Report for the Kafue Flats. Zambia Wildlife Authority, Chilanga, 2015.
Seddon, P.J. “From Reintroduction to Assisted Colonization: Moving Along the Conservation Translocation Spectrum.” Restoration Ecology, vol. 18, no. 6, 2010, pp. 796–802.
