Climate change in Rwanda is a great challenge resulting from increased temperature and causing abnormal variability in weather variables and threatening the socio-economic welfare of human beings. Water resources have been subjected to degradation and pollution due to intensive and frequent rainfall that have negatively impact on water abstractions in their proximity. This study aimed at analyzing the vulnerability of the Nyabarongo river water abstraction to climate change. GIS and remote sensing were used to map and analyze possible changes in geophysical status of the river. Secondary data collection on temperature and rainfall for a forty years period was used to analyze the trend in climate change in Rwanda. The results indicated that climate change in Rwanda has resulted in extreme weather events that resulted in inundations and floods of Nyabarongo river and its wetland that exacerbated the changes in geophysical status such as river flow pathway and meandering. This has resulted in washing away of some water abstraction facilities around the river and the distancing from such facilities leading to interference with abstraction. It was also found out that dry seasons markedly diminished water available for abstraction in the river and impacting negatively on the groundwater recharge. The findings can stimulate decision makers in water resources management to initiate and roll out similar studies countrywide and serve as baseline to adopt measures and strategies for the sustainable management of the resources. The findings also call for Water users to take into consideration of climate impacts during the studies, designs and implementation of water use project for the sustainable exploitation of water resources.
Keywords
Climate Change
Water Resources
Vulnerability
River Morphology
INTRODUCTION
Climatic extremes with adverse effects on ecosystems include droughts, flooding, hail storms, heat waves and frost or their combinations [1]. Increased frequency of climatic extremes has significant effect on structure, functions, land use patterns and livelihoods in agroecosystems [1,2]. Rainfall is the most important limiting factor in East Africa [3] since it determines availability of soil moisture required for potential productivity. Additionally, Increased temperature will result in increased crop stress and crop water needs, with potential impacts on food security. Previous studies have assessed the impact of climate variability through the changes in precipitation and where discharge of some African river basins ranged in -50 to 100% and -100 to 200% for discharge due to changes in precipitation [4].
Uncertainty surrounding the magnitude of climate change impacts remains high and Rwanda is not exceptional to these changes [5]. Water resources in Rwanda occupy a total of 135,000 ha or 8% of the country’s surface area. These include 101 lakes (1,495 km2), 861 rivers totaling 6,462 km and a network of disconnected wetlands [6]. Ground water accounts for 4.554 billion m3, rain water for 27.5 billion m3 per annum, where ground water recharge is about 4.5 billion m3 per annum. Total renewable water is 6.8 billion m3 per annum while Renewable water availability per capita is 670 m3 and artificial water storage is 2.5 m3 [6-8]. Nyabarongo is the longest River crossing all provinces in Rwanda, providing water used for different purposes and is looked as a unique source to exploit for the satisfaction of the continually increasing water demand in Kigali and its peri-urban areas together with its groundwater aquifer.
The increasing demographic, socio-economic and development growth continue to put pressure on water resources by the increase in water demand for many purposes [8]. However, in Rwanda, literature indicates that the average temperature increased by 1.4°C since 1970, higher than the global average and predicted to rise by up to 2.5°C in 2050 if no action taken [6] and that the temporal variability of the rainfall in terms of intensity and frequency in some occasions has resulted in extreme events such as the floods and frequent droughts that have far reaching socio-economic impacts to the country and water resources in particular used to get increasingly polluted [6] and Meteo-Rwanda official website. The historical records indicates that Nyabarongo floodplain gets completely inundated during the rainy season where the floodwater rise can completely submerge the river, the boreholes and wetland in general [9,10].
Water resources managers and users face the challenge of incorporating uncertainty in the impacts of climate variability and climate change on hydrological responses into their decision-making process [4,11]. Since climate change may affect the water resources, this knowledge is essential for long-term planning for climate change to protect the water environment and livelihood that depend on these resources. This calls for a number of scientific investigations that can provide accurately and sufficiently baseline information that can be used by decision-makers to adopt strategies enabling the management and exploitation of water resources sustainably. This study evaluated the vulnerability of Nyabarongo river water abstraction to climate change. It is expected that the findings will provide decision makers in water resources management and water supply the baseline information for further mitigation actions.
MATERIALS AND METHODS
Study Area
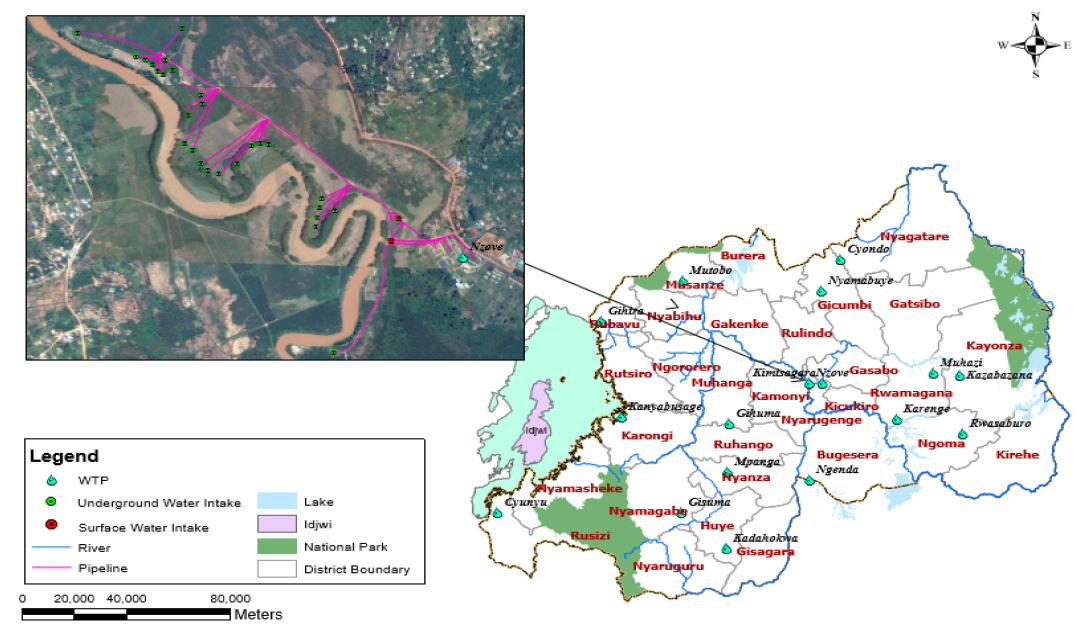
Nyabarongo is the longest river in Rwanda as it touches all the provinces along its flow pathway where it serve water for different purposes including agricultural irrigation, hydropower production, water treatment and supply, the recharge of the surrounding groundwater aquifer and a habitat for biodiversity [12]. The study concentrated on the part of the river in the Nyabarongo wetland located in Kigali city, Nyarugenge district, Kigali sector, which is currently serving both surface and ground raw water for three Water Treatment Plants (WTPs) constructed in the area and supplying water to Kigali city and its peri-urban areas. Surface water is conveyed to WTPs by two intakes while groundwater intakes consist of 31 boreholes which are designed to abstract underground water and collect in a 600 mm diameter pipeline towards another separate WTP as illustrated on Figure 1. As the area is a wetland hosting the river and which has its upstream area of hilly, sloppy and prone to erosion and sediments loads together with its proximity to the densely populated Kigali city, it has been undergoing flooding during rainy seasons which used to last for many weeks as the recent flooding of the area in April 2020 lasted around two months [2,13,14].
Data Collection and Analysis Techniques
Secondary data for temperature and rainfall for the past 40 years were obtained from Meteo-Rwanda and computed the monthly and annual averages while water level data was processed in the same way was retrieved from Rwanda water portal, an online platform of Rwanda water resources board and all these data were graphically presented to analyze the trend in variation. Geospatial data for the study area was mapped using GPS and other existing data of water infrastructures and land cover was obtained from the institutions in charge of water supply and land respectively while satellite images of the river .
Figure 1: Map Indicating the Location of Study Area on Rwanda Map, the River and Groundwater in the Study Are and the area were downloaded from Google Earth. Digitization of river flows in different periods to get the shape files of the river flow pathways and other GIS analyses for such data were performed in Arc GIS and maps were produced. Visual interpretation allowed to analyze and identify features in the study area and comparison allowed to detect changes in different periods.
RESULTS
Trend in Temperature and Rainfall
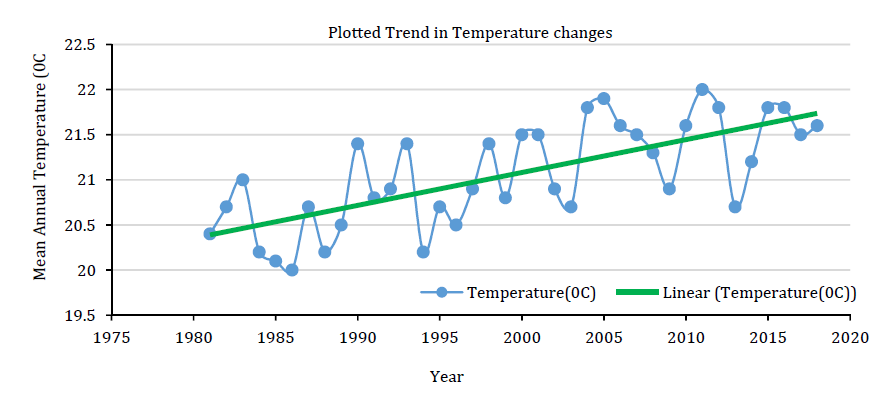
From our results, there have been remarkable changes for over 40 years which indicates possible changes in climate in Rwanda. Temperature varied between 20 and 22°C with an increasing trend. In addition, there was variability in temperature with increase or decrease with a span of five years for the entire observation period. The assessed annual temperatures over Kigali for a period between 1980 and 2018 indicate that there have been an average increase of approximately 1.4°C (Figure 2).
Figure 2: Annual Mean Temperature Changes Between 1980 and 2020
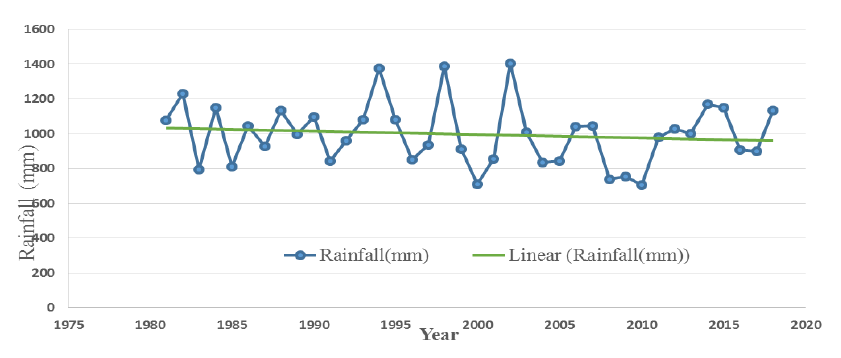
Rainfall ranged between 700 and 1400 mm during the entire period (Figure 3). The trend in rainfall changes analyzed over a period of the past 40 years indicate that Rwanda has experienced frequent and intensive rainfalls and occasioning prolonged dry periods and floods. This phenomena is likely to affect water availability for abstraction in terms of quantity and quality.
Figure 3: Annual Mean Rainfall Changes Between 1980 and 2020
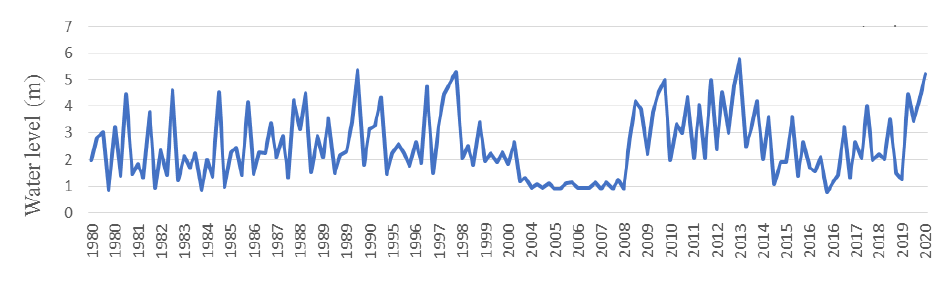
Nyabarongo river water level was characterized by overflow in intense rain periods and lower water levels in dry periods (Figure 4). Water level ranged from slightly below 1 m to slightly above 5 m. Our results indicated frequent increase in the water levels resulting in overflow (where the water level achieve 4 to 5 m) during the period of long rain season of March to May and the short rain season of October to December.
Figure 4: Variation in Water Levels of Nyabarongo River Between the Years 1980 and 2020
Detected Land Cover Changes Effects on the River between the Years 1990 and 2020
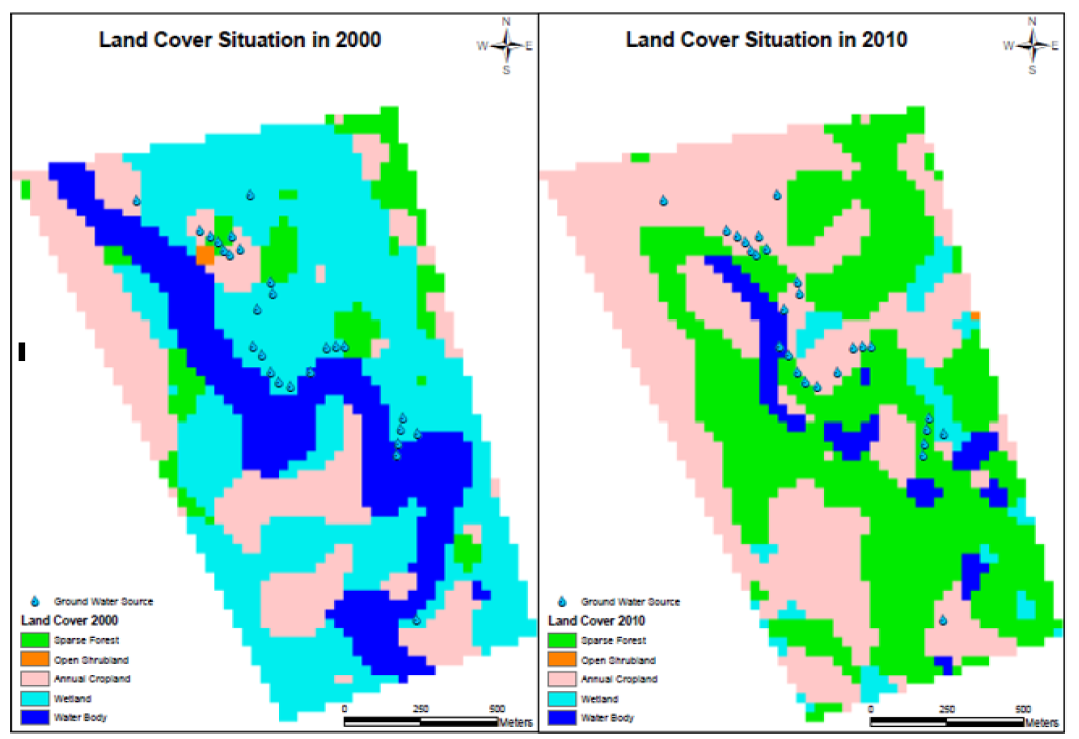
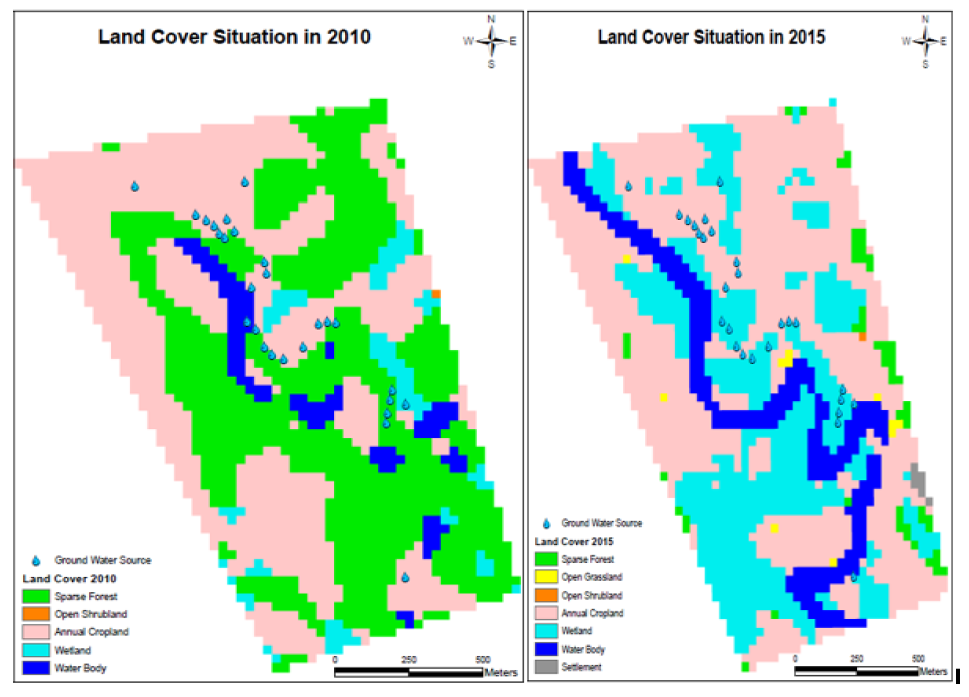
Different changes in land cover of the study area were analyzed in the interval of periods between 1190 to 2000, 2000 to 2010 and 2010 to 2015 where the map in Figure 5 was used to represent changes in land cover and the areas covered by the river were computed and generated in pivot tables represented by Table 1.
Figure 5: Map of land cover in the study area for period 2000 to 2010 and detected changes in the same period
As indicated by the map, there have been almost a total change in land cover of the area and particularly a drastic decrease in river’s coverage volume and area as well as high alteration of the initial status of the area from wetland to sparse forest between years 2000 and 2010 as also presented in Table 1.
Table 1: Land Cover Changes with Computed Areas of Each Change from 2000 to 2010
Land Cover 2000
Land Cover 2010 ( all in m2)
Row Labels
Annual Cropland
Open Shrubland
Sparse Forest
Water Body
Wetland
Grand Total in 2000
Annual Cropland
294336.6
559.5
132961.0
5808.6
10442.0
444108.0
Open Shrubland
1229.9
1162.8
1212.4
3605.1
Sparse Forest
73437.1
67791.4
13.1
4013.2
145255.0
Water Body
117579.2
231524.8
51760.0
3017.7
403881.9
Wetland
393425.8
445474.0
39869.0
72752.6
951521.5
Grand Total in 2010
880008.7
559.59
878914.1
98663.4
90225.7
1948371.6
The Table 1 generated during GIS analyses for the three mentioned periods, indicate that between 1990 and 2000 the area covered by the river reduced from 457,424.1 m2 to 403,955.9 m2, the area covered by the river changed from 403,881.9 m2 to 98,663.4 m2 as indicated by the grand total of 6th row and 7th columns of Table 1 respectively while between 2010 and 2015 there has been increase in the area covered by the river from 98,711.9 m2 of water body to approximately to 236,643.6 m2 as the result of a number of initiatives adopted to restore water resources and the natural ecosystem in general that had alarmed to be endangered.
The changes that occurred on the river include a coverage area of 68,332.5 m2 for annual cropland, 128,714.8 m2 for sparse forest and 3721.8 m2 for the wetland. The water body area of 35,874.7 m2 remained unchanged. On the other hand, the area of the river that was occupied by other land cover included 26391.4 m2 which changed to annual cropland, 761.8 m2 to open grassland, 78.2 m2 to sparse forest, 35605.7 m2 to wetland while 35874.7 m2 remained unchanged.
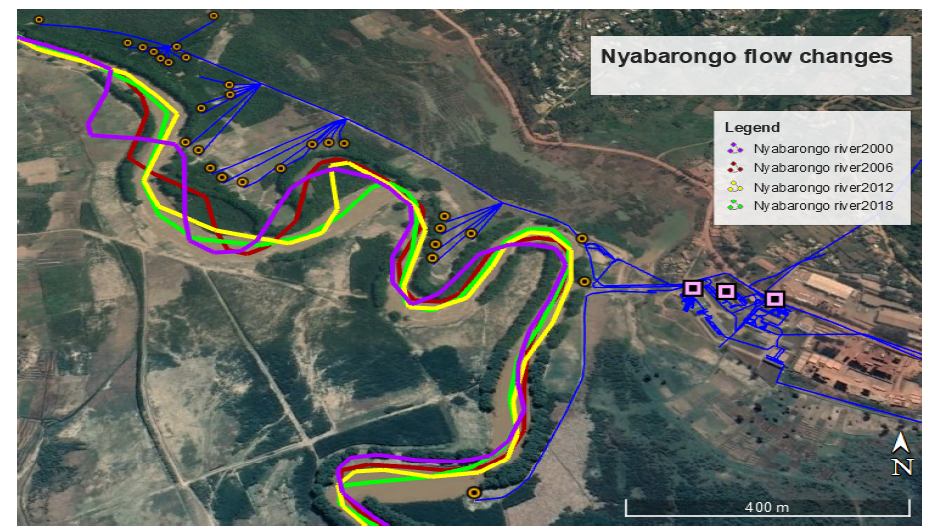
Figure 6 indicates that Nyabarongo River has been subjected to changes in its morphology in different periods as consequences of exposure to weather extreme events which have led to significant changes in the river flow pattern.
Figure 6: Detected Changes in River Morphology in the Study and Impacts on Water Extraction
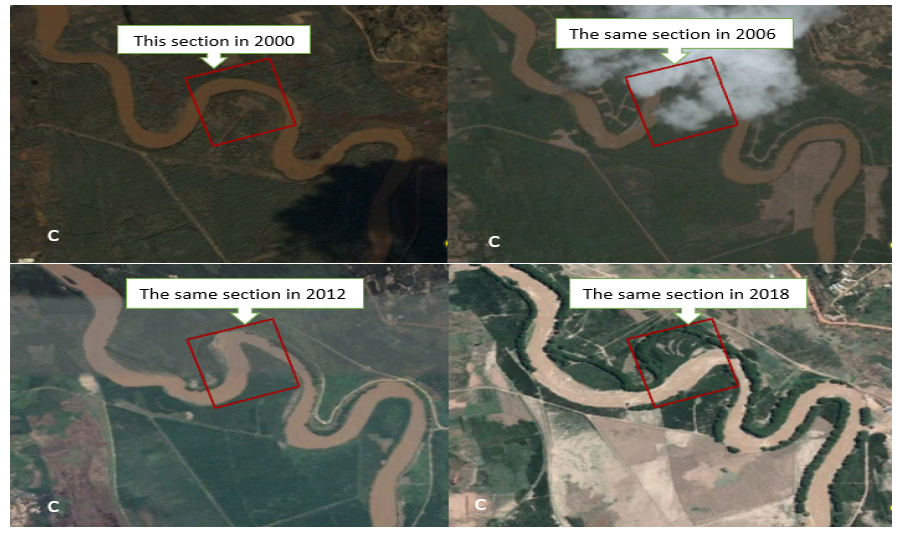
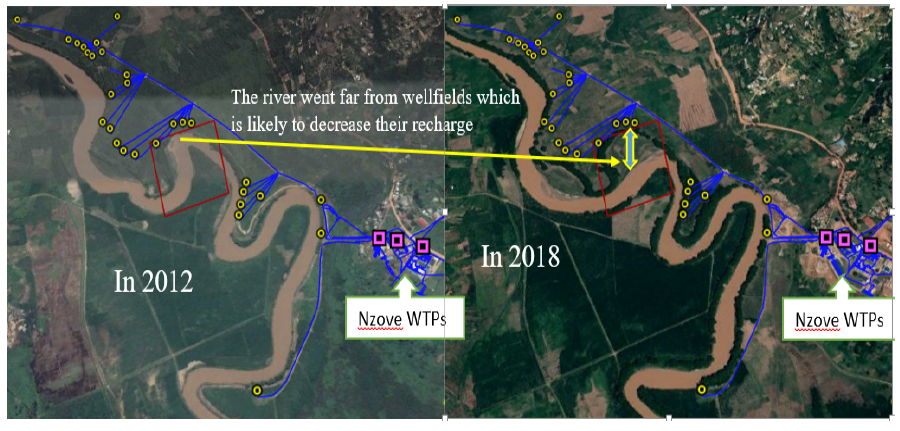
The changes in the river’s morphology indicated by Figure 7 resulted in the strong changes of different specific parts of the river especially the meanders where Figure 8 is used as an illustrative example but the two previous meanders of the river visible on this figure have undergone similar changes. Similarly, Figure 9 indicates effects on meandering on the wellfield and movement of the river from original section.
Figure 7: Map of the Study Area Indicating the River Volume Reincrement after Restoration Strategies
Figure 8: Changes in Specific Parts of the River
Figure 9: Impacts of the Changes on Nyabarongo River Water Abstraction
DISCUSSION
The assessed annual temperatures over Kigali for a period between 1980 and 2018 indicated that there has been an average increase of approximately 1.4°C as indicated by the linear trend line in our data which is not far from of predictions detailed in NAPA report in terms of temperature changes projection [15]. This warming condition has resulted in climate change resulting in abnormal rainfall as indicated by our results and other associated impacts especially on water resources such as heavy erosions, floods, river overflow and droughts [7]. Previous studies found that daily minimum temperature in Rwanda had been rising [12,16], with northern part of East African region exhibiting nighttime warming and daytime cooling in recent years. Similar to our findings, previous studies have indicated that global warming can reduce the vegetation land cover by slowing plant growth, which will aggravate the water and soil loss [17]. Air temperature changes would have an effect on mineralization and nitrification by changing soil temperatures. Other studies on temperature have indicated an increasing annual mean temperature of 2.6°C for a period of nearly 40 years [2]. It is therefore imperative to conclude that warming in Kigali can be attributed to global warming in addition to the ongoing urbanization.
The trend in rainfall variability indicated a high intensity and frequency likely to cause extreme events. According to IPCC [13], several regional changes in climate are estimated to occur with global warming up to 1.5°C compared to pre-industrial levels, including warming of extreme temperatures in many regions, increases in frequency, intensity, and/or amount of heavy precipitation in several regions and an increase in intensity or frequency of droughts in some regions [13,15]. Studies have shown that Rwanda has suffered both excessive and deficient rainfall in recent years, with increasing frequency of anomalously strong rainfall that caused floods [16]. As indicated in our study, Nyabarongo river has been subjected to frequent and high increase in the water levels exceeding 3.5m as a result of intensive rainfall resulting in overflow (where the water level achieved 4 to 5 m) especially during the period of long rain season of March to May and the short rain season of October to December [18,19]. On the other side, during the long dry seasons there are risks of shortages of raw water because water level is prone to decrease up to below 1.5 m which is likely to hinder the intake and conveyance of enough raw water to the optimum volume required for abstraction.
Studies along Pearl River which is the second largest river in China have shown that Changes in runoff and sediment discharge resulted in the formation and degradation of immense areas of deltas and exerted a great influence on the environment around river mouths including those of the Pearl River distributaries [20]. This was attributed to climate change which may affect the terrestrial load of the river. Similar to Nyaborongo river, changes in runoff and water volume has strong influence on the ecosystem diversity and function. Knowledge of this is essential for long-term planning for climate change to protect the water environment and its ecology. The observed changes from wetland to sparse forest can be attributed to periods of droughts that the country has experienced in the same period where water levels in lakes and rivers countrywide markedly decreased resulting in very low hydropower production. This was evidence from the general electricity shortage in the same period around the year 2004, which certainly threatened strongly other water uses [7]. Similar analysis in the period from 1990 to 2000 and the results indicated that the period had a lot of rainfall owing to the fact that the map showed that the area was characterized by inundations which is also evidenced by rainfall and water level in the same period [18]. Heavy downpours can increase the amount of runoff into rivers and lakes, washing sediment, nutrients, pollutants, trash, animal waste and other materials into water supplies, making them unusable, unsafe or in need of water treatment [20]. Our study river has not undergone significant change as the area covered by the wetland was progressively increased. For the period beyond 2010, as indicated in our results, the study area which was almost completely degraded in terms of water quantity and area covered by the river, appeared to get gradually restored towards its initial status and this is evidenced by the increase of the area occupied by the river and the predomination of area covered by the wetland as a result of the government initiatives to protect and restore natural resources [7,10,21].
All of the reductions in the area covered by the river affected negatively the availability of water for abstraction and use for different purposes. Although there was a considerable reduction in the water level during the study period and reduction of area covered by the river, improvement of the rainfall conditions led to an increase in the volume of water mobilized by the aquifers, suggesting a progression of the underground reserves and an increase of the river flows. Natural drought tends to reduce river flow slowly and in specific seasons, whereas abstraction can cause abrupt reductions in discharge in other seasons, when differences in ambient conditions such as temperature or rainfall could result in different responses as shown in our results. Although previous studies have indicated water abstraction strongly affects hydromorphology, resulting in a much narrower wetted river channel, shallower water column and slower flow velocity [22], this study did not consider the effects of abstraction on river water quality and channel properties.
The changes in river meandering and flow pattern indicated above have serious impact on water availability for abstraction. The main consequence is either the change leading to distancing far from water abstraction facilities and leading to impossibility in abstraction or the changes leading to encroaching the facilities so that they can get permanently washed away or overflown [10,23]. This distancing can also decrease the recharge of the groundwater aquifer while the overflow may threaten water quality [14,24,25].
CONCLUSION
The present study assessed the vulnerability of Nyabarongo river water abstraction to climate change. The trends in temperature and rainfall changes analyzed indicated that Rwanda has experienced climate change that led to frequent and intensive rainfalls and prolonged dry periods. This caused heavy erosions, floods and draughts observed in the past that has affected the variability in river water levels and subsequently affecting water availability for abstraction in terms of quantity and quality. The findings also indicated that the river itself and water abstraction activities that rely on Nyabarongo river are vulnerable to climate change through the changes in river morphology such as flow pathways and meanders resulting in its distancing away from original flow-path or encroachment to the abstraction areas and facilities where the abstraction may be no longer possible. The findings of this can serve as an important tool to guide the institutions mandated for water resources management to initiate and support similar studies to be rolled out within the country in order to gather sufficient baseline information for adopting mitigation measures and strategies for sustainable water resources management. Additionally, findings from this study is also important for water users to take into consideration climate impacts during the studies, designs and implementation of water use projects for the sustainable exploitation of water resources.
Acknowledgment
The authors would like to express their thanks to all the institutions that provided data, all individuals who provided the inputs and all the riviewers that contributed to the successful completion of this study.
REFERENCE
Muthoni, F.K. et al. “Long-Term Spatial-Temporal Trends and Variability of Rainfall over Eastern and Southern Africa.” Theoretical and Applied Climatology, vol. 137, 2018, pp. 1869-1882.
Adhikari, U. et al. “Climate Change and Eastern Africa: A Review of ImpactonMajorCrops.” Food and Energy Security, vol. 4, 2015, pp. 110-132.
Niles, M.T. et al. “How Limiting Factors Drive Agricultural Adaptation to Climate Change.” Agriculture, Ecosystems and Environment, vol. 200, 2015, pp. 178-185.
Aich, V. et al. “Comparing Impacts of Climate Change on Streamflow in Four Large African River Basins.” Hydrology and Earth System Sciences, vol. 18, 2014, pp. 1305-1321.
Kemen, G.A. et al. “Impacts of Climate Change on the Potential Productivity of Eleven Staple Crops in Rwanda.” Sustainability, vol. 12, 2020, p. 4116. https://doi.org/ 10.3390/su12104116.
MINITERE. National Adaptation Programmes of Action to Climate Change-NAPA Final Report. Republic of Rwanda, 2006.
MINIRENA. Water Resources Management Sub-Sector Strategic Plan 2011-2015. Ministry of Natural Resources, 2011.
RIWSP. Sediment Fingerprint for the Nyabarongo Upper Catchment in Rwanda-Final Technical Report. Florida International University, 2016.
Ministry of Environment-Rwanda. Erosion Control Mapping Report in Rwanda. MoE, 2020.
Kabat, P. et al.Coping with Impacts of Climate Variability and Climate Change in Water Management: A Scoping Paper. DWC Report no. DWCSSO-01, International Secretariat of the Dialogue on Water and Climate, 2002.
Haggag, M. et al. “Projections of Precipitation, Air Temperature and Potential Evapotranspiration in Rwanda under Changing Climate Conditions.” African Journal of Environmental Science and Technology, vol. 10, no. 1, 2016, pp. 18-33.
IPCC. Summary for Policymakers. In: Global warming of 1.5°C. An IPCC Special Report on the impacts of global warming of 1.5°C above pre-industrial levels and related global greenhouse gas emission pathways, in the context of strengthening the global response to climate change. Geneva-Switzeland. World Meteorological Organisation, 2018.
NISR. Thematic Report on Environment and Natural Resources-EICV 5 2016/2017. National Institute of Statistics of Rwanda, 2018.
IPCC. Special Report on Climate Change, Desertification, Land Degradation, Sustainable Land Management, Food Security and Greenhouse Gas Fluxes in Terrestrial Ecosystems. WMO and UNEP, 2019.
Christy, J.R. et al. “Surface Temperature Variations in East Africa and Possible Causes.” Journal of Climate, vol. 22, 2009, pp. 3342-3356. https://doi.org/10.1175/2008JCLI2 726.1.
Li, Y. et al. “Effects of Temperature Change on Water Discharge and Sediment and Nutrient Loading in the Lower Pearl River Basin Based on SWAT Modelling.” Hydrological Sciences Journal, vol. 56, no. 1, 2011, pp. 68-83.
SEI. The Economics of Climate Change in Rwanda: Final Report. Stockholm Environment Institute, 2009.
Zhang, W. et al. “Temporal and Spatial Variability of Annual Extreme Water Level in the Pearl River Delta Region, China.” Global and Planetary Change, vol. 69, 2009, pp. 35-47.
Ministry of Environment. Upper Nyabarongo Catchment Management Plan (2018-2024). MoE, 2019.
Arroita, M. et al. “Water Abstraction Impacts Stream Ecosystem Functioning via Wetted-Channel Contraction.” Freshwater Biology, vol. 62, 2017, pp. 243-257.
WASAC. Technical Assessment and Feasibility for the Rehabilitation of Nzove I Water Treatment Plant and Its Supplying Groundwater. Water and Sanitation Corporation, 2020.
Stelma, G.N., Jr and L.J. Wymer. “Research Considerations for More Effective Groundwater Monitoring.” Journal of Water and Health, vol. 10, 2012, pp. 511-527. https://doi. org/10.2166/wh.2012.016.
Nhapi, I. “Assessment of Water Pollution Levels in the Nyabugogo Catchment, Rwanda.” The Open Environmental Engineering Journal, vol. 4, 2011, pp. 40-53.
Recommended Articles
Research Article
OBSERVATIONS ON THE HOMOGENEOUS TERNARY QUADRATIC DIOPHANTINE EQUATION x2 + 4xy + 9y2 = 21z2
Download PDF
Research Article
Machine Learning-Based Intrusion Detection for Detecting DDoS Attacks in Software-Defined Networks
Zainab Abbas Fadhil
Published: 30/06/2026
Download PDF
Research Article
Computer Driven Library Management and Service Rendering System: Mobile Library Landscape
Yekini N. A,
...
Ojo O
Published: 10/06/2020
Download PDF
Research Article
A Deep Representation Learning Framework Based on PCA-Compressed EfficientNetB0 Embeddings and Neural Spline-Based Classification for Iraqi Banknote Authentication
Saba Hussein Rashid
Published: 30/06/2026
Download PDF
PO Box 101, Nakuru
Kenya.
Email: office@iarconsortium.org
Editorial Office:
J.L Bhavan, Near Radison Blu Hotel,
Jalukbari, Guwahati-India
Manikuze, P. & Nyongesah, M. J. (2021). Vulnerability of Nyabarongo River Water Abstraction to Climate Change in Rwanda. IAR Journal of Engineering and Technology, 2(2), 1-8.
MLA
Manikuze, Prosper and Maina J. Nyongesah. "Vulnerability of Nyabarongo River Water Abstraction to Climate Change in Rwanda." IAR Journal of Engineering and Technology 2.2 (2021): 1-8.
Chicago
Manikuze, Prosper and Maina J. Nyongesah. "Vulnerability of Nyabarongo River Water Abstraction to Climate Change in Rwanda." IAR Journal of Engineering and Technology 2, no. 2 (2021): 1-8.
Harvard
Manikuze, P. and Nyongesah, M. J. (2021) 'Vulnerability of Nyabarongo River Water Abstraction to Climate Change in Rwanda' IAR Journal of Engineering and Technology 2(2), pp. 1-8.
Vancouver
Manikuze P, Nyongesah MJ. Vulnerability of Nyabarongo River Water Abstraction to Climate Change in Rwanda. IAR Journal of Engineering and Technology. 2021 Jul;2(2):1-8.



 Download PDF
 Download XML