Basement Depth Estimation for Hydrocarbon Maturation of Northeastern Part of Sokoto Basin Using Euler Deconvolution and Spectral Depth Analysis Techniques
I. Abubakar
1
,
D. S. Bonde
1
,
A. Mustapha
1
,
A. Usman
1
1
Kebbi State University of Science and Technology, Aliero, Kebbi State, Nigeria
The Aeromagnetic data over Northeastern part of Sokoto Basin, Nigeria, bounded between longitudes 5°5’E to 6°5’E and latitude 12°5’N to 13°5’N was interpreted using Euler Deconvolution and Spectral Analysis techniques in order to estimate the basement depth of the area. The data was analyzed and interpreted using Oasis Montaj software. Results of the studies indicate an increase in sedimentation northwards, with several depressions on the basement rock. The Euler deconvolution results shows the maximum depth in the study area to be 2.39 km, while Spectral Analysis indicates 1.80 km to be the highest depth. The areas with high basement depth; sheet 11 (Rabah) and sheet 12 (Isah), are the most probable sites where threshold temperature can be attained.
Keywords
Aeromagnetic Data
Euler Deconvolution
Spectral Analysis
Oasis Montaj Software and Basement Depth.
INTRODUCTION
Geophysical methods have played and will continue to play an increasingly important role in the economy of the world. This is mainly as a result of radical technical improvements in instrumentations, field methods and modern interpretation techniques resulting from the emergence of large digital computers and their applications. Several geophysical techniques are available for investigating the earth’s interior. Magnetic method, however, has remained one of the most vital geophysical tools for understanding the subsurface geology. Magnetic survey is employed to investigate subsurface geology on the basis of variations of magnetic anomalies in the Earth’s magnetic field resulting from the magnetic properties of the underlying rocks. The most distinguishing feature of this method, compared with other geophysical schemes, is the rapid rate of coverage and low cost per unit area explored [1]. The use of this method makes it possible for geophysicists to acquire data regardless of ownership or accessibility of remote lands of interest. This inherent advantage has made it possible for large scale airborne magnetometer survey to be carried out around the globe. Some of the roles of aeromagnetic survey as outlined by Sharma [2], Hamza and Garba [3] are as follows:
Determination of depths to basement rocks
Recognition and interpretation of faulting, shearing and fracturing not only as potential hosts for a variety of minerals but also an indirect guide to epigenetic, stress related mineralization in the surrounding rocks
Direct detection of deposits of certain iron ores
Over the years there has been speculation of the presence of abundant minerals of economic values which are left unexplored and undetected in Sokoto Basin. Oil discoveries in commercial quantities in similar basins as Sokoto Basin, such as Chad, Niger republic, Sudan, Benin and Mali with similar geological formations with Sokoto Basin has continued to generate enthusiasm with the hope that available new technologies and researches would yield better results where previous exploratory efforts have failed.
The aim of this study is to estimate the basement depth of the northeastern part of Sokoto Basin using Euler Deconvolution and Spectral Analysis techniques to infer portions where threshold temperatures necessary for hydrocarbons maturation could be attained.
Location and Geology of the Study Area
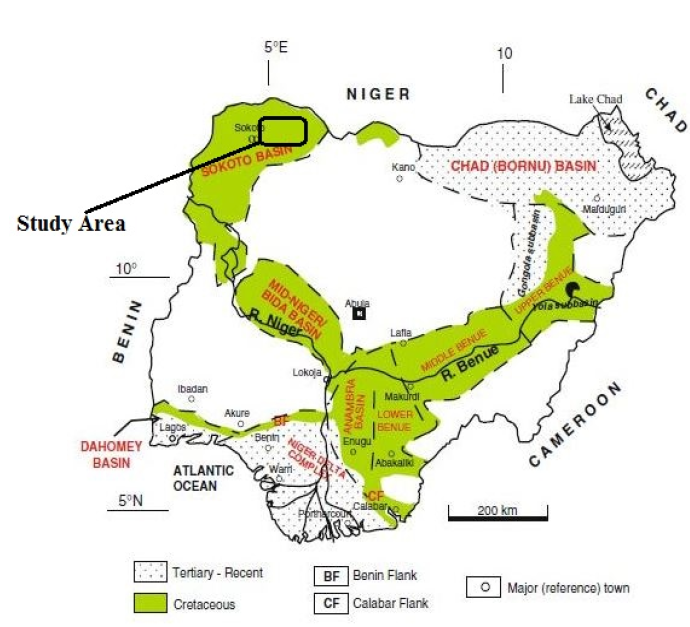
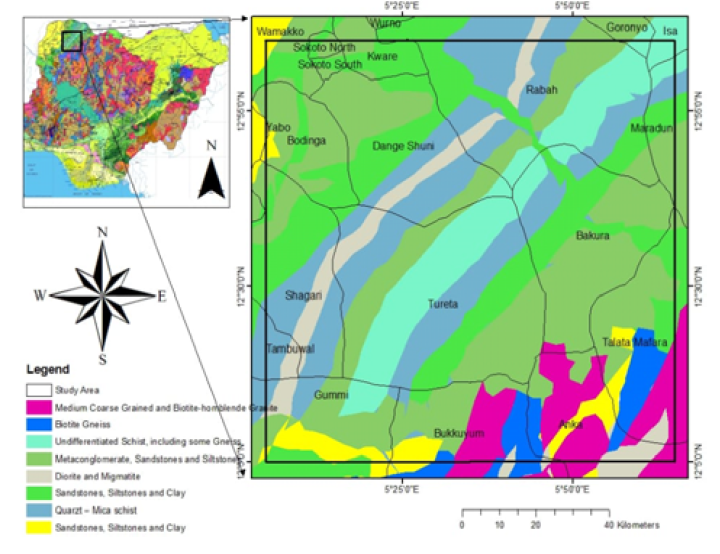
The study area is located at the northeastern part of Sokoto Basin, North Western Nigeria, bounded by longitudes of 5°5’E to 6°5’E and latitude 12°5’N to 13°5’N. It includes Rabah, Isah, Gandi and Mafara respectively covered by sheets No. 11, 12, 30 and 31. The Sokoto Basin which forms the south-eastern part of Iullumenden Basin, is located in the North western Nigeria. It consists predominantly of great undulating plain with an average elevation varying 250 to 400 m above sea level. The sediment of Sokoto Basin was accumulated during four main phases of deposition [4-6]. Overlying the Pre-Cambrian Basement uncomformably, the Illo and Gundumi Formations, made up of grits and clays, constitute the PreMaastrichtian continental intercalaire of West Africa [4,7]. They are overlain uncomformably by the Maastrichtian Rima Group, consisting of mudstones and friable sandstones (Taloka and Wurno Formations) separated by the fossiliferous Dukamaje Formation [4,7]. The Dange and Gamba Formation (mainly shales) separated by the calcareous Kalambaina constitute the Paleocene Sokoto Group. The overlying Gwandu Formation forms the Post Palecene Continental Terminal. These sediments dip gently and thicken gradually towards the northwest with a maximum thickness of over 1200 m near the frontier with Niger Republic [8] (Figure 1-2).
LITERATURE REVIEW
Kamba and Ahmed [9] applied source parameter imaging to determine depth to basement in parts of lower Sokoto basin, northwestern Nigeria. The result shows that the sedimentary thickness of the area ranges from 2.8-3.0 km.
Ofoha et al. [10] determined magnetic basement depth over parts of sokoto basin, using Improved Source Parameter Imaging (ISPI) technique. The result revealed that the sedimentary thickness of the area ranges from-3.3844 km to 0.0541 km.
Bonde et al. [11] applied spectral depth analysis to determine the sedimentary thickness of Sokoto Basin. The result of their findings show 2.88 km as the maximum sedimentary thickness of the area.
Figure 1: Map of Nigeria Showing the Study Area
Figure 2: Geological Map of the Study Area
Okonkwo et al. [12] interpreted high resolution aeromagnetic data to determine sedimentary thickness over part of Bida Basin using source parameter imaging, Euler deconvolution and spectral method. Result from source parameter imaging shows that the depth to magnetic bodies ranges from 0.10774-4.97294 km. while Euler deconvolution revealed maximum sedimentary thickness of 3.56 km.
Sawuta et al. [13] uses source parameter imaging and Euler deconvolution to estimate depth to magnetic sources of parts of Benue Trough. Source parameter results revealed a maximum sedimentary thickness of 4.908178 km while Euler deconvolution result revealed a depth of 4.0501 km.
MATERIALS AND METHODS
High Resolution Aeromagnetic (HRAM) data of Rabah (Sheet 11), Isah (Sheet 12), Gandi (Sheet 30) and Mafara (Sheet 31), which covers the area under consideration, were obtained from the Nigerian Geologic Survey Agency
(NGSA). The data which is in half degree sheet, was compiled from the data collected at a flight altitude of 80 m, along NE-SW flight lines with approximate spacing of 500 m. The residual anomaly was separated from the regional magnetic field by using the polynomial fitting method for all the values in the grid using Surfer 13 software. The residual anomaly data was interpolated using a minimum curvature gridding algorithm, available in the Geosoft Oasis Montaj (version 6.4.2) Module, with a grid cell size of 250 m. Euler Deconvolution and Spectral Analysis techniques were applied on the residual magnetic field grid to aid interpretation because they are best suited for the research interest of the work.
Euler Deconvolution
To obtain the approximate depth to the source of the anomalies, Euler deconvolution method was applied to the residual map. This technique provides automatic estimates of source location and depth. Therefore, Euler deconvolution is both a boundary finder and depth estimation method. Euler deconvolution is commonly employed in magnetic interpretation because it requires only a little prior knowledge about the magnetic source geometry and more importantly, it requires no information about the magnetization vector [14,15]. Euler deconvolution is based on Euler’s homogeneity equation. Thompson [14] showed that Euler’s homogeneity relation could be written in the form:
where, B is the regional value of the total magnetic field and x0, y0 and z0 is the position of the magnetic source, which produces the total magnetic field T measured at x, y, z. N is called structural index. For each position of the moving window, an over-estimated system of linear equations is solved for the position and depth of the sources [14,15].
Spectral Analysis
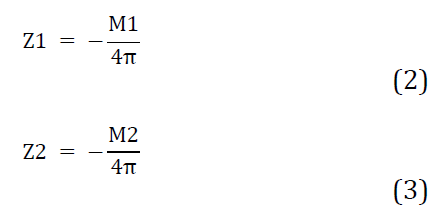
Determination of depths to buried magnetic rocks is among the principal applications of an aeromagnetic data. Statistical approach has been found to yield good estimates of mean depth to basement underlying a sedimentary basin [16,17]. The residual map that is produced from this study was divided into 8 blocks of overlapping magnetic section. The divisions of the residual map into 8 spectral sections was done with Oasis Montaj and the spectral energy was plotted using Matlab software purposely designed to accept the longitude and latitude values alongside with its respective magnetic values for each of the 8 spectral sections where the log of spectral energy were plotted against frequency. The program has been designed to determine the first slope (M1) and the second slope (M2). To calculate for the first and second magnetic depth source the equations below are used:
where, M1 and M2 are slopes of the first and second segment of the plot while Z1 and Z2 are first and second depths, respectively.
RESULTS AND DISCUSSION
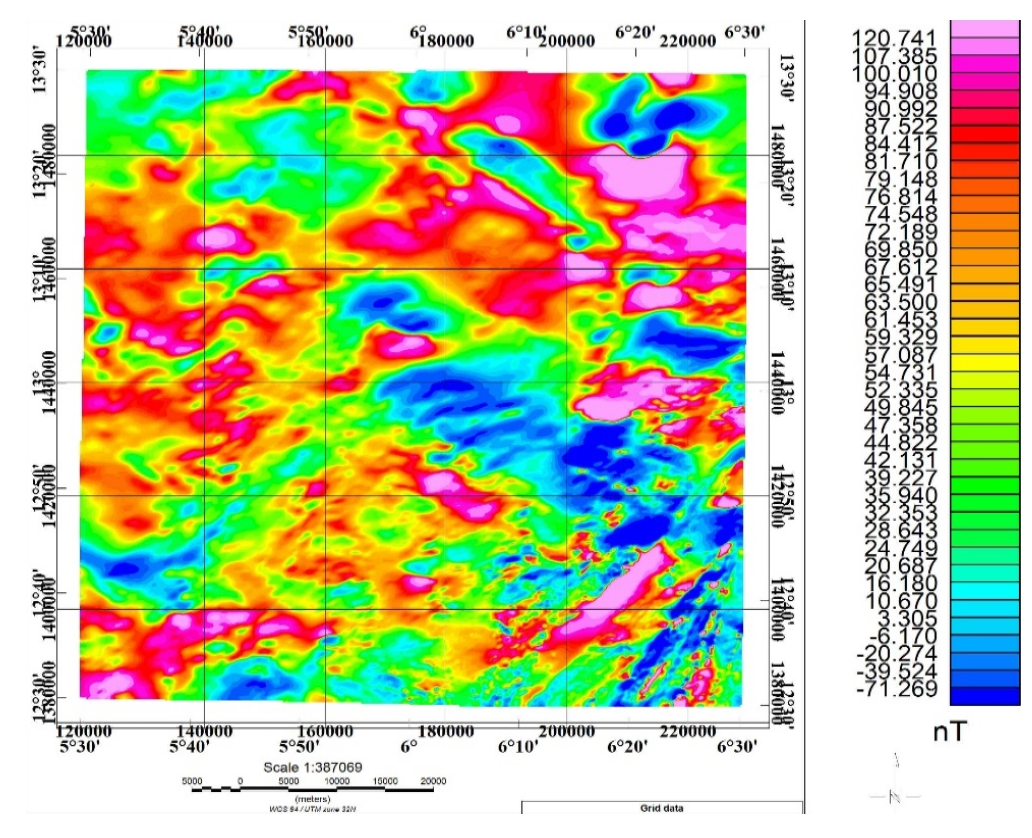
Total Magnetic Intensity (TMI) Map of the study area (Figure 3) has magnetic intensity values ranging from -71.3 to 120.7 nT and is marked by both high and low magnetic signatures. These variations may be due to several factors such as; magnetic susceptibility of the underlying rocks, variation in degree of strike, depth and difference in lithology. These shows that sedimentary thickness of the northeastern part of Sokoto basin increases from south to north part of the study area. This correlete with the works of Kamba and Ahmed [9] and Bonde et al. [11].
Figure 3: Total Magnetic Intensity (TMI) of the Study Area
Figure 4: Regional Magnetic Intensity Map
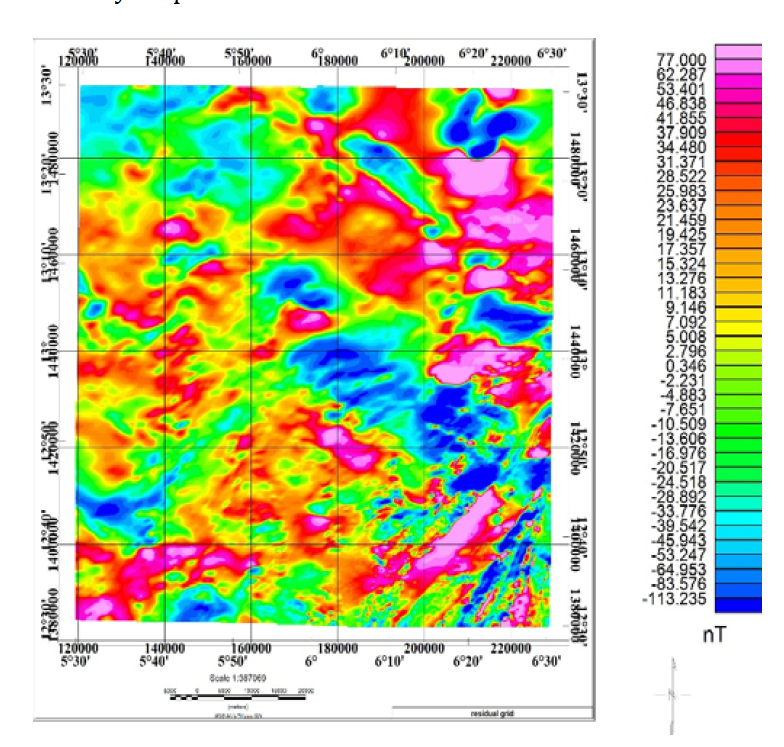
Figure 5: Residual Magnetic Intensity Map
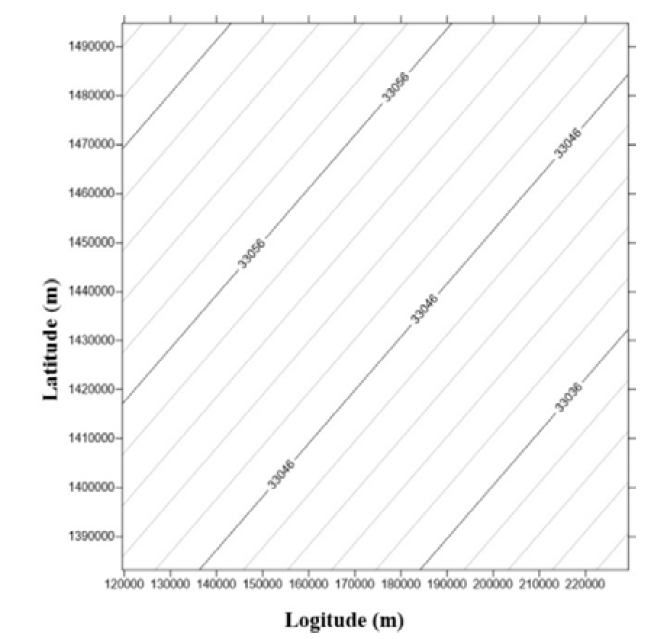
The regional field values from regional magnetic intesity map of the study area (Figure 4) which are large features that generally show up as trends and are caused by deeper homogeneity of the earth crust were removed from the total magnetic intensity grid by the method of least squares approach using polynomial regression method. The trend of the regional map of the study area which is in the NE-SW direction agrees with the works of Bonde et al. [11]. The left over in the gridded data after removing the regional field is the residual field (Figure 5) caused by high frequency shallow anomalies which corresponds to the location of the target anomalous bodies like structures.The residual magnetic intensity map of the study area revealed that the magnetic field intensity ranges from-113.235 to 77.000 nT which indicates that the study area is characterized with low (blue colour) and high (pink colour) magnetic signature.
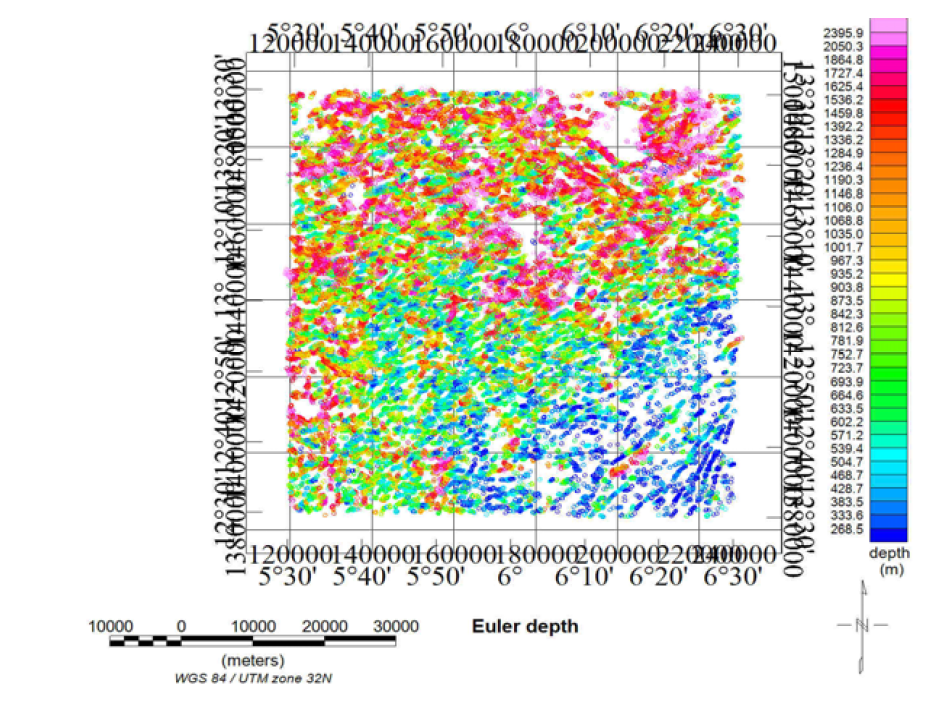
Euler Deconvolution method and Spectral Anlaysis were applied on the Residual Magnetic Intensity grid using the Euler 3D extension module and SPI extension module of the Oasis Montaj software. For Euler solutions, the best clustering solution was obtained by choosing structural index of one (i.e., SI = 1). Euler depth (Figure 6) Shows that the solution plotted clustered in the region where the geological structures are located shows depth range of 268.5 m (0.2685 km) to 2395.9 m (2.3959 km). The map shows deep magnetic bodies around Rabah (sheet 11) and Isah (sheet12).
Spectral solutions also indicated the maximum depth of 1.80 km at block 3 which correspond to Isah (sheet 12) part of the study area which could probably be as a result of the depth to the magnetized bodies within the sediment as shown in Table 1.
Figure 6: Euler Depthr
Table 1: Spectral Plot Table of Values
S/No.
No. of Block
Longitude (°)
Latitude (°)
Z1 (Km)
1.
Block 1
5° 30'-5° 37'
12° 30'-12° 37.5'
1.30
2.
Block 2
5° 37'-5° 45'
12° 37.5'-12° 45'
1.24
3.
Block 3
5° 45'-5° 52'
12° 45'-12° 52.5'
1.80
4.
Block 4
5° 52'-6° 00'
12° 52.5'-13° 00'
1.40
5.
Block 5
6°.00'-6° 7.5'
13° 00'-13° 7.5'
1.28
6.
Block 6
6° 7.5'-6° 15'
13° 7.5'-13° 15'
1.30
7.
Block 7
6° 15'-6° 22.5'
13° 15'-13° 22.5'
1.30
8.
Block 8
6° 22.5'-6° 30'
13° 22.5'-13° 30'
1.00
Z1 is the maximum Depth
CONCLUSION AND RECOMMENDATION
In conclusion, basement depth estimation using Euler Deconvolution and Spectral Analysis techniques, shows the maximum depth obtained by Euler depth analysis is 2.3959 km. While the maximum depth from Spectral Analysis is 1.80 km. The portions of the study area observed to have the highest depth where hydrocarbon maturation is probable are Rabah (sheet 11) and Isah (sheet 12). Therefore, the quantitative analysis performed on the high resolution total magnetic intensity (TMI) data of the study area using Euler deconvolution and Spectral Analysis techniques conforms favorably to the results of other researchers such as Kamba and Ahmad [9] and Bonde et al. [11]. According to Wright et al. [18], the minimum thickness for the concealment of hydrocarbon is about 2.3 km.
Based on the results obtained from this research, it is recommended that further survey like seismic reflection should be carried out in the areas with high basement depth (Rabah and Isah) to affirm the existence of the presumed hydrocarbon potential.
REFERENCE
Reford, M.S. and J.S. Sumner. “Aeromagnetics.” Geophysics, vol. 29, 1964, pp. 482-516.
Sharma, P.V. Environmental and Engineering Geophysics. Cambridge University Press, 1997.
Hamza, H. and I. Graba. “Challenges of Exploration and Utilization of Hydrocarbons in the Sokoto Basin.” Proceedings of the International Conference on the Potentials of Prospecting for Hydrocarbons in the Sokoto Basin, 2010.
Kogbe, C.A. “Cretaceous and Tertiary of the Iullemmeden Basin of Nigeria (West Africa).” Cretaceous Research, vol. 2, 1981, pp. 129-186.
Adeleye, D.R. “A Review of Maastrichtian Paleogeography of the Southern Iullemmeden and Nupe Basins.” Nigerian Journal of Mining and Geology, 1979, pp. 10-14.
Obaje, N.G. et al.“Petroleum Technology Development Journal.” Petroleum Technology Development Journal, vol. 3, 2013, pp. 68-80.
Kogbe, C.A. Geology of the South-Eastern Sector (Sokoto) of the Iullemmeden Basin. Department of Geology Bulletin, Ahmadu Bello University, 1979.
Obaje, N.G. Geology and Mineral Resources of Nigeria. Springer, 2009.
Kamba, A.H. and S.K. Ahmed. “Depth to Basement Determination Using Source Parameter Imaging (SPI) of Aeromagnetic Data: An Application to Lower Sokoto Basin, Northwest Nigeria.” International Journal of Modern Applied Physics, vol. 7, no. 10, 2017, pp. 1-10.
Ofoha, C.C. et al. “Determination of Magnetic Basement Depth over Parts of Sokoto Basin, Northern Nigeria, Using Improved Source Parameter Imaging (ISPI) Technique.” World Scientific News, vol. 50, 2016, pp. 266-277.
Bonde, D.S. et al. “Spectral Depth Analysis of Sokoto Basin.” Journal of Applied Physics (IOSR-JAP), vol. 6, no. 2, 2014, pp. 15-21.
Okonkwo, O.I. et al. “Interpretation of High-Resolution Aeromagnetic Data to Determine Sedimentary Thickness over Parts of Bida Basin, North Central Nigeria.” Journal of Geology and Mining Research, vol. 10, no. 6, 2018, pp. 72-80.
Sawuta, J.M. et al. “Science World Journal.” Science World Journal, vol. 14, no. 1, 2019.
Thompson, D.T. “EULDPTH: A New Technique for Making Computer-Assisted Depth Estimates from Magnetic Data.” Geophysics, vol. 47, 1982, pp. 31-37.
Reid, A.B. et al. “Magnetic Interpretation in Three Dimensions Using Euler Deconvolution.” Geophysics, vol. 55, no. 1, 1990, pp. 80-90.
Hahn, A. et al. “Depth Estimation of Magnetic Sources by Means of Fourier Amplitude Spectra.” Geophysical Prospecting, vol. 24, no. 2, 1976, pp. 287-306.
Udensi, E.E. Interpretation of Total Magnetic Field over the Nupe Basin and the Surrounding Basement Complex Using Aeromagnetic Data. PhD Thesis, Ahmadu Bello University, 2001.
Wright, J.B. et al. Geology and Mineral Resources of West Africa. George Allen and Unwin, 1985, pp. 107-108.
Recommended Articles
Research Article
OBSERVATIONS ON THE HOMOGENEOUS TERNARY QUADRATIC DIOPHANTINE EQUATION x2 + 4xy + 9y2 = 21z2
Download PDF
Research Article
Machine Learning-Based Intrusion Detection for Detecting DDoS Attacks in Software-Defined Networks
Zainab Abbas Fadhil
Published: 30/06/2026
Download PDF
Research Article
Computer Driven Library Management and Service Rendering System: Mobile Library Landscape
Yekini N. A,
...
Ojo O
Published: 10/06/2020
Download PDF
Research Article
A Deep Representation Learning Framework Based on PCA-Compressed EfficientNetB0 Embeddings and Neural Spline-Based Classification for Iraqi Banknote Authentication
Saba Hussein Rashid
Published: 30/06/2026
Download PDF
PO Box 101, Nakuru
Kenya.
Email: office@iarconsortium.org
Editorial Office:
J.L Bhavan, Near Radison Blu Hotel,
Jalukbari, Guwahati-India
Abubakar, I., Bonde, D. S., Mustapha, A. & Usman, A. (2021). Basement Depth Estimation for Hydrocarbon Maturation of Northeastern Part of Sokoto Basin Using Euler Deconvolution and Spectral Depth Analysis Techniques. IAR Journal of Engineering and Technology, 2(2), 1-6.
MLA
Abubakar, I., et al. "Basement Depth Estimation for Hydrocarbon Maturation of Northeastern Part of Sokoto Basin Using Euler Deconvolution and Spectral Depth Analysis Techniques." IAR Journal of Engineering and Technology 2.2 (2021): 1-6.
Chicago
Abubakar, I., D. S. Bonde, A. Mustapha and A. Usman. "Basement Depth Estimation for Hydrocarbon Maturation of Northeastern Part of Sokoto Basin Using Euler Deconvolution and Spectral Depth Analysis Techniques." IAR Journal of Engineering and Technology 2, no. 2 (2021): 1-6.
Harvard
Abubakar, I., Bonde, D. S., Mustapha, A. and Usman, A. (2021) 'Basement Depth Estimation for Hydrocarbon Maturation of Northeastern Part of Sokoto Basin Using Euler Deconvolution and Spectral Depth Analysis Techniques' IAR Journal of Engineering and Technology 2(2), pp. 1-6.
Vancouver
Abubakar I, Bonde DS, Mustapha A, Usman A. Basement Depth Estimation for Hydrocarbon Maturation of Northeastern Part of Sokoto Basin Using Euler Deconvolution and Spectral Depth Analysis Techniques. IAR Journal of Engineering and Technology. 2021 Jul;2(2):1-6.



 Download PDF
 Download XML