COVID-19, caused by the SARS-CoV-2 infection, has been reported for the first time in Wuhan City, Hubei Province, China. Due to its quick expansion and high death rate, the current coronavirus disease 2019 (COVID-19) outbreak has severely disrupted society, making it a worldwide emergency. Since the outbreak, governments and the scientific community have responded quickly to discover the causing agent, express the viral genetic sequence and implement steps to limit the pandemic. Recent studies show the symptoms and signs vary from person to person and from region to region. In this study, the Clinical Pathological Study in AL-Anbar government, Iraq, shows the highest risk factor related to age and sex, whereas Hematological and Biochemical parameters show the A blood group has the highest risk of infection in sever and non-sever cases and the Neutrophils, Lymphocytes , CRP, D-dimer and Ferritin have being highly significant correlation (p<0.001)with (4.85 and 2.69 (109/l)), (0.695 and 1.65 (109/l)), (645.7 and 130), (90 and 2.6) and (0.828 and 0.431) for both severity and non-severity cases of infected by a coronavirus, respectively.
Keywords
COVID-19
CRP
D-Dimer
Ferritin and COVID-19 Symptoms
INTRODUCTION
At the end of 2019, Wuhan, China's emerging economic hub, saw the outbreak of a completely new coronavirus pandemic that, in the first fifty days of the outbreak, claimed over eight hundred lives and infected over seventy thousand [1]. Coronaviruses (CoV) are classified into four genera, one of which being α, β, γ and δ-CoV. The last type is capable of infecting mammals [2]. This virus belongs to the category of coronaviruses known as Beta [3]. After SARS-CoV1 and Middle East respiratory syndrome (MERS)-CoV, which were discovered in 2003 and 2012, respectively, SARS-CoV-2 is the third coronavirus type to be found in the past 20 years [4,5]. In 2002-2003, 7,74 persons died as a result of SARS-CoV-1 infection; 8,096 cases of this virus were reported during this time. In 2012, a limited outbreak in the Middle East was caused by MERS-COV. 38% of cases resulted in death. Clinical characteristics and risk factors vary greatly, causing clinical severity to range from asymptomatic to deadly [6]. The virus is typically spread quickly from person to person via respiratory droplets created during coughing and sneezing. It is thought to be most contagious when persons are sick, though transmission may occur before symptoms appear in patients [7]. Based on clinical features, fever (98%) cough (76%) and myalgia/fatigue (44%), along with headache (8%), hemoptysis (5%), diarrhoea (3%) and sputum production (28%), were the most common symptoms among the first 40 patients. Furthermore, about half of the patients had dyspnea. Test results for WBC count showed either normal or reduced (25%) along with 65% lymphopenia [8].
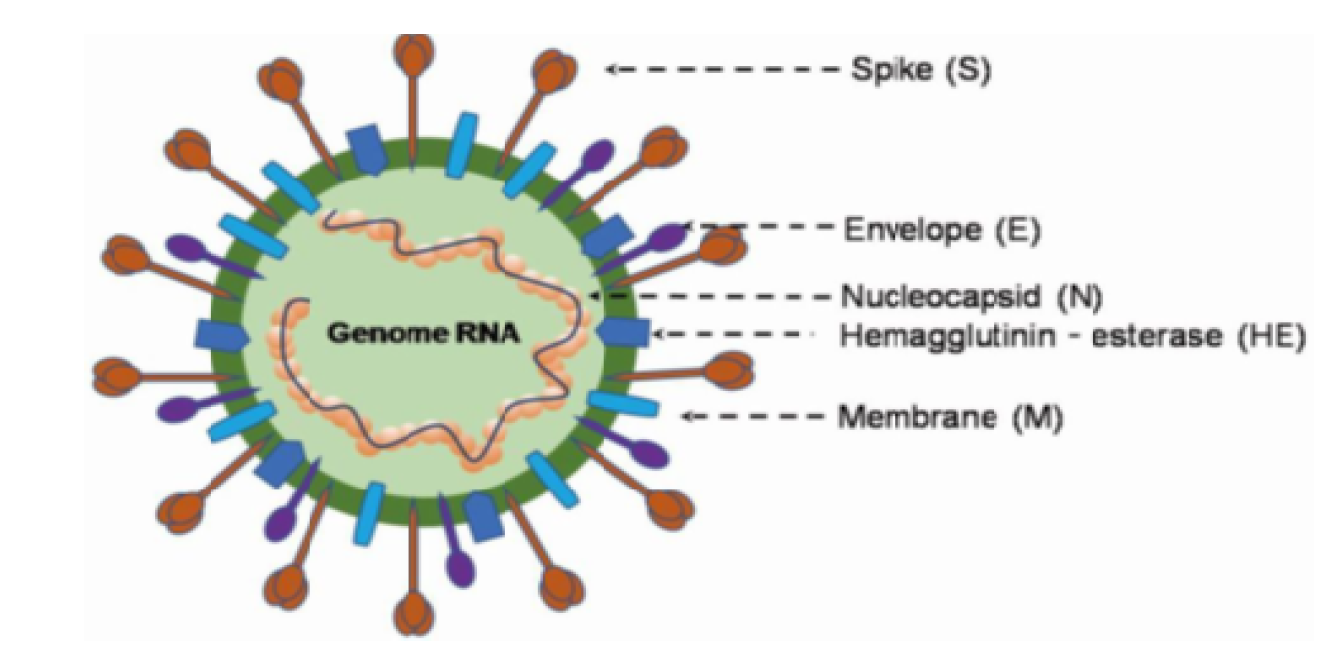
It was discovered that the genomes of SARS-CoV-2 and the previous human coronavirus, SARS-like bat CoV, were more than 80% identical. The four structural genes that encode structural proteins are Spike (S), Envelope (E), Membrane (M) and Nucleocapsid (N) (Figure 1). In SARS-CoV-2, the orf1ab gene encodes 15 nsps in addition to the pp1ab protein. The pp1a protein, which consists of 10 nsps, is encoded by the orf1a gene [9,10]. As pointed out by the evolutionary tree, SARS-CoV-2 is related to the SARS-coronavirus group [11].
Notable differences between SARS-CoV and SARS-CoV-2 that have been revealed by recent research include the lack of the 8a protein and differences in the amino acid content of the 8b and 3c proteins [9]. Virus Corona Furthermore, homologous recombination modifies the spike glycoprotein. By mixing unidentified beta-coV with bat SARS-CoV, SARS-CoV-2 spike glycoprotein is created [11]. The same ACE2 (angiotensin-converting enzyme 2) cell receptor and route of entrance into host cells used by SARS-CoV is used by SARS-CoV-2, according to fluorescence study. [12,13]. The purpose of this study was to determine the connection between various hematological and biochemical indicators and SARS-CoV-2 infection in the AL-Anbar Governorate.
Figure 1: The β-Coronavirus Particle
MATERIALS AND METHODS
Methods
Between September 2020 and December 2020, 10 and 40 healthy patients and individuals, respectively, provided blood samples and data for collection at Al-Fallujah Teaching Hospital. As seen in Table 1, these groups were further divided into three categories based on their ages.
Table 1: Classifying of Groups According to Their Age Range (year)
Type of group
Sex
12-25 years
25-45 years
More than 45 years
Patients
Male
3
20
10
Female
1
5
1
Healthy
Male
0
1
1
Female
1
4
3
Complete Blood Count
Taking a small sample of blood-a few milliliters-from a vein. Most often
The syringe's plunger is then gently pushed to extract the blood from the vein or the needle can be connected to a specialized suction vial used to collect blood
Whole blood is transferred to a CBC machine after being deposited in an EDTA tube
A few hours after collection, the complete blood count data can be accessible
Ferritin Test Procedure
Using a transfer pipette, transfer 30 μL of the sample (human serum, plasma or control) to a tube holding the detection buffer
Shake the sample well by closing the detection buffer tube's cover and shaking it ten or so times
Fill a sample well in the cartridge with 75 μL of the sample mixture using a pipette
Place the test cartridge containing the sample into the i-Chamber's slot or an incubator set to 25°C
After loading the cartridge with sample, let it sit in the i-Chamber or an incubator for ten minutes. As soon as the incubation period is up, scan the cartridge that has been loaded with sample. If not, the test result will be imprecise
Place the sample-loaded cartridge into the ichromaTM test device's cartridge holder to begin scanning it
D-Dimer Test Procedure
Using a transfer pipette, transfer 10 μL of any sample-human whole blood, plasma or control-to a tube holding the detection buffer
Shut off the detection buffer tube's cover and shake the sample well, about ten times. It is necessary to utilise the sample combination right away
Fill the sample well on the cartridge with 75 μL of a sample combination using a pipette
Give the sample-loaded cartridge a 12-minute rest period at room temperature
Insert the cartridge containing the sample into the Instrument for IchromaTM test cartridge holder to begin scanning. Make sure the cartridge is oriented correctly before inserting it all the way into the cartridge holder. Specifically for this reason, an arrow has been marked on the cartridge
To begin scanning with the Instrument for IchromaTM testing, press the "Select" button
The ichromaTM test instrument will instantly begin scanning the cartridge that has been loaded with samples
CRP Test Procedure
Press an empty sample collector through the top of the detection buffer tube to create a puncture
Use a sample collector to take 10 μL of sample (human whole blood, serum, plasma or control)
Unite the tube and the sample collection into one
Shake the sample at least ten times to get it out of the sample collector via inversion. Within thirty seconds, the buffer and sample combination must be used
Take off the completed tube's top cap. Before applying to the cartridge, discard two drops of the reagent onto the paper towel
Only two drops of the combination should be loaded into the cartridge's sample well
Let the cartridge sit at room temperature for three minutes before putting the gadget in its holder
Place the cartridge with the sample into the ichromaTM test instrument's cartridge holder to begin scanning the cartridge. Make sure the cartridge is oriented correctly before inserting it all the way into the cartridge holder. Specifically for this reason, an arrow has been marked on the cartridge
To begin the scanning procedure, press the "Select" button on the ichromaTM test device
The IchromaTM test instrument will begin to scan
Statistical Analysis
Calculating the Chi-square (X2) and probability (p-value) requires respectively, the statistical analysis was performed using the computer statistical programme SPSS (Statistical Package for Science Services). The results were deemed statistically non-significant if the probability value was greater than 0.05. The results were considered statistically highly significant if the P value was less than 0.01.
RESULTS AND DISCUSSION
Clinical Pathological Study
Risk Factors and Simpsons Related to Coronavirus: The demographic and clinical signs and symptoms of 50 COVID-19 patients recorded in Table 2, shows that 17 (33.5%) patients with a mean age of 39 years (18-80) had severe to critical disease required to enter the ICU. Of the patients, males made up 35 (70%) and somewhat more than half (15%). Conversely, when comorbidities were compared to diabetes, there was a relatively significant difference between severe and non-severe cases; however, the difference was not significant when it came to cases of asthma, smoking or heart disease. The risk of serious diseases is somewhat increased in individuals with hypertension compared to other categories. According to the current study, 55 and 78% of patients with sars-covid-19 had a fever and a dry cough, respectively.
As indicated in Table 2, we used a sample of fifty patients in this investigation to characterise the clinical-biological features of COVID-19 in the AL-Anbar government. The demographic factors found in our series support the findings of other authors who have shown that advanced age is a risk factor for COVID-19 and accelerates the onset of severe disease and non-COVID-19 [14,15]. Zhou and colleagues, for instance, discovered that older age groups were significantly linked to the prevalence of SARS-CoV-19 and mortality [16]. However, older age groups were also shown to be significant independent predictors of death in cases of SARS and MERS [17,18].
Most writers have also suggested that male sex influences how severe COVID-19 is; our dataset [19] supports this. But according to a group from Iran, sex might not be the driving force behind annoyance [20]. Most underdeveloped countries, especially those in Africa, lack medical Intensive Care Units (ICUs), where at least one-fifth of patients with chronic diseases need supportive therapy. Significant morbidity is linked to COVID-19 illness. Even after appropriate supporting measures were put in place, the inpatient mortality rate continued to be higher than 1.4%, rising to 6.4% in the over-60 category [22,23].
People with diabetes are more likely to experience serious COVID-19 problems. People with diabetes have a higher risk of developing severe symptoms and complications from any viral infection [5]. This study found no association between smoking and the severity of Coronavirus, which is consistent with the findings of other studies.
Table 2: Risk Factors and Simpsons Related to Coronavirus
Characteristics
Total (50 patients)
Severe (Mean±SD) N0 = 17
Non-severe (Mean±SD) NO = 33
p-value
Age (years)
39 (18-80 )
64±2.1
36± 1.9
p<0.001
Sex
Male
35 (70%)
20±1.1 (58%)
14.7±0.84 (42%)
p<0.001
Female
15 (30%)
3±0.32 (20%)
12±0.87 (80%)
Comorbidities
Smoking
3 (5%)
1 (33%)
2(66%)
NS
Hypertension
-
-
-
Diabetes
13 (26%)
9 (68%)
4 (32%)
0.003
Cardiac disease
3 (7%)
0
3 (100%)
NS
Signs and Symptoms 2
Fever
28 (55.5%)
17 (60%)
11(40%)
-
Headache
9 (18%)
2 (22%)
7(78%)
-
Dry cough
39 (78%)
15(37%)
24 (63%)
-
Chest pain
11 (22%)
9 (81%)
2(19%)
-
Abdominal pain
5 (10%)
4(80%)
1(20%)
-
Vomiting
9 (18 %)
1 (11%)
8 (89%)
-
Diarrhea
11 (21%)
2 (18%)
9 (82%)
-
The Effect of ABO Blood GroupsonCoronavirus
According to the ABO blood group distribution scheme, there were no appreciable variations between patients in the two main categories of severe and non-severe instances in the same blood groups A, B, AB and O Table 3.
As indicated in Table 3, the A blood group has the highest risk of infection in both severe and non-severe cases. This finding agrees with research done in Baghdad, Iraq but disagrees with another study conducted in Iran, which found the greatest percentage of patient-sensitive associated AB blood group [24,25]. These disparities might be attributed to biological differences among these populations [26].
Recent studies have shown that the O blood group reduces the influence of SARS-CoV-2. Nonetheless, additional research has demonstrated how blood types A, B and AB raise the risk of infection [27-29]. Zhao et al. [30] discovered that blood type A had a greater risk of dying in their investigation. Based on these results, it is possible that ABO antigens contribute to the pathophysiology of SARS-CoV-2; however, it is unclear how these particles confer immunity or increase susceptibility to infection.
Table 3: The Effect of ABO Blood Groups on Coronavirus
ABO blood groups
Samples
Severe
Non-severe
No.
%
No.
%
A.
12
71
19
58
B.
2
12
6
18
O.
3
17
7
21
AB.
0
0
1
3
X2 = 7.719 p = 0.05219053, p>0.05 non-significant
Hematological and Parameters Relation with SARS-CoV-2
There is no discernible relationship between the white blood cell count and SARS-CoV-2 infection, according to the haematological criteria listed in Table 4. According to the findings, a lower white blood cell count was present in the majority of both patients classified as severe and non-severe. The biological profiles of the patients were similar to those reported in the literature for severe patients who had lymphopenia at the time of admission and that had gotten worse while they were there. There are a few theories that have been put up to help us comprehend the pathophysiology of lymphopenia in relation to SARS-CoV-2 infection. 286 individuals with severe forms and 166 patients with non-severe forms had their hemograms and lymphocyte subpopulations described by Chinese researchers. Severe patients exhibited a considerably higher neutrophil/lymphocyte ratio as well as elevated inflammatory markers (CRP, ferritin, interleukin-6, interleukin-8 and interleukin-10). Furthermore, compared to non-severe patients, severe patients showed greater CD4 lymphopenia, more CD4-naive cells and CD4 suppressor T cells and fewer CD4 memory cells and regulatory T cells [31]. COVID-19, according to Rodriguez et al., may act on lymphocytes, particularly T cells, potentially decreasing CD4 and CD8 cells.
Through the ACE2 receptor, the virus particles penetrated the respiratory mucosa, initially infecting ciliated bronchial epithelial cells before moving on to infect other cells. The body experiences a cytokine storm as a result, which sets off a series of immunological responses and modifies peripheral WBCs and immune cells, including lymphocytes [24]. Henry and colleagues conducted a meta-analysis which revealed that the quantity of lymphocytes, specifically CD4 lymphocytes, can function as a biological predictor of severity and death. They also presented the theory that, in the case of COVID-19, survival could be contingent upon the capacity to regenerate lymphocytes that have been infected by the virus [22].
Table 4: Association Between Hematological Parameters with SARS-CoV-2
Hematological Changes
Patients with SARS-CoV-2
Severe (Mean)
Non-severe (Mean)
p-value
WBC COUNT
6.64 [5.41-8.22]
5.78 [4.46-7.24]
0.061 NS
Neutrophils (109/l)
4.85 [3.45-6.84]
2.69 [2.28-4.89]
p<0.001
Lymphocytes (109/l)
0.695 [0.71-1.31]
1.65 [1.21-2.14]
p<0.001
Hemoglobin (g/l)
14.1 [12.6-14.9]
13.7 [12.8-15.07]
0.436 NS
Platelets (109/l)
214 [169-314]
228.5 [187-289]
0.565
Association between of Biochemical Changes with SARS-CoV-2
Comparing the the current research to another group, it discovered a highly significant link between CRP, D-dimer and ferritin with the severity of coronavirus infection, especially ferritin in severe instances. Table 5 demonstrates a highly significant relationship between the male patients' rate of infection and increased serum Ferritin levels. This finding corresponded to research conducted in al Najaf, Iraq, Kurdistan, Iraq, Indonesia and Wuhan, China, which discovered elevated levels of blood Ferritin in COVID-19 patients [32].
By inhibiting the immune system and fostering proinflammatory activity, high ferritin levels in the blood can cause immunological dysregulation, which can then result in cytokine storming. Serum ferritin levels and acute respiratory distress syndrome have been found to be negatively linked with severe SARS-CoV-2 infectio. The concept of secondary hemophagocytic lymphohistocytosis (sHLH) in SARS-CoV-2 may have been influenced by this [33]. As a result, there was extreme inflammation, with cytokine storming being one of its distinguishing characteristics that might be fatal [34]. Our research revealed a highly substantial correlation between D-Dimer levels and SARS-CoV-2 infection rates, with an increase in infected patient rates as D-Dimer levels rose. This outcome was in line with investigations from Wuhan, China, Japan, Indonesia and Greece that found a connection between high D-dimer levels and the severity of SARS-CoV-2 infection. [35,36]. This may be because most SARS-CoV-2 thrombocytopenia patients had elevated D-dimer levels, which might have led to DIC or disseminated intravascular coagulation and a fatal outcome by impairing coagulation time [37].
Sepsis is a major cause of disseminated intravascular coagulation and can occur in patients infected with COVID-19. Upon activation of platelets, leukocytes and endothelial cells, patients with severe pneumonia exhibit both systemic and local dysregulation of formation. Unchecked thrombin flow, which is not regulated by endogenous anticoagulants, can lead to fibrinolysis2. This has the ability to activate platelets [38]. Although they have little prognostic power for thrombosis, increased baseline D-dimer levels in COVID-19 patients are associated with inflammation. Among COVID-19 patients, the shift in D-dimer levels has to be actively tracked. Additionally, abnormal changes in D-dimer and inflammatory factors suggest the possibility of the need for anticoagulant therapy. Additionally, baseline D-dimer levels may not be as beneficial as the VTE score for predicting the predictive utility of COVID-19 patients in preventing venous thromboembolism. However, this has to be investigated.
Table 5: Biochemical Changes' Relationship with SARS-CoV-2
Biochemical Changes
Patients with SARS-CoV-2
Severe Patient (Mean)
Non-severe Patient (Mean)
p-value
Ferritin (μg/l)
645.7 [383.8-2289]
130 [42-229]
p<0.001
CRP (mg/l)
90 [41-246]
2.6 [0.9-9.8]
p<0.001
D-dimer (μg/l)
0.828 [0.54-2.44]
0.431 [0.283-0.860]
p<0.001
CONCLUSION
Due to its rapid spread and high death rate, the current coronavirus disease 2019 (COVID-19) outbreak has caused major disruptions and is now considered a global emergency. Since the outbreak, governments and the scientific community have moved fast to identify the causative culprit, express the viral genetic sequence and apply pandemic-control measures. According to recent research, symptoms and indicators differ from person to person and area to region. In this study, the Clinical Pathological Study in AL-Anbar government, Iraq, shows that the highest risk factor is related to age and sex, whereas Hematological and Biochemical parameters show that the A blood group has the highest risk of infection and Lymphocytes, Neutrophils, CRP, D-dimer and Ferritin have a highly significant correlation with the severity of coronavirus infection.
REFERENCE
Cui, J. et al. “Origin and Evolution of Pathogenic Coronaviruses.” Nature Reviews Microbiology, vol. 17, no. 3, 2019, pp. 181-192.
World Health Organization. Laboratory Testing for Coronavirus Disease (COVID-19) in Suspected Human Cases: Interim Guidance. March 2020.
Lai, C.C. et al. “Severe Acute Respiratory Syndrome Coronavirus 2 (SARS-CoV-2) and Coronavirus Disease-2019 (COVID-19): The Epidemic and the Challenges.” International Journal of Antimicrobial Agents, vol. 55, no. 3, 2020.
Ksiazek, T.G. et al. “A Novel Coronavirus Associated with Severe Acute Respiratory Syndrome.” New England Journal of Medicine, vol. 348, 2003, pp. 1953-1966.
Zaki, A.M. et al. “Isolation of a Novel Coronavirus from a Man with Pneumonia in Saudi Arabia.” New England Journal of Medicine, vol. 367, no. 19, 2012, pp. 1814-1820.
Phan, T. “Novel Coronavirus: From Discovery to Clinical Diagnostics.” Infection, Genetics and Evolution, vol. 79, 2020.
Gold, A. et al. “COVID-19 and Involuntary Hospitalisation: Navigating the Challenge.” The Lancet Psychiatry, vol. 7, no. 7, 2020.
Huang, C. et al. “Clinical Features of Patients Infected with 2019 Novel Coronavirus in Wuhan, China.” The Lancet, vol. 395, no. 10223, 2020, pp. 497-506.
Wu, A. et al. “Genome Composition and Divergence of the Novel Coronavirus (2019-nCoV) Originating in China.” Cell Host and Microbe, vol. 27, no. 3, 2020, pp. 325-328.
Chen, Y. et al. “Emerging Coronaviruses: Genome Structure, Replication and Pathogenesis.” Journal of Medical Virology, vol. 92, no. 4, 2020, pp. 418-423.
Li, B. et al. “Discovery of Bat Coronaviruses through Surveillance and Probe Capture-Based Next-Generation Sequencing.” mSphere, vol. 5, no. 1, 2020.
Gralinski, L.E. and V.D. Menachery. “Return of the Coronavirus: 2019-nCoV.” Viruses, vol. 12, no. 2, 2020.
Xu, X. et al. “Evolution of the Novel Coronavirus from the Ongoing Wuhan Outbreak and Modeling of Its Spike Protein for Risk of Human Transmission.” Science China Life Sciences, vol. 63, no. 3, 2020, pp. 457-460.
Zaki, A.M. et al. “Isolation of a Novel Coronavirus from a Man with Pneumonia in Saudi Arabia.” New England Journal of Medicine, vol. 367, no. 19, 2012, pp. 1814-1820.
Wu, C. et al. “Risk Factors Associated with Acute Respiratory Distress Syndrome and Death in Patients with Coronavirus Disease 2019 Pneumonia in Wuhan, China.” JAMA Internal Medicine, vol. 180, 2020, pp. 1-11.
Huang, C. et al. “Clinical Features of Patients Infected with 2019 Novel Coronavirus in Wuhan, China.” The Lancet, vol. 395, no. 10223, 2020, pp. 497-506.
Choi, K.W. et al. “Outcomes and Prognostic Factors in 267 Patients with Severe Acute Respiratory Syndrome in Hong Kong.” Annals of Internal Medicine, vol. 139, no. 9, 2003, pp. 715-723.
Hong, K.H. et al. “Predictors of Mortality in Middle East Respiratory Syndrome (MERS).” Thorax, vol. 73, no. 3, 2018, pp. 286-289.
Javanian, M. et al. “Clinical and Laboratory Findings from Patients with COVID-19 Pneumonia in Babol, North of Iran: A Retrospective Cohort Study.” Romanian Journal of Internal Medicine, 2020.
Rodriguez-Morales, A.J. et al. “Clinical, Laboratory and Imaging Features of COVID-19: A Systematic Review and Meta-Analysis.” Travel Medicine and Infectious Disease, 2020.
Shim, E. et al. “Transmission Potential and Severity of COVID-19 in South Korea.” International Journal of Infectious Diseases, vol. 93, 2020, pp. 339-344.
Verity, R. et al. “Estimates of the Severity of Coronavirus Disease.” The Lancet Infectious Diseases, 2020.
Ad’hiah, A.H. et al. “Evaluating the Association between ABO Blood Groups and Coronavirus Disease 2019 (COVID-19) in Iraqi Patients.” Egyptian Journal of Medical Human Genetics, vol. 21, no. 1, 2020, pp. 1-6.
Abdollahi, A. et al. “The Novel Coronavirus SARS-CoV-2 Vulnerability Association with ABO/Rh Blood Types.” Iranian Journal of Pathology, vol. 15, no. 3, 2020.
Pousinha, P.A. Leaders in Pharmaceutical Business Intelligence (LPBI) Group. 2019.
Jin, Y. et al. “Virology, Epidemiology, Pathogenesis and Control of COVID-19.” Viruses, vol. 12, no. 4, 2020.
Jin, Y. et al. “Virology, Epidemiology, Pathogenesis and Control of COVID-19.” Viruses, vol. 12, no. 4, 2020.
Zhou, P. et al. “A Pneumonia Outbreak Associated with a New Coronavirus of Probable Bat Origin.” Nature, vol. 579, no. 7798, 2020, pp. 270-273.
Zhao, J. et al. “Relationship between the ABO Blood Group and the COVID-19 Susceptibility.” Clinical Infectious Diseases, 2020.
Shen, K. et al. “Diagnosis, Treatment and Prevention of 2019 Novel Coronavirus Infection in Children: Experts’ Consensus Statement.” World Journal of Pediatrics, vol. 16, no. 3, 2020, pp. 223-231.
Zhao, J. et al. “Relationship between the ABO Blood Group and the COVID-19 Susceptibility.” Clinical Infectious Diseases, 2020.
Latz, C.A. et al. “Blood Type and Outcomes in Patients with COVID-19.” Annals of Hematology, vol. 99, no. 9, 2020, pp. 2113-2118.
Qin, C. et al. “Dysregulation of Immune Response in Patients with COVID-19 in Wuhan, China.” Clinical Infectious Diseases, 2020.
Baird, J.K. “Malaria Zoonoses.” Travel Medicine and Infectious Disease, vol. 7, no. 5, 2009, pp. 269-277.
Henry, B.M. et al. “Hematologic, Biochemical and Immune Biomarker Abnormalities Associated with Severe Illness and Mortality in Coronavirus Disease 2019 (COVID-19): A Meta-Analysis.” Clinical Chemistry and Laboratory Medicine, vol. 58, no. 7, 2020, pp. 1021-1028.
Al-Furat, A.L. “Study the Relationship between CRP and Ferritin in People Infected with COVID-19 in Al-Najaf Governorate, Iraq.”
Merza, M.A. et al. “COVID-19 Outbreak in Iraqi Kurdistan: The First Report Characterizing Epidemiological, Clinical, Laboratory and Radiological Findings of the Disease.” Diabetes and Metabolic Syndrome: Clinical Research and Reviews, vol. 14, no. 4, 2020, pp. 547-554.
Recommended Articles
Research Article
Circulating Chemerin and Its Association with Glycemic Status in Adults with Type 2 Diabetes Mellitus: A Hospital-Based Case-Control Study in Kirkuk, Iraq
Mohammed Fraıdoon Fadhil
Published: 30/09/2026
Download PDF
Research Article
Causes of Low Ferritin Level Among Women in Kirkuk City
Dunya Aedn Omar
Published: 15/09/2026
Download PDF
Review Article
Hyperuricemia and Cardiovascular Diseases: A Comprehensive Review
Neha Verma,
Ritika Kashyap
Published: 25/07/2024
Download PDF
Research Article
Role of Maternal Serum Lactate Dehydrogenase in Determining the Severity of Preeclampsia: A Case-Control Study
Alhan Ali Salih,
...
Sabah Hasan Mohammed
Published: 04/10/2024
Download PDF
PO Box 101, Nakuru
Kenya.
Email: office@iarconsortium.org
Editorial Office:
J.L Bhavan, Near Radison Blu Hotel,
Jalukbari, Guwahati-India
Fayadh, M. A. (2023). Study Some Biochemical Parameters in Patients with Severe Covid-19 at Al-Anbar Governorate. IAR Journal of Clinical & Medical Biochemistry, 3(2), 1-6.
MLA
Fayadh, Mohammed A.. "Study Some Biochemical Parameters in Patients with Severe Covid-19 at Al-Anbar Governorate." IAR Journal of Clinical & Medical Biochemistry 3.2 (2023): 1-6.
Chicago
Fayadh, Mohammed A.. "Study Some Biochemical Parameters in Patients with Severe Covid-19 at Al-Anbar Governorate." IAR Journal of Clinical & Medical Biochemistry 3, no. 2 (2023): 1-6.
Harvard
Fayadh, M. A. (2023) 'Study Some Biochemical Parameters in Patients with Severe Covid-19 at Al-Anbar Governorate' IAR Journal of Clinical & Medical Biochemistry 3(2), pp. 1-6.
Vancouver
Fayadh MA. Study Some Biochemical Parameters in Patients with Severe Covid-19 at Al-Anbar Governorate. IAR Journal of Clinical & Medical Biochemistry. 2023 Jul;3(2):1-6.


 Download PDF
 Download XML