This study was carried out in the 2017 rainy season at the Jato-Aka plains in Kwande Local Government Area of Benue State to determine the status of soil degradation in the area. Five communities were sampled. These included Jato-Aka, Div, Injorov, Mbachon and Iniongov. Soil samples were taken at 0 – 15 cm, 15 – 30 cm and 30 – 45 cm and were air-dried, ground and packed for laboratory analysis. They were analyzed using standard laboratory analytical procedures. Results revealed that the soils of Jato-Aka plains are inherently low in fertility, except along the flood plain soils of Mbachon where prospects of good soil existed. The soils were Non to Slightly Degraded in bulk density and had moderate porosity. They were strongly acidic, very low in organic matter content, low in phosphours and nitrogen, moderate in potassium, low in sodium, calcium and magnesium. The cation exchange capacity was very low while the base saturation was very high. Liming to reduce soil acidity, and mulching as well as other forms of organic matter additions plus fertilization are strongly advocated to boost the fertility of these soils to enhance higher crop yield.
Keywords
Jato-Aka
Mbachon
Injorov
Iniongov
Kwande
INTRODUCTION
Soil is the basic natural resource that provides habitat and sustenance for living organisms, as well as being a major focus of economic activities [1]. It is an integral part of land and it is a vital resource for the future of humanity. It needs to be protected and enhanced. However, more than half (52%) of all fertile, food-producing soils globally are now classified as degraded, many of them severely degraded [2].
Soil degradation implies a decline in soil quality with an attendant reduction in ecosystem functions and services [3]. According to Global Environment Facility, Land degradation is also defined as any form of deterioration of the natural potential of land that affects ecosystem integrity either in terms of reducing its sustainable ecological productivity or in terms of its active biological richness and maintenance of resilience. It is the loss of utility of land or the decline in the soil quality caused through misuse by humans [4].
Furthermore, UNCCD [2] defined land degradation as a reduction or loss in arid, semi-arid and dry sub-humid areas of the biological or economic productivity and complexity of rain fed cropland, irrigated cropland, range land pasture, forest, and woodlands resulting from land uses or from a process or combination of processes. These they said included processes arising from human activities and habitation patterns such as soil erosion caused by wind and/or water, deterioration of the physical, chemical, and biological as well as economic properties of soil; and long-term loss of natural vegetation.
Arable land and 31% of pasture lands have already been degraded as a result of erosion [5]. Fragile soils with poor buffering capacity are particularly susceptible to this type of degradation when cultivated continuously. This has caused 7% loss of agricultural productivity on irrigated lands, 14% losses on rain fed crop and 45% loss of range land [6]. Soil degradation typically occurs because of land management practices or human development that is not sustainable over a period of time.
The problem of environmental degradation has generated both local and global attention. While the area of interest to the international community is in broad terms like climatic change and desertification, the environmental problem of concern to people in the villages is usually peculiar in nature, bothering on immediate land use limitations that threaten their well being and survival. For example, declining soil fertility leads to poor crop yields while rangeland depletion reduces animal productivity encouraging pastoralism on already limited land available for farmers, which is currently causing conflicts around many parts of Nigeria, even on the Jato Aka plains. Any deterioration in water quality usually adversely affects the natural flora and fauna in surrounding water bodies. There is an increasing demand for information on soils as means to produce food [7]. This study was carried out to determine the degradation status of soils of Jato-Aka plains in Kwande Local Government Area of Benue State to enable proper management for enhanced crop productivity.
MATERIALS AND METHODS
Study area
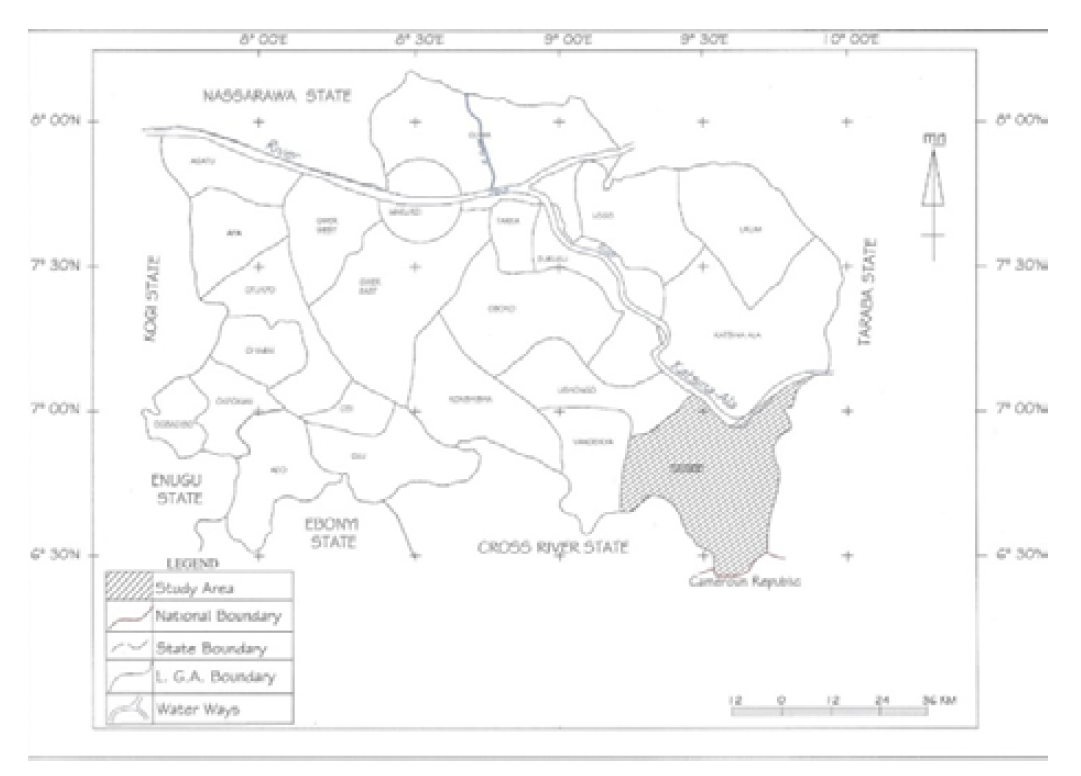
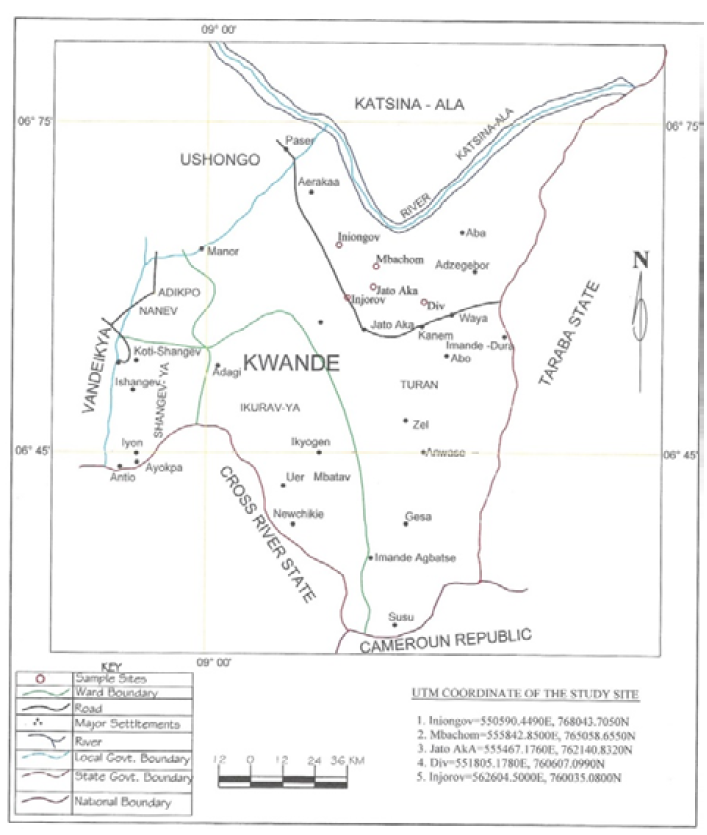
The study was carried out in five (5) communities of the Jato-Aka plains in Kwande Local Government Area of Benue State which included Jato-Aka, Div, Injorov, Iniongov and Mbachon as show in Figures 1 and 2.
The experimental area is in the Southern Guinea Savanna Agroecological Zone of Nigeria with annual rainfall of about 1,250 mm and temperature of 25–30oc.
Materials
Cutlass for land clearing, hoe for digging of soil profile, shovel for shaping the soil profile, masking tape for sample labeling, 30 cm rule for measurement of depth of horizons and polythene bags for soil sample collection.
Methodology
15 soil samples were taken from five (5) different locations which were Div, Injorov, Jato-Aka, Mbachom and Iniongov on the Jato-Aka plains in Kwande Local Government Area of Benue State at 0-15, 15-30 and 30-45 cm depths.
Standards for Determination of Status of Soil Degradation of Jato-Aka Plains
The level of degradation of soils of the Jato-Aka plains was assessed using the standard indicators and criteria for assessment of land (soil) degradation by the Food and Agriculture Organization, as well as the Guide for Interpretation of Analytical Data (FAO-FMARDSFSP, 2004). Analytical data from each sample was placed in a degradation class by matching the soil characteristics with the land degradation indicators (Tables 1-2). The four degrees of soil degradation used were: Non to Slightly Degraded Soil (NSD) where its productivity ranged from 75 – 100%, Moderately Degraded Soil (MD), where its productivity ranged from 50 – 75%, Highly Degraded Soil (HD) where its productivity ranged from 25 – 50%, and Very Highly Degraded Soil (VHD) where its productivity ranged from 0 – 25%.
Figure 1: Map of Benue State Showing Kwande Local Government Area
Source: Ministry of Lands and Survey, Makurdi, 2019
Source: Ministry of Lands and Surveys, Makurdi. 2019
Laboratory Analysis
Soil analysis was carried out at the Advanced Analytical Soil Testing Laboratory of the Department of Soil Science, University of Agriculture, Makurdi using standard laboratory procedures.
Particle size distribution was done by the Bouyoucos Hydrometer method [10], bulk density using the core sampler, total porosity of the soil sample was calculated from the bulk density and particle density relation, Soil pH in water was determined using the pH meter, Soil organic carbon was determined using the wet oxidation method of Walkley and Black [11], Total nitrogen was determined by the Macro Kjeldahl Method [12], Cation exchange capacity was determined by Neutral Ammonium Acetate Method, Bray-1 Method was used to determine the extractable Phosphorus [13], Exchangeable cations were determined by Melhlich-3 extraction solution, Base saturated was determined by dividing the sum of exchangeable bases by CEC and Multiplying by 100.
Table 1: Indicators and Criteria for Soil Degradation Assessment
Indicator
Degree 1
Degree 2
Degree 3
Degree 4
Soil Bulk Density (kg/m³)
< 1.5
1.5 – 2.5
2.5 – 5.0
> 5.0
Permeability (cm/hr)
< 1.25
1.25 – 5.0
5.0 – 10.0
> 20
Content of N element (g/kg)
> 1.30
1.30 – 1.00
1.00 – 0.80
< 0.80
Content of Phosphorus element (mg/kg)
> 8
8 – 7
7 – 6
< 6
Content of Potassium element (cmol/kg)
> 0.16
0.16 – 0.14
0.14 – 0.12
< 0.12
Content of ESP (% of CEC)
< 10
10 – 25
25 – 50
> 50
Base Saturation (%) (decrease > 50%)
< 2.5
2.5 – 5
5 – 10
> 10
Excess salt (conductivity increase, mmhos/cm/yr)
< 2
2 – 5
3 – 5
> 5
Content of humus / organic matter (g/kg soil)
> 25
25 – 20
20 – 10
< 10
Key: Class 1: Non-to slightly degraded; Class 2: Moderately degraded; Class 3: Highly degraded; Class 4: Very highly degraded
Table 2: Interpretation Guide for Evaluating Analytical Data (a) Exchangeable Cations (Cmol/kg)
(a) Exchangeable Cations (Cmol/kg)
Ca3+ Mg2+ K+ Na+ Class
< 2 < 0.3 < 0.2 < 0.1 Very low
2 – 5 0.3 – 1 0.2 – 0.3 0.1 – 0.3 Low
5 – 10 1 – 3 0.3 – 0.6 0.3 – 0.7 Moderate
10 – 20 3 – 8 0.6 – 1.2 0.7 – 2 High
> 20 > 8 1.2 – 2.0 > 2 Very high
(b) Cation Exchange Capacity (Cmol/kg) (c) Percentage Base Saturation
(h) Total Nitrogen [8] (i) Available Phosphorus Enwezor et al. [9]
Range Class Bray 1 (mg/kg) Bray 2 (mg/kg)
< 0.1 Very low Range Class Range Class
0.1 – 0.2 Low < 8 Low < 15 Low
0.2 – 0.5 Medium 8 – 20 Medium 15 – 25 Medium
0.5 – 1.0 High > 20 High > 25 High
> 0.1 Very high
Source: Special Programmme for Food Security, Federal Ministry of Agriculture and Rural Development (FAO-FMARDSPFS, 2004)
RESULTS
The result of the meteorological data of the study area in the year 2017 is present on Table 3. It revealed that, total rainfall for the year was 1870.5 mm with most of it falling within the months of May and August. The highest rainfall was recorded in the month of May with 245.8 mm. The Months of November, December, January, February and March did not record any rain. The highest temperature was in the month of March with 89oC while the lowest was in the month of December with 18.2oC. Relative humidity–wise, the highest was obtained in the month of August while the lowest was in the month of February. The conditions recorded are in tune with those of the Southern Guinea Savanna Agroecological zone of Nigeria as was earlier established by Ojanuga [14].
Table 3: Meteorological Data of the study area for 2017
Month
Rainfall (mm)
Temperature (°C)
Relative Humidity (%)
Max.
Min.
Day
Night
January
0.0
36.4
20.3
49
24
February
0.0
38.1
20.3
31
11
March
0.0
39.5
26.8
59
31
April
86.3
36.3
25.7
70
47
May
245.8
33.2
24.5
78
63
June
123.9
32.1
23.5
80
68
July
95.7
31.0
22.5
84
70
August
224.3
30.1
22.9
86
74
September
158.7
31.1
23.7
82
70
October
73.9
34.6
22.6
88
76
November
0.6
36.0
22.9
69
40
December
0.0
35.6
18.2
51
31
Total Rainfall
1870.5
Source: Nigeria Meteorological Agency Unit, Tactical Air Command, NAF Base, Makurdi 2018
Table 4: Physical Properties of Soils of Jato-Aka Plains
Location
Depth (cm)
Sand (%)
Silt (%)
Clay (%)
Bulk Density (g cm⁻³)
Porosity (%)
Textural Class
Jato-Aka
0–15
81.20
6.10
12.70
1.41
46.79
Sandy clay loam
15–30
80.10
5.50
14.40
1.43
46.03
Sandy clay loam
30–45
79.20
5.60
15.20
1.43
46.03
Sandy clay loam
Iniongov
0–15
79.40
6.60
14.00
1.41
46.69
Sandy clay loam
15–30
80.20
6.60
13.20
1.37
48.31
Sandy clay loam
30–45
81.40
6.20
12.40
1.38
47.93
Sandy clay loam
Div
0–15
76.40
5.80
17.80
1.39
47.55
Sandy clay loam
15–30
78.80
5.70
15.50
1.39
47.55
Sandy clay loam
30–45
80.10
5.20
14.70
1.42
46.42
Sandy clay loam
Injorov
0–15
81.20
6.40
12.40
1.33
49.81
Sandy clay loam
15–30
81.80
6.20
12.00
1.36
48.68
Sandy clay loam
30–45
82.20
5.90
11.90
1.40
47.17
Sandy clay loam
Mbachon
0–15
74.10
17.50
8.40
1.22
53.96
Sandy clay loam
15–30
72.10
17.90
10.00
1.23
53.59
Sandy clay loam
30–35
69.80
17.90
12.30
1.23
53.59
Sandy clay loam
Physical Properties of Soils of Jato-Aka Plains
The result of the physical properties of the soils of Jato-Aka is presented on Table 4. It revealed that, for sand at 0 – 15 cm soil depth, percentage of sand varied from 75.10 % at Mbachon to 81.20 % at both Jato-Aka and Injorov. At 15 – 30 cm, it varied from 72.10% at Mbachon to 81.80 cm at Injorov while at 30 – 45 cm, it varied from 69.80 % at Mbabhon to 82.20 % at Injorov.
For Silt, at 0 – 15 cm, the lowest was at Div with 5.80 % and highest at Mbachon with 17.50 %. At 15 – 30 cm, the lowest was at Jato-Aka with 5.50 % and highest at Mbachon with 17.90 %. Further, at 30 – 45 cm, the lowest was 5.20 % at Div, while the highest was 17.90 % at Mbachon.
As regards the clay content of the soils, at 0 – 15 cm, the lowest was at Mbachon with 8.40 % and highest at Div with 17.80 %. At 15 – 30 cm depth, Mbachon had the lowest with 10.00 % while the highest was at Div 15.50 %. The lowest clay content at 30 – 45 cm was recorded at Injorov with 11.90 % and highest at Jato-Aka with 15.20 %.
The result of bulk density, also presented in Table 4 indicates that at 0 – 15 cm depth, the lowest bulk density of 1.22 gcm-3 was obtained at Mbachon and the highest was 1.41 gcm-3 at both Jato-Aka and Iniongov. At 15 – 30 cm, the lowest was at Mbachon with 1.23 gcm-3 and highest at Jato-Aka with 1.43 gcm-3. For the 30 – 45 cm depth, the lowest value of 1.23 gcm-3 was observed at Mbachon while the highest was at Jato-Aka with 1.43 gcm-3.
The porosity of the Jato-aka soils also varied. At 0 – 15 cm depth, the lowest value was obtained at Jato-Aka and Iniongov with 46.79 % while the highest was 53.96 % at Mbachon. For the 15 – 30 cm, the lowest was at Jato-Aka with 46.03 % and the highest value of porosity was obtained at Mbachon with 53.59%. The 30 – 35 cm depth recorded the lowest at Jato-Aka with 46.03 % and the highest value was at Mbachon with 53.59 %.
The textural class was sand clay loam across all depths and locations.
Chemical Properties of Soils of Jato-Aka Plains
The soil results of the chemical properties of the soils of Jato-Aka are presented on Table 5. In regards to pH, at 0 – 15 cm, the lowest was at Iniongov with 5.00 and the highest was 5.60 at Mbachon. At 15 – 30 cm, Iniongov had the lowest the lowest with 5.10 and highest of 5.62 was tat Mbachon. But at 30 – 45 cm, the lowest was 5.52 at Div while the highest value of 5.63 was obtained at both Iniongov and Mbachon.
With respect to organic matter of the soils, at 0 – 15 cm, the lowest value of 1.31% was obtained at Injorov, and the highest was at Mbachon with 2.20%. At the depth of 15 – 30 cm, the lowest value was obtained at Injorov with 1.01% and highest at Mbachon with 2.01%. For the 30 – 45 cm, the lowest value of 0.76% was at Injorov while the highest was at Mbachon with 1.16%.
The soil phosphorus content, at 0 – 15 cm, the lowest was found at Injorov with 6.16m g/kg and highest at Mbachon with 11.11 mg/kg. The 15 – 30 cm, the lowest value of 6.16 mg/kg was found at Injorov and highest at Mbachon with 8.20 mg/kg. But at depth of 30 – 45 cm, the lowest was at Iniongov with 0.96 mg/kg and highest at Div with 7.87 mg/kg.
In terms of nitrogen content, at the depth of 0 – 15 cm, the lowest was 0.15 g/kg at Injorov and the highest was 0.56 g/kg at Mbachon. For the depth of 15 – 30 cm, lowest value of 0.12 g/kg was obtained at Injorov and the highest was at Mbachon with 0.51g/kg. Whereas at 30 – 45 cm, the lowest was at Injorov with 0.09 g/kg and highest at Mbachon with 0.41 g/kg.
With respect to potassium content, at 0 – 15 cm, lowest value was obtained at Injorov with 0.18 cmol/kg and highest at Div with 0.41 cmol/kg. At the depth of 15 – 30 cm, the lowest was at Injorov with 0.19 cmol/kg and highest at Mbachon with 0.34 cmol/kg. At 30 – 45 cm, lowest value was at Injorov with 0.19 cmol/kg and the highest was at Mbachon with 0.34 cmol/kg.
For the sodium content of the soils, the 0 – 15 cm depth obtained lowest value of 0.11 cmol/kg at Jato-Aka and highest value of 0.22 cmol/kg at Mbachon. For the 15 – 30 cm depth, lowest value was at Jato-Aka with 0.13 cmol/kg and 0.22 cmol/kg as the highest at Mbachon. Further at 30 – 45 cm, the lowest was at both Jato-Aka and Iniongov with 0.13 cmol/kg and highest at Mbachon with 0.21 cmol/kg.
The calcium content of the soils at depth of 0 – 15 cm, indicates lowest value at Iniongov with 2.58 cmol/kg and the highest at Mbachon with 3.41 cmol/kg. At 15 – 30 cm, the lowest value was recorded at Jato-Aka with 3.08 cmol/kg and highest at Mbachon with 3.41 cmol/kg. For the 30 – 45 cm depth, the lowest value was obtained Iniongov with 2.68 cmol/kg and highest at Div with 3.25 cmol/kg.
The magnesium content of the soils at depth of 0 – 15 cm, shows lowest value at both Jato-Aka and Injorov with 0.29 cmol/kg and highest at Div with 0.31 cmol/kg. The depth of 15 – 30 cm, the lowest value was at both at Jato-Aka and Div with 0.26cmol/kg and highest value was obtained at Mbachon with 0.36 cmol/kg. At 30 – 45 cm, the lowest value was at Div and highest at Mbachon with 0.31 cmol/kg.
As regards the exchangeable acidity, the 0 – 15 cm depth presents lowest value at Div with 0.88 cmol/kg and highest value of 0.96 cmol/kg at both Jato-Aka and Div. For the 15 – 30 cm, Injorov had the lowest with 0.89 cmol/kg and the highest was at Mbachon with 0.98 cmol/kg. But at 30 – 45 cm, Injorov present the lowest value of 0.88 cmol/kg and the highest at Mbachon with 0.94 cmol/kg.
With respect to exchangeable bases, depth of 0 – 15 cm shows lowest value of 3.35 cmol/kg at Iniongove and highest at Mbachon with 4.37 cmol/kg. At 15 – 30 cm depth, lowest value was obtained at Jato-Aka with 3.73 cmol/kg and 4.35 cmol/kg was at Mbachon as the highest. The 30 – 45 cm depth, lowest value of 3.42 cmol/kg was found at Iniongov while the highest value of 4.08 cmol/kg was found at Mbachon.
For the Cation Exchange Capacity, at 0 – 15 cm, Iniongov had the lowest of 4.29 cmol/kg and highest of 5.27 cmol/kg at Mbachon. The depth of 15 – 30 cm shows lowest value of 4.66 cmol/kg at Jato-Aka and highest at Mbachon with 5.33 cmol/kg. The 30 – 45 cm, lowest value of 4.34 cmol/kg was at Iniongov and the highest was at Mbachon with 5.02 cmol/kg.
Regarding the base saturation of the soils, at 0 -15 cm depth, Iniongov obtained the lowest value of 78.09 % and the highest was at Mbachon with 82.92 %. At 15 – 30 cm depth, Jato-Aka had the lowest value of 80.04 % and the highest at both Injorov and Mbachon with 81.61 %. Further down the depth, at 30 – 45 cm, Iniongov had the lowest value of 78.80 % while the highest was at Injorov with 81.44 %.
Table 5: Some Chemical Properties of Soils of Jato-A ka Plains
Cmol/kg
Location
Depth (cm)
pH
OM (%)
P g/kg
N mg/kg
K
Na
Ca
Mg
E A
E B
CEC BS %
Jato-Aka
0-15
5.10
1.60
7.70
0.21
0.21
0.11
3.12
0.29
0.96
3.73
4.69
79.53
--
-
15-30
5.25
1.20
7.68
0.18
0.26
0.13
3.08
0.26
0.93
3.73
4.66
80.04
-
-
30-45
5.61
0.90
7.68
0.18
0.26
0.13
3.08
0.27
0.93
3.74
4.67
80.09
-
Iniongov
0-15
5.00
1.35
6.41
0.16
0.31
0.16
2.58
0.30
0.94
3.35
4.29
78.09
-
-
15-30
5.10
1.10
6.31
0.15
0.31
0.14
3.10
0.31
0.90
3.86
4.76
81.09
-
-
30-45
5.63
0.96
6.01
0.15
0.33
0.13
2.68
0.28
0.92
3.42
4.34
78.80
-
Div
-
0-15
5.20
1.72
8.33
0.51
0.41
0.18
3.31
0.31
0.96
4.21
5.17
81.40
-
15-30
5.40
1.22
8.10
0.42
0.32
0.15
3.29
0.26
0.97
4.02
4.99
80.56
-
-
30-45
5.52
0.85
7.87
0.39
0.30
0.17
3.25
0.24
0.91
3.96
4.87
81.31
-
Injorov
0-15
-
5.30
1.31
6.21
0.15
0.18
0.16
3.33
0.29
0.88
3.96
4.84
81.82
-
-
15-30
5.61
1.01
6.16
0.12
0.19
0.18
3.31
0.27
0.89
3.95
4.84
81.61
-
-
30-45
5.61
0.79
6.15
0.09
0.19
0.16
3.24
0.27
0.88
3.86
4.74
81.44
-
Mbachon
0-15
-
5.60
2.20
11.11
0.56
0.32
0.22
3.41
0.42
0.90
4.37
5.27
82.92
-
15-30
5.62
2.01
8.20
0.51
0.34
0.24
3.41
0.36
0.98
4.35
5.33
81.61
-
30-45
5.63
1.60
7.36
0.41
0.34
0.21
3.22
0.31
0.94
4.08
5.02
81.28
-
KEY: OM = Organic Matter, E A = Exchangeable Acidity, E B = Exchangeable Base, CEC = Cation Exchange Capacity, B D = Bul Density
Status of Degradation of the Physical Properties of Soils of Jato-Aka Plains
The status of the physical properties of the soils of Jato-Aka plains is presented in Table 6. The status of the physical properties of the soils of Jato-Aka plains revealed that bulk density was Non to slightly degraded, whereas the porosity was moderate except at Mbachon where it was high.
Status of the Degradation of the Chemical Properties of the Soils of Jato-Aka Plains
The status of chemical properties of the soils of Jato-Aka plains is presented in Table 7. The pH at 0 – 15 cm soil depth varied from moderately acidic to very strongly acidic across all the locations. At 15 – 30 cm, it was strongly in all the locations except at Injorov where it was moderately acidic. For the 30 – 45 cm, it was moderately acidic at Jato-Aka, Iniongov and Injorov, while it was strongly acidic at Div and Mbachon.
The status of the organic matter content of the soils of Jato-Aka plains shows that in all the locations and depths, it was very low, except at depth of 0 – 15 and 15 – 30 cm at Mbachon where it was low.The status of phosphorus in the soils of the Jato-Aka plains reveals that phosphorus was generally low, but both at Div and Mbachon it was medium at 0 – 15 and 15 – 30 cm.
The status of soil nitrogen, across the depths in the different locations varied, being moderate at Jato-Aka at 0 – 15 cm, Div at 15 – 45 cm and Injorov at 0 – 45 cm. Whereas, it was very low at 30 – 45 cm at Injorov and high at 0 – 30 cm depth at Mbachon.
For the exchangeable bases, the status of potassiumwas generally moderate in all the locations, except at Jato-Aka where it was low at 0 – 45 cm and Div at 30 – 45 cm. At Injorov, it was very low at 0 – 45 cm. The status of the sodium in all the soils and depths was low. This was the same trend for calcium. However, for magnesium, its status was very low in the locations, except at Iniongov at 0 – 30 cm, at Div at 0 – 15 cm and at 0 – 45 cm at Mbachon where it was low.
The cation exchange capacityof the soils of Jato-Aka was generally very low, while the base saturation was very high. The few deviations were at Jato-Aka at 0 – 15 cm and at Iniongov at 0 – 15 and 30 – 45 cm depths.
Table 6: Status of Degradation of the Physical Properties of Soils of Jato-Aka Plains
Location
Depth (cm)
Bulk Density (gcm-3)
Porosity (%)
Jato-Aka
0 – 15
NSD
M
15 – 30
30 – 45
NSD
M
NSD
M
Iniongov
0 – 15
NSD
M
15 – 30
NSD
M
30 – 45
NSD
M
Div
0 – 15
NSD
M
15 – 30
NSD
M
30 – 45
NSD
M
Injorov
0 – 15
NSD
M
15 – 30
NSD
M
30 – 45
NSD
M
Mbachon
0 – 15
NSD
H
15 – 30
NSD
H
30 – 45
NSD
H
KEY: NSD = Non to Slightly Degraded; MD = Moderately Degraded; HD = Highly Degraded, VHD = Very Highly Degraded; M = Moderate; H = High
Table 7: Status of the Degradation of the Chemical Properties of Soils of Jato-Aka Plains
Cmol/kg
Location
Depth (cm)
pH
OM (%)
P (mg/kg)
N (g/kg)
K
Na
Ca
Mg
CEC
BS (%)
Jato-Aka
0-15
SA
VL
L
-
M
-
L
L
L
VL
VL
H
-
15- 30
SA
VL
L
-
L
-
L
L
L
VL
VL
VH
-
30 -45
MA
VL
L
-
L
-
L
L
L
VL
VL
VH
Iniongov
0-15
-
VSA
VL
L
-
L
-
M
L
L
L
VL
H
-
15-30
SA
VL
L
-
L
-
M
L
L
L
VL
VH
-
30-45
MA VL
L
-
L
-
M
L
L
VL
VL
H
-
Div
-
0-15
-
SA
VL
M
-
H
M
L
L
L
VL
VH
-
15-30
SA
VL
M
-
M
-
M
L
L
VL
VL
VH
-
30-45
SA
VL
L
-
M
-
L
L
L
VL
VL
VH
Injorov
0-15
-
SA
VL
L
-
L
-
VL
L
L
VL
VL
VH
-
15-30
MA
VL
L
-
L
-
VL
L
L
VL
VL
VH
-
30-45
MA
VL
L
-
VL
-
VL
L
L
VL
VL
VH
Mbachon
0-15
MA
LM
-
H
-
M
L
L
L
VL
VH
-
15-30
SA
L
M
-
H
-
M
L
L
L
VL
VH
30-45
SA
VL
L
-
M
-
M
L
L
L
VL
VH
KEY: SA = Slightly Acidic; MA = Moderately Acidic; VSA = Very Strongly Acidic; VL = Very Low; L = Low; M = Moderate; H = High; VH = Very High
DISCUSSION
The results of the soil physical properties of the soils of Jato-Aka revealed that their bulk density ranged from non to slightly degraded condition. This means that the soils are conducive for cultivation. This is in relation to the fact that their textural class is sandy clay loam. This is in agreement with the work of Igomu [15] who had bulk density of slightly to non-degraded soil at Effa, Igbo’lokpe and Odoba. Wuese [16] working on similar textured soils in Makurdi obtained bulk density of 1.46 g/cm-3. The porosity of the soils was largely moderate. This implies that there was sufficient aeration of the soil.
The results of the chemical properties indicated that the soils were moderately to strongly acidic. This has implications for nutrient availability. Harpstead [17] reported that Guinea Savanaa soils were less leached and are slightly to moderately acid in reaction while Igomu [15] obtained slightly to strongly acid soils reaction. This means that liming to bring the soils to a conducive point is advocated. Otherwise, biological N – fixation which by far contributes to increased soil nitrogen content would be hampered [18]. Again, Agbede [19] asserted that low soil pH values could be responsible for low content of N, P, Ca2+, Mg2+, Na+, and K+.
The soil organic matter content varied from low to very low. Soil organic matter is a rich source of plant nutrients [20]. It is a vital soil property to erosion control water infiltration, soil structure stabilization and conservation of soil nutrients [21]. Upon organic matter decomposition, its inherent nutrients become available in the soil for plant use. Harpstead [17] reported that low organic matter is a phenomenon associated with tropical soils due to high temperatures that rapidly breakdown organic matter and inhibit nitrogen fixation by rhizobia. This makes soil organic matter a very desirable feature in Guinea Savanna soils.
The soil phosphorus content was generally low while the nitrogen ranged from moderate to very low. Aduayi et al. [22] had earlier stated that most Nigerian soils are deficient in nitrogen, phosphorus and potassium. According to Agbede [19], nitrogen is a key nutrient which is used as a good soil quality indicator as it is one of the most important of all the 16 essential plant nutrients needed for plant growth, development and reproduction and that it is the most easily limiting or deficient throughout the world especially in the tropics. Elsewhere in south-eastern Nigeria Ogban et al. [23] carried out soil assessment and also concluded that their soils were low in total nitrogen content. The low phosphorus in this study might have been as a direct consequence of low soil pH. This view was earlier confirmed by Onyekanne et al. [24].
The soil potassium content was moderate while that of magnesium was very low. The content of both sodium and calcium were low. Low availability of exchangeable cations is associated with low pH [19]. The continuous leaching that may have been taking place on these soils could be another explanation for this observation.
The base saturation was very high. Wuese et al. [16] obtained similar result in Agasha. They attributed it to low organic matter levels. In order to improve the soil quality, organic fertilizers fortified with inorganic fertilizers, suitable cropping system/combinations are recommended [25]. They further said controlled fallow which involve use of crops that produce high biomass rapidly should be included in the fallow such as mucuna, sunflower and chromolaena odorata. Mulch farming should also be encouraged to facilitate aggressive organic matter accumulation in the soil with its attendant benefits.
CONCLUSION
It can be concluded that the soils of Jato-Aka plans are inherently low in soil fertility except along the flood plain soils of Mbachon where prospects of good soil existed.The soils were Non to Slightly Degraded in bulk density and having moderate to high porosity status. Chemically, they were strongly acidic, very low in organic matter content, low in phosphorus and nitrogen, moderate in potassium, low in sodium, calcium and magnesium. The cation exchange capacity was very low while the base saturation was very high.
Recommendations
Arising from this research, it can be recommended that liming be introduced into the soil fertility programme of the study area to reduce soil acidity and bring it to higher productivity. Also, mulching and other forms of organic matter additions are strongly advocated alongside inorganic fertilization based on the soil analysis result available for each location in order to increase soil fertility and boost crop production.
REFERENCE
UNEP. Global environment outlook 4 (GEO-4). 2006, pp. 527
UNCCD. Desertification, land degradation and drought (DLDD): Some global facts and figures. United Nations Convention to Combat Desertification, 2015.
Lal, R. “Soil degradation as a reason for inadequate human nutrition.” Food Science, vol. 1, 2009, pp. 45–57.
Barrow, C.J. Land degradation, development and breakdown of terrestrial environments. Cambridge University Press, 1991, pp. 295
Chukwu, A.O. et al. “Farmers perception on the use of inorganic fertilizer in yam production on eroded soil of south eastern Nigeria.” International Journal of Agriculture and Bioscience, vol. 2, no. 5, 2003, pp. 281–285.
Osabuomen, J.I. and D.U. Okogie. “Analysis of the effect of crop production practice among farmers on environmental degradation in Edo State Nigeria.” Archives of Applied Science Research, vol. 3, no. 2, 2011, pp. 353–360.
Fasina, A.S. et al. “Influence of land use on soil properties in three mapping units in south western Nigeria – implications for sustainable soil management.” 2007.
Metson, A.J. Methods of chemical analysis of soil survey samples. Government Printers, 1961, pp. 207
Enwezor, W.O. et al.Fertilizer use and management for crops in Nigeria. Federal Ministry of Agriculture, Water Resources and Rural Development, 1989, pp. 163
Bouyoucos, G.H. “A recalibration of the hydrometer method for making mechanical analysis of soil.” Agronomy Journal, vol. 43, 1951, pp. 434–438.
Walkley, A. and I.A. Black. “An examination of the Degtjareff method of determining soil organic matter and proposed modification of the chromic acid titration method.” Soil Science, vol. 37, 1934, pp. 29–38.
Jackson, J.M. Methods of soil analysis, part II. United States Department of Agriculture Monograph no. 9, 1965, 24 pp.
Bray, R.H. and L.T. Kurtz. “Determination of total, organic and available forms of phosphorus in soils.” Soil Science, vol. 59, 1945, pp. 39–45.
Ojanuga, A.G. Agroecological zones of Nigeria. National Special Programme for Food Security, 2006, pp. 38–40.
Igomu, E.A. Land degradation assessment of Effa, Igbo’lokpe and Odoba areas of Benue State. Unpublished M.Sc. thesis, University of Agriculture, 2016, pp. 111
Wuese, S.T. Consumptive and water use efficiency of okra (Abelmoschus esculentus L. Moench) in Makurdi, southern Guinea Savanna agroecological zone of Nigeria. Unpublished PhD thesis, 2018.
Harpstead, M.T. “The classification of some Nigerian soils.” Soil Science, vol. 166, 1973, pp. 437–442.
Anderson, H.A. and D. Vaughan. “Soil nitrogen: Its extraction, distribution and dynamics.” Soil organic matter and biological activity, edited by D. Vaughan and R.E. Malcolm, Developments in Plant and Soil Science, vol. 16, 1985, pp. 304–310.
Agbede, O.O. Understanding soils and plant nutrition. 1st ed., Salman Press and Co. Nigeria Ltd., 2009.
Wuese, S.T. et al. “Degradation status of soils of Agasha Plains, Guma Local Government Area, Benue State.” Journal of Biological and Chemical Research, vol. 35, no. 2, 2018, pp. 527–537.
Franzluebbers, A. et al. “Tillage and residue management effects on soil organic matter.” Soil organic matter in sustainable agriculture, CRC Press, 2004, pp. 227–268.
Aduayi, E.A. et al.Fertilizer use and management practices for crops in Nigeria. 3rd ed., S.B. Garko International Limited, 2002, pp. 67–70.
Ogban, P.I. and I.D. Edem. “Physical fertility of degraded acid sands in south eastern Nigeria.” Nigerian Journal of Soil Science, vol. 15, 2005, pp. 102–108.
Onyekanne, C.E. et al. “Characterization and classification of soils of Ideato North Local Government Area.” Nigerian Journal of Soil Science, vol. 22, no. 1, 2012, pp. 11–17.
Ande, O.T. and B.A. Senjobi. “Land degradation assessment of agrarian soils of Ebonyi State for sustainable production.” Journal of Ecology and the Natural Environment, vol. 6, no. 6, 2014, pp. 200–204.
Appendix
Appendix 1
Soil Porosity Rating (%)
Ranges
Class
<40*
Very low
40-45*
Low
45-50*
Moderate
50-55*
High
>55*
Very High
*Proposed
Recommended Articles
Research Article
Strategy of Cocoa Commodity Based Agrowisata Development in Jembrana Regency
I Gusti Ayu Widari Upadani,
...
Luh Putu Kirana Pratiwi
Published: 30/01/2021
Download PDF
Research Article
Survey on the pollutants effect of some physicals and chemicals characteristics of the White Nile River around Khartoum state in the Sudan
Zeinb E. Elamean,
...
Egbal Osman Ahmed
Published: 20/01/2021
Download PDF
Research Article
Effecting of Hormonal Gonads (Test, Lh, Pro) and Dopamine on Transitional Nuclear Protein /1 Gene Frequency in an Infertile-Men
Taleb K. Odah
Published: 18/09/2023
Download PDF
Research Article
Growth and Yield Performance of “Sakurab” Scallion Green Onion (Allium Fistulusom L.) Under Different Rates of Chicken Dung and Sources of Soil Amendment
Rashdi Macalangcom Casim
Published: 20/01/2021
Download PDF
PO Box 101, Nakuru
Kenya.
Email: office@iarconsortium.org
Editorial Office:
J.L Bhavan, Near Radison Blu Hotel,
Jalukbari, Guwahati-India
Wuese, S. T., Jayeoba, J. & Kwaghsar, A. I. (2022). Assessment of the Degradation Status of Soils of Jato-Aka Plains, Kwande Local Government Area of Benue State for Agricultural Use. IAR Journal of Agriculture Research and Life Sciences, 3(2), 1-8.
MLA
Wuese, S. T., J. Jayeoba and A. I. Kwaghsar. "Assessment of the Degradation Status of Soils of Jato-Aka Plains, Kwande Local Government Area of Benue State for Agricultural Use." IAR Journal of Agriculture Research and Life Sciences 3.2 (2022): 1-8.
Chicago
Wuese, S. T., J. Jayeoba and A. I. Kwaghsar. "Assessment of the Degradation Status of Soils of Jato-Aka Plains, Kwande Local Government Area of Benue State for Agricultural Use." IAR Journal of Agriculture Research and Life Sciences 3, no. 2 (2022): 1-8.
Harvard
Wuese, S. T., Jayeoba, J. and Kwaghsar, A. I. (2022) 'Assessment of the Degradation Status of Soils of Jato-Aka Plains, Kwande Local Government Area of Benue State for Agricultural Use' IAR Journal of Agriculture Research and Life Sciences 3(2), pp. 1-8.
Vancouver
Wuese ST, Jayeoba J, Kwaghsar AI. Assessment of the Degradation Status of Soils of Jato-Aka Plains, Kwande Local Government Area of Benue State for Agricultural Use. IAR Journal of Agriculture Research and Life Sciences. 2022 Jul;3(2):1-8.


 Download PDF
 Download XML