Bioremediation of Municipal Wastewater using Consortium of Chlorogium sp, Chlorella sorokiniana and Microcystis aeriginosa at River Ginzo Katsina State, Nigeria
M. B. Adamasi
1
,
A. Safana
1
,
B. A. Bdulkarim
1
,
B. A. Abdullahi
2
,
S. Kabir
2
1
Department of Biology Umaru Musa Yar’adua University Katsina, Nigeria
2
Department of Biological Science Bayero University Kano, Nigeria
This study was conducted to study Bioremediation of Municipal Wastewater using Consortium of Chlorogium sp, Chlorella sorokiniana and Microcystis aeriginosa from River Ginzo Municipal wastewater of Katsina Metropolis using standard methods and procedures. Waste water samples were collected between May and June 2020. Agar plating was used for the isolation of individual species and BG-11 media were used for the culture of isolated microalgae. Twelve flasks 100 ml wastewater samples in 250 ml conical flasks) were prepared. Each of the twelve flasks was inoculated with 10 ml of cultured individual microalgae suspensions. Samples were analyzed every week. Results showed pH remaining around neutral values and indicated increases in dissolved oxygen (DO) on both species; Also both of the species indicated potentials in the reduction of physico-chemical parameters; Chologonium sp (total dissolved solid 57.7%, nitrate 99.96%, phosphorus 100%, ammonium 99.98%, potassium 91.65%, zinc 87.03%, manganese 90.63%, iron 79.44%, copper 50.62%, nickel 30.10%. Chlorella sorokiniana (total dissolved solid 76.63%, nitrate 100%, phosphorus 97.39%, ammonium 99.46%, potassium 100%, zinc 96.29%, manganese 78.81%, iron 90.03%, copper 100%, nickel 4. 83%). Microcystis aeruginosa (total dissolved solid 34.85%, nitrate 75.73%, phosphorus 92.73%, ammonium 93.03%, potassium 99.53%, zinc 75.92%, manganese 85.57%, iron 98.92%, copper 6.87%, nickel 71.76%). Bioremediation uses naturally occurring microorganisms and other aspects of the natural environment to treat wastewater of its nutrients Therefore remediation of diverse wastewater is possible using (Chlorella sorokiniana, Chlorogonium sp and Microcystis aeruginosa).
Keywords
Bioremediation
Microalgae
Wastewater
Isolation and Sample
INTRODUCTION
Bioremediation is the use of micro or macro algae for the removal of pollutants including xenobiotics and nutrients from wastewater and CO2 from emitted waste air [1]. Bioremediation with microalgae is particularly effective because of their capabilities of converting solar energy into useful biomasses and assimilate nutrients such as phosphorus and nitrogen which cause eutrophication in the process of photosynthesis [2]. The microalgae depend on many factors in the laboratory or in nature, such as temperature, light, salinity and nutritional factors that influence the growth, physiological activities and biochemical composition [3].
Bioremediation uses naturally occurring microorganisms and other aspects of the natural environment to treat wastewater of its nutrients. Bioremediation can prove less expensive than other technologies that are used for cleanup of hazardous waste [4]. Algae are universally acknowledged as playing a very important role in natural water purification process [1,5].
Wastewaters are unique in their chemical profile and physical characteristics as compared with fresh and marine waters [6].
The major effect of releasing wastewater rich in organic compounds and inorganic chemicals such as phosphates and nitrates is mainly eutrophication Godos et al. [7]. This is a global problem that can be solved by the use of microalgae whereby the wastewater is used as feed for microalgae to growth [1].
MATERIALS AND METHODS
Study Area
River Ginzo is situated along Kofar Durbi, KofarMarusa and Kofar Sauri within metropolis in Katsina state. The River has a GPS of 12 °, 59’, 197” N and 007 ° 36’, 875” E.
The activities of the people around the area are, irrigation farming, washing vehicles and other domestic activities such as washing clothes, cars and other vehicles.
Collection of Wastewater Samples
Domestic wastewater samples in this study were collected from sewage municipal wastewater of Katsina Metropolis (River Ginzo) between May and June 2020. Water samples were collected using 2-litre dark brown bottle as described by Indabawa.
Media Preparation and Enrichment of Culture in the Media
BG-11 media were prepared using standard procedures as developed by the manufacturers. Collected wastewater samples were brought to the laboratory and the samples were centrifuged at 2000 rpm for 20 minutes. Centrifugation and washing were repeated six times in order to expel most of the microorganisms present in algal samples and the cells were then inoculated into sterile conical flasks containing media and this was incubated for weeks by providing required environmental condition such as 12:12h light/dark photoperiods and a temperature of 25°C.
Identification and Isolation of Microalg
Agar plating was used for the isolation of individual species, for isolation, the inoculation loop loaded with the natural water sample were streaked across the agar surface, similar to the microbiological method used for bacteria. After incubation for few days, the colonies originating on the surface of agar plates was removed with nichrome bacterial loop or using micropipette tip and immersed into the liquid media or onto another agar plate.
The microalgae samples were subjected to microscopic observation for correct identification using compound digital microscope. A standard phycological key described by Edward and David, was used for the determination and identification of species.
Growth and Maintenance in Media
For the maintenance of algal cultured, broth was prepared and each identified algal species were inoculated into. These were kept for incubation at 25°C provide with 12:12 h light/dark photoperiods. The culture was maintained both in slants and broth cultures for future use.
Microalgae Cell Counting
A cover slip was used to cover the grids of the haemacytometer and a pipette was used to fill its chamber. The pipette was placed at the tip of the haemacytometer and the sample flows into the chamber by capillary action. Cells were allowed settled and checked under microscope for satisfactory distribution of cells. The grid was divided into 9 large squares, each large square was divided into 25 medium squares and each medium square was further divided into 16 small squares. For essential measurement, the typical number of cells of the centre large square were counted, the procedure were repeated twice. The cell density obtains by multiplying the average cell count for each species by conversion factor for Neubauer (х104). The X40 objective lens was used to count the cells. The average number of cells was counted weekly for ten weeks.
Collection of Wastewater (Sampling of Wastewater Effluent)
For the treatment of effluent, the domestic wastewater samples in this study was collected from sewage municipal Wastewater River Ginzo Katsina. Water samples were collected in a 2 litre bottles which were washed with 10% HNO3 for 48 hrs, labeled and few drops of HNO3 were added to prevent loss of metals using grab sampling techniques.
Physico-Chemical Analysis of Water Samples
The initial physico-chemical analysis of water samples were measured before inoculation using standard methods.
Remediation Bioassay in Laboratory
For each species, twelve flasks (100 ml wastewater samples in 250 ml conical flasks) were prepared. Each of the twelve flasks was inoculated with 10 ml of cultured individual microalgae suspensions. These was further Incubated under temperature of 25°C provide with 12/12h light/dark photoperiods for a period of four weeks.
Samples were periodically analyzed (every week) for each physico-chemical parameter such as pH, TDS, phosphorus, nitrate, ammonium, DO (dissolved oxygen) and heavy metals, using standard methods.
Data Analyses
Analysis of variance (ANOVA) was used to compare physicochemical parameters before and after treatment at7days interval. The level of significant of p≤0.05 was used. Graph pad statistical software version 6.0 was used for the analyses.
RESULTS AND DISCUSSION
In this research findings three difference species of phytoplankton were used for bioremediation (Chlorella sorokiniana, Chlorogoniumsp and Microcystisaeruginosa) in which both of species shows significant different in production of biomass from initial week to week ten (Table 1). This agreed with the findings of. Arrendondo-Figueroa et al. [8] whom reported that, some algal species showed similar growing potentials when cultivated in wastewater, as well as when cultivated in the control media. Chan [9], conducted research by cultivating the microalgae in wastewater from a fish farm and established that they can promote the growth of Chlorella sp. and they obtained a 90% growth rate during the experimental period. The finding of this research agreed with the finding of Changfu et al. [10] whom stated that, growth of microalgae depends mainly on the nutrients present in the wastewater or media (Table 2-7).
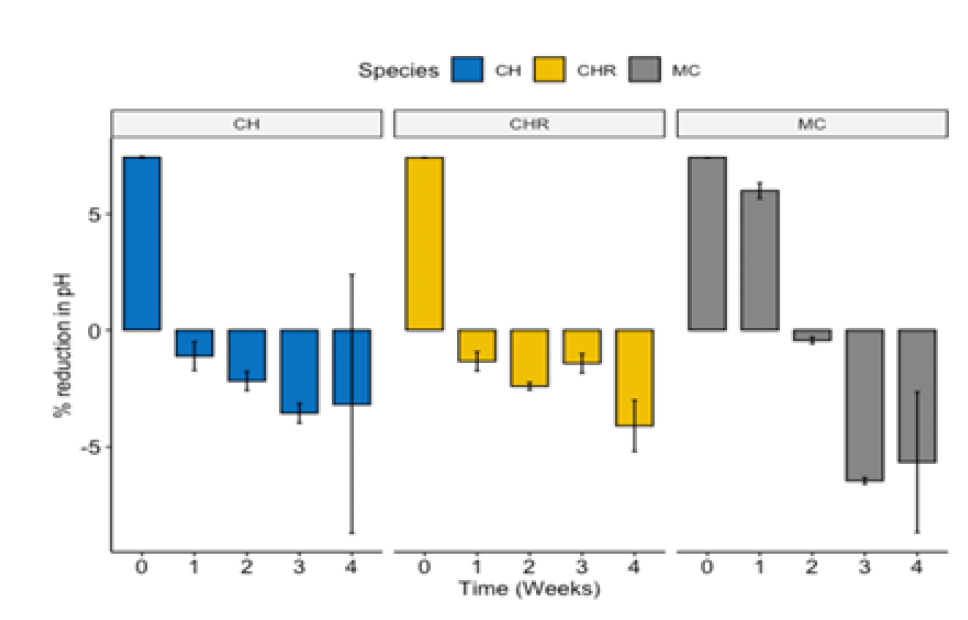
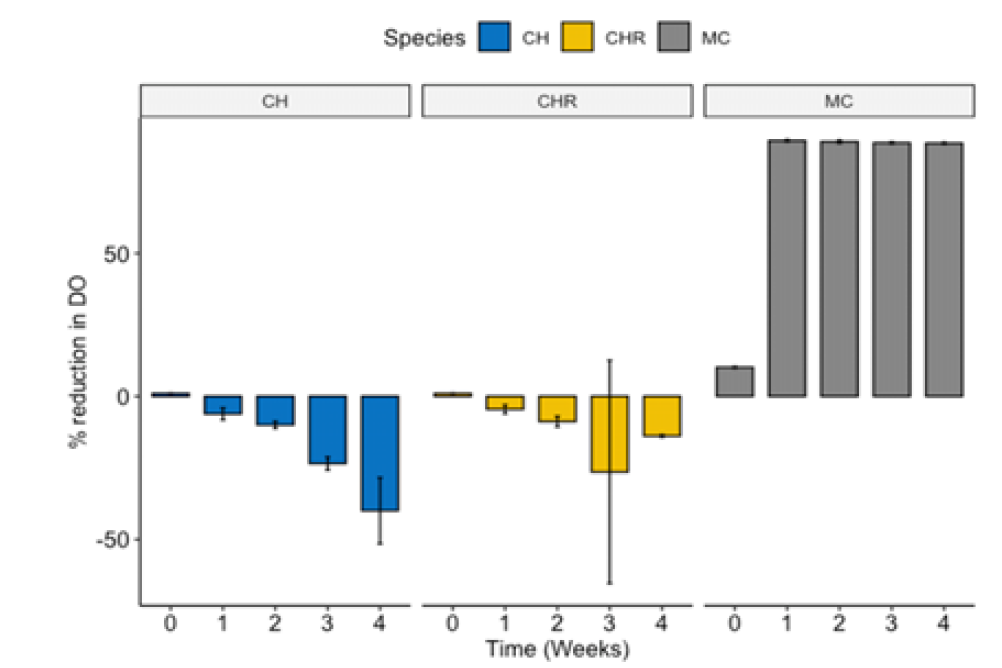
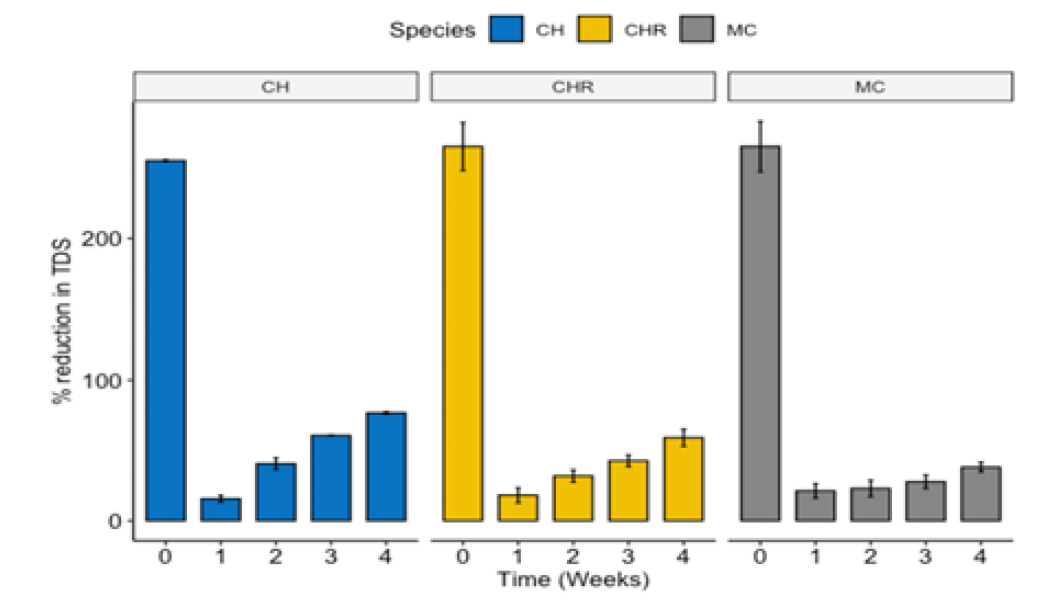
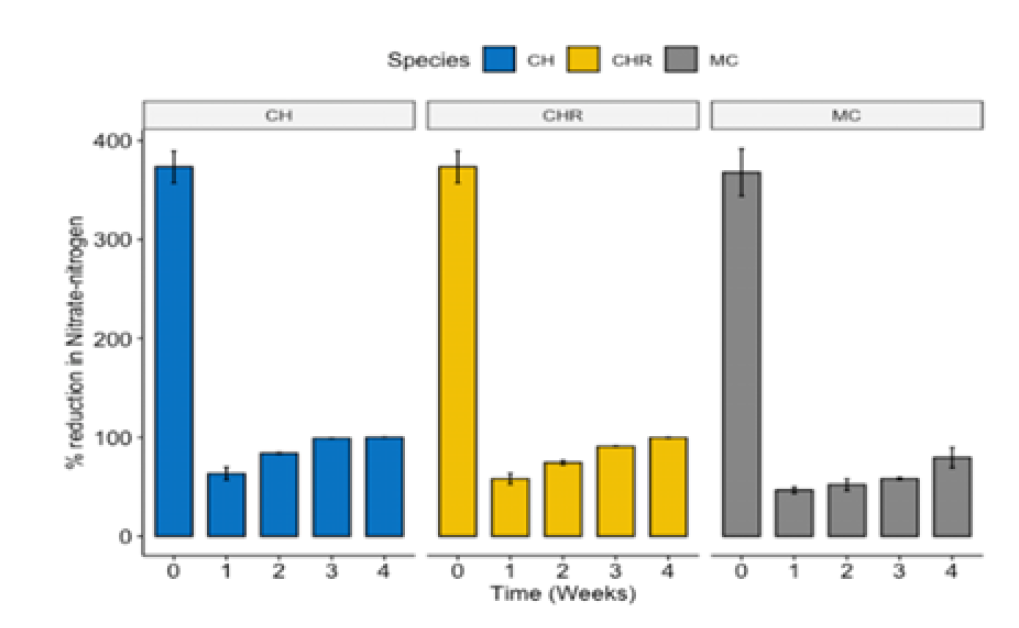
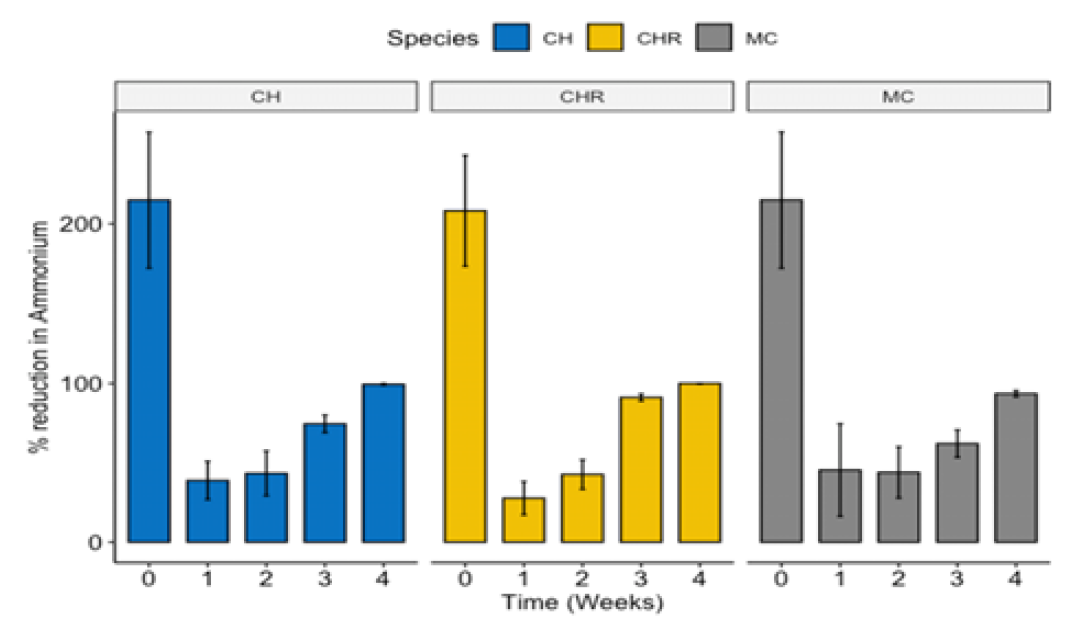
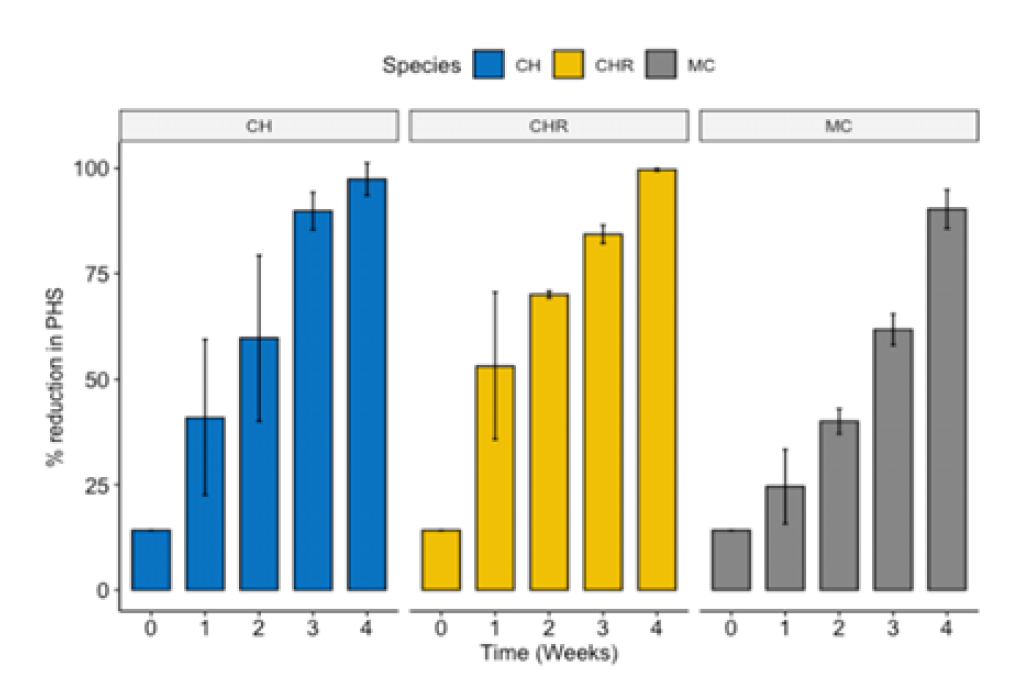
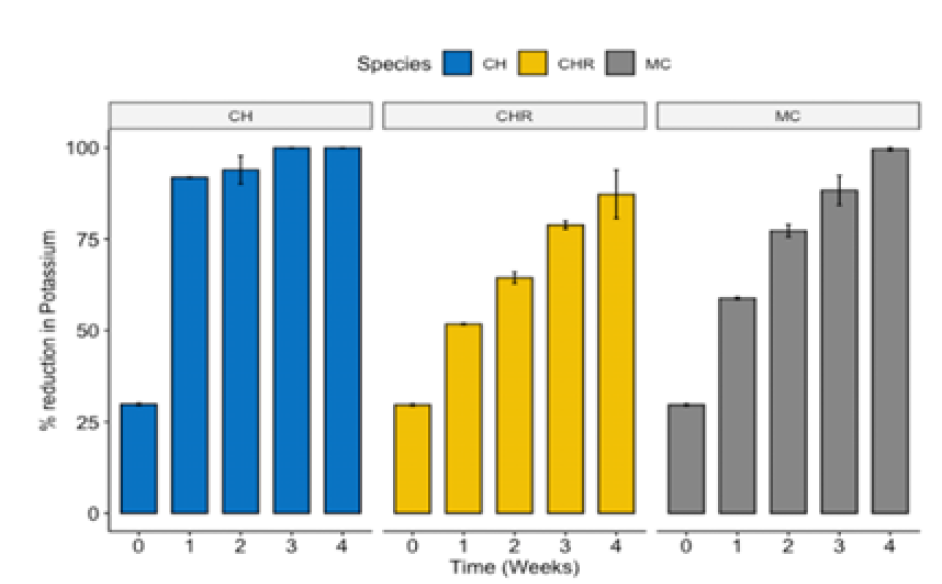
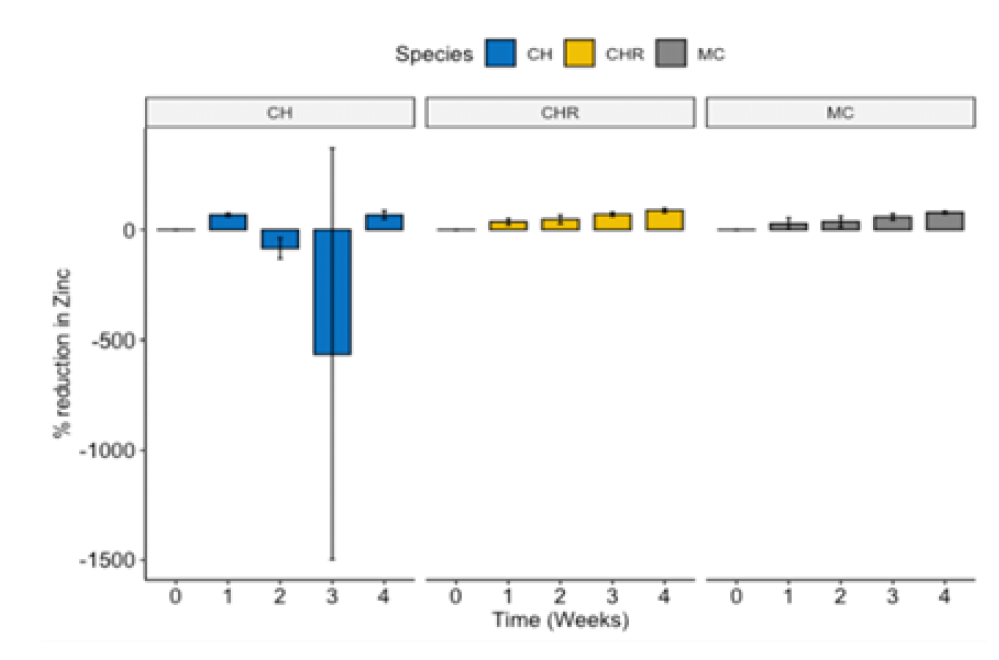
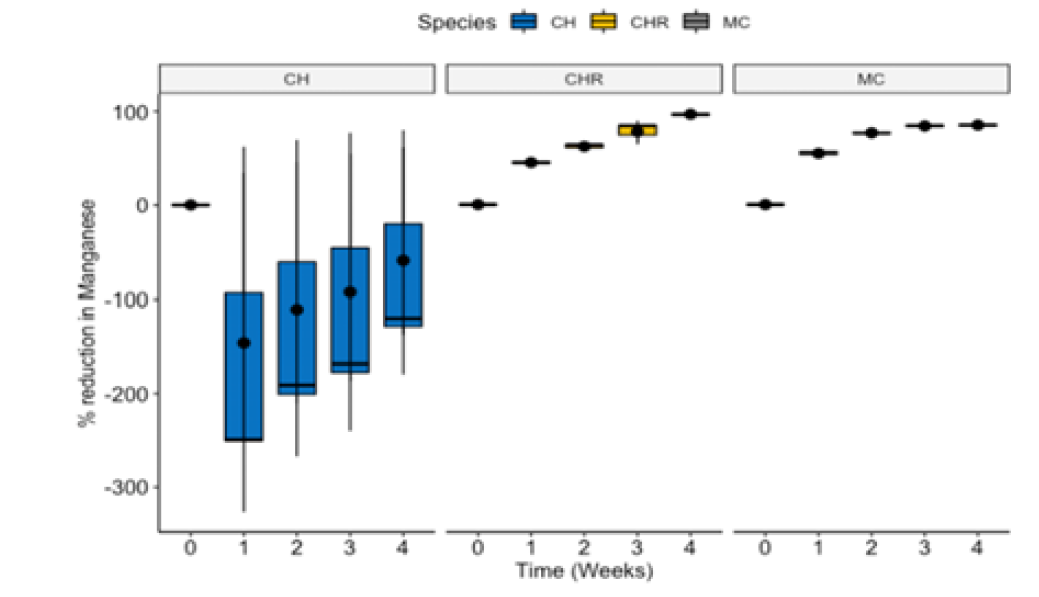
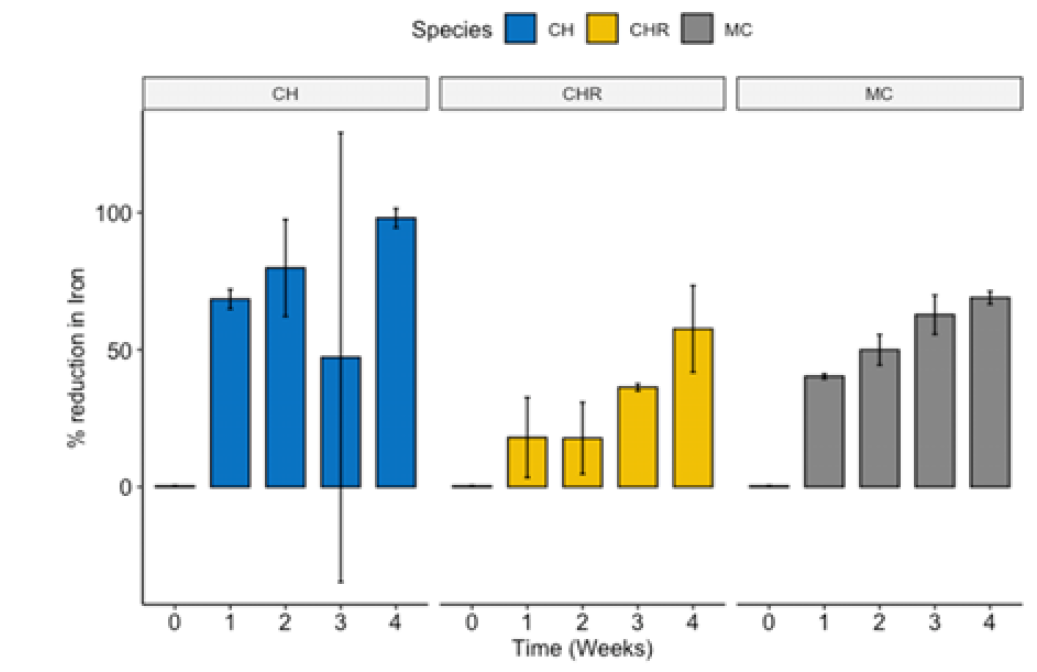
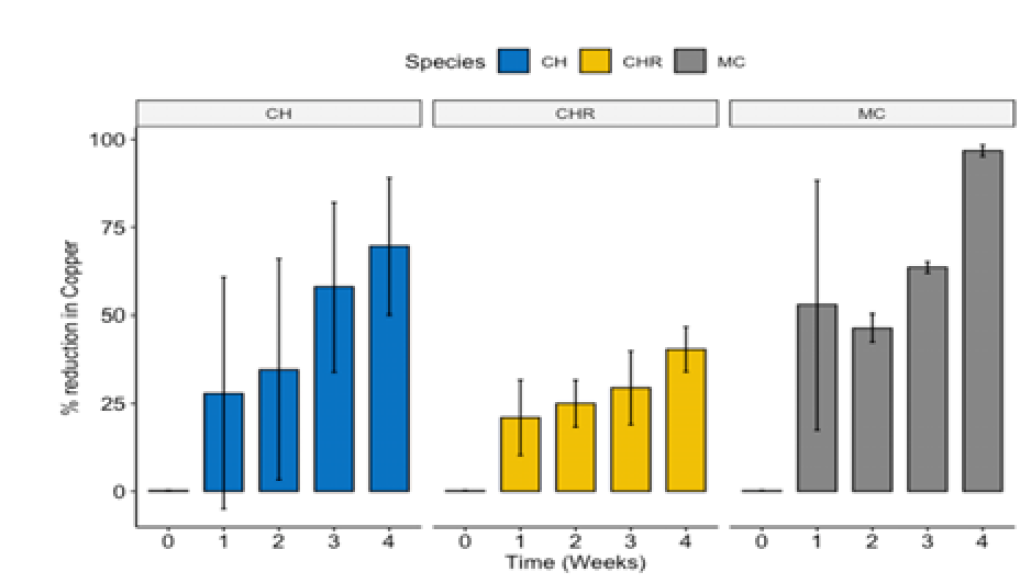
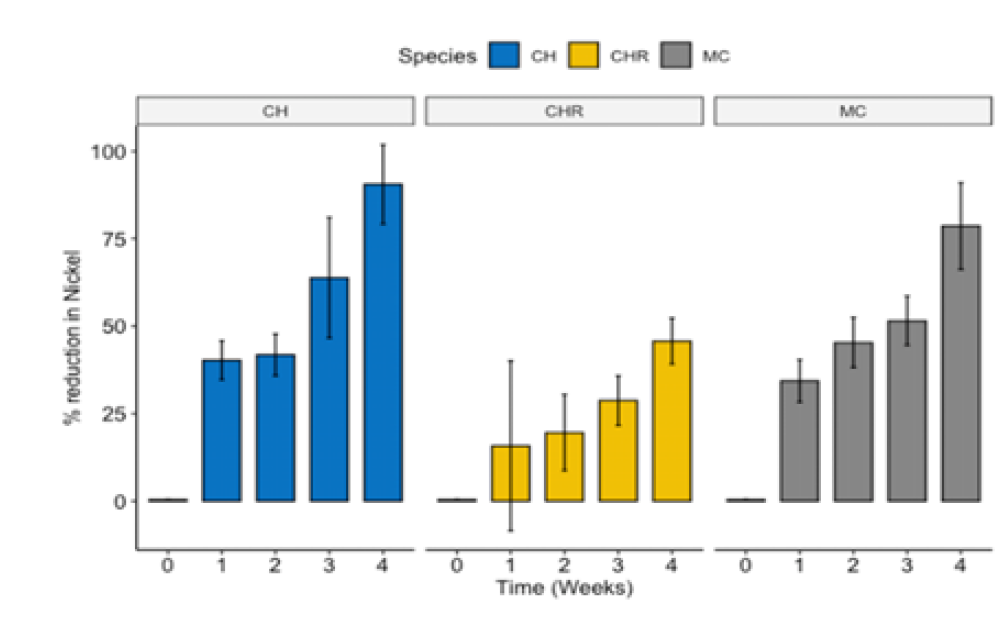
(Figure 1-12) Shows comparison potentiality of different species of microalgae in bioremediation of wastewater effluents. CH-(Chlorella sorokiniana, CHR- Chlorogonium sp MC- Microcystisae ruginosa).
Table 1: Average Growth of Three Different Isolated Microalgal Species for Ten Weeks
CELLS/mL SD
Week/ALGAL
Chlorella sorokiniana
Chlorogoniumsp
Microcystistaeruginosa
week 1
(6.33±2.31) x104
(12.16±5.11) x104
(16.83±4.65) x104
week 2
(6.87±2.21) x104
(13.66±3.51) x104
(23.33±4.01) x104
week 3
(9.33±4.01) x104
(38.33±5.69) x104
(23.67±1.53) x104
week 4
(15.33±5.50) x104
(44.67±4.51) x104
(39.5±3.28) x104
week 5
(17.00±6.54) x104
(51.00±12.21) x104
(40.33±3.62) x104
week 6
(26.47±4.38) x104
(60.5±3.50) x104
(73.00±11.36) x104
week 7
(27.00±4.36) x104
(63.00±6.05) x104
(82.00±13.00) x104
week 8
(28.33±5.51) x104
(66.33±6.03) x104
(102.00±5.29) x104
week 9
(38.33±11.9) x104
(70.00±1.00) x104
(115.0±10.44) x104
week 10
(53.33±26.60) x104
(73.167±3.33) x104
(133.50±14.08) x104
Table 2: Bioremediation of Municipal Wastewater Using Single Specie (Chlorogoniumsp) At Temperature of 250C, 12:12h Light/Dark Photoperiod
S/N
Parameters
Before Treatment
After Treatment
1st week
2nd week
3rd week
4th week
1
pH
7.43±0.01
7.50±0.01
7.60±0.01
7.59±0.01
7.69±0.01
2
DO(ppm)
1.03±0.01
1.08 ±0.01
1.13±0.01
1.16±0.10
1.20±0.05
3
TDS(mg/l)
255.33±0.57
216±0.00
180.33±0.57
151.66±1.52
108±11.27
4
Nitrate(mg/l)
373.61±16.17
158.75±16.22
97.15±4.64
34.13±0.79
1.61±1.78
5
Phosphorus(mg/l)
14.18±0.03
6.67±2.51
4.25±0.13
2.22±0.31
0.00±0.00
6
NH4(mg/l)
214.82±42.80
147.83±9.26
117.28±6.79
18.86±7.03
0.04±0.06
7
Potassium(mg/l)
25.65±0.25
14.28±0.08
10.54±0.42
6.25±0.29
2.14±0.91
Table 3: Bioremediation of Municipal Wastewater (Heavy Metals) Using Single Specie (Chlorogoniunsp) At Temperature of 250C, 12:12h Light/Dark Photoperiod
S/N
Parameters
Before Treatment
After Treatment
1st week
2nd week
3rd week
4th week
1
Zinc (mg/l)
0.054±0.00
0.039±0.01
0.32±0.01
0.017±0.00
0.007±0.01
2
Manganese (mg/l)
0.694±0.01
0.373±0.02
0.256±0.03
0.146±0.07
0.065±0.05
3
Iron (mg/l)
11.14±0.16
9.11±0.15
6.76±0.17
4.96±0.17
2.29±0.11
4
copper (mg/l)
0.160±0.02
0.125±0.01
0.122±0.00
0.109±0.01
0.079±0.02
5
Nickel(mg/l)
0.372±0.05
0.307±0.06
0.297±0.00
0.263±0.00
0.26±0.01
Table 4: Bioremediation of Municipal Wastewater Using Single Specie (Chlorella Sorokiniana) At Temperature of 250C, 12:12h Light/Dark Photoperiod
S/N
Parameters
Before Treatment
After Treatment
1st week
2nd week
3rd week
4th week
1
pH
7.43±0.01
7.52±0.02
7.60±0.01
7.71±0.01
7.88±0.10
2
DO(ppm)
1.03±0.01
1.1 ±0.01
1.14±0.00
1.28±0.01
1.54±0.10
3
TDS(mg/l)
255.33±0.57
218.67±1.52
168±29.51
100±3.00
59.33±2.08
4
Nitrate(mg/l)
373.61±16.17
140.1±28.02
60.32±0.74
3.81±0.53
0.00±0.00
5
Phosphorus(mg/l)
14.18±0.03
9.64±2.01
5.73±2.78
1.43±0.64
0.37±0.55
6
NH4(mg/l)
214.82±42.80
130.71±42.77
117.74±5.73
53.05±6.18
1.16±0.99
7
Potassium(mg/l)
25.65±0.25a
2.43±0.02b
1.54±0.58c
0.00±0.00d
0.00±0.00e
Table 5: Bioremediation of Municipal Wastewater (Heavy Metals) Using Single Species (Chlorella Sorokiniana) At Temperature of 250C, 12:12h Light/Dark Photoperiod
S/N
Parameters
Before Treatment
After Treatment
1st week
2nd week
3rd week
4th week
1
Zinc (mg/l)
0.054±0.00
0.019±0.00
0.016±0.01
0.011±0.01
0.002±0.01
2
Manganese (mg/l)
0.694±0.01
0.243±0.02
0.204±0.01
0.176±0.02
0.147±0.01
3
Iron (mg/l)
11.14±0.16
4.71±0.01
2.16±0.18
2.97±0.05
1.11±0.07
4
copper (mg/l)
0.160±0.02
0.121±0.01
0.108±0.01
0.076±0.03
0.00±0.00
5
Nickel(mg/l)
0.372±0.05
0.221±0.01
0.215±0.01
0.133±0.06
0.39±0.05
6
Lead (mg/l)
0.702±0.05
0.561±0.01
0.211±0.05
0.112±0.01
0.018±0.01
Table 6: Bioremediation of Municipal Wastewater Using Single Species (Microcystisaeruginosa) At Temperature of 250C, 12:12h Light/Dark Photoperiod
S/N
Parameters
Before Treatment
After Treatment
1st week
2nd week
3rd week
4th week
1
pH
7.43±0.01
6.99±0.02
7.47±0.01
7.91±0.01
7.97±0.02
2
DO(ppm)
1.03±0.01
1.08 ±0.01
1.11±0.03
1.15±0.01
1.16±0.01
3
TDS(mg/l)
255.33±0.57
213±3.00
203.67±3.06
190.33±9.87
166.33±0.58
4
Nitrate(mg/l)
373.61±16.17
196.29±0.23
175.43±10.94
142.10±12.25
90.66±8.12
5
Phosphorus(mg/l)
14.18±0.03
10.68±1.21
8.73±0.72
5.43±0.01
1.03±0.05
6
NH4(mg/l)
214.82±42.80
112.06±48.51
115.35±6.87
79.10±0.92
14.97±3.96
7
Potassium(mg/l)
25.65±0.25
12.22±0.03
6.73±0.45
2.11±0.02
0.12±0.12
Table 7: Bioremediation of Municipal Wastewater (Heavy Metals) Using Single Specie (Microcystisaeruginosa) At Temperature of 250C, 12:12h Light/Dark Photoperiod
S/N
Parameters
Before Treatment
After Treatment
1st week
2nd week
3rd week
4th week
1
Zinc (mg/l)
0.054±0.00
0.043±0.01
0.038±0.01
0.025±0.00
0.013±0.00
2
Manganese (mg/l)
0.694±0.01
0.310±0.02
0.157±0.01
0.107±0.01
0.098±0.00
3
Iron (mg/l)
11.14±0.16
7.77±0.01
5.15±0.01
3.96±0.02
0.12±0.00
4
copper (mg/l)
0.160±0.02
0.076±0.06
0.085±0.01
0.059±0.00
0.005±0.00
5
Nickel(mg/l)
0.372±0.05
0.243±0.01
0.202±0.00
0.185±0.01
0.079±0.04
6
Lead (mg/l)
0.702±0.01
0.456±0.01
0.387±0.00
0.211±0.01
0.115±0.00
Figure 1: Percentage Reduction in pH Over Time in Different Species (CH, CHR, MC)
Figure 2: Time-Dependent Changes in Dissolved Oxygen (%) Among CH, CHR, and MC
Figure 3: Percentage Reduction in Total Dissolved Solids (TDS) Over Time in Different Species
Figure 4: Percentage Reduction in Nitrate-Nitrogen over Time for Three Species (CH, CHR, MC)
Figure 5: Percentage Reduction in Ammonium over Time for Three Species (CH, CHR, MC)
Figure 6: Temporal Reduction of PHS by Different Species
Figure 7: Time-Dependent Reduction of Potassium in Different Species
Figure 8: Effect of Time on Zinc Reduction in Different Species
Figure 9: Effect of Time on Manganese Reduction in Different Species
Figure 10: Iron Reduction (%) Over Time in Different Species (CH, CHR, MC)
Figure 11: Time-Dependent Reduction in Copper Content across Species
Figure 12: Time-Dependent Reduction in Nickel Content across Species
PH
The pH value of bioremediation of wastewater using both of the species maintains around neutral values. These indicated that there are changes in pH values, which remained around neutral for both species. These are in-line with the result reported by Aarti et al. [11]. Makareviciene et al. [12] Mostafa et al. [13]. who have found that Chlorella spsustained the maximum growth rate at the range of pH between 6.0 and 9.0 Also the same observation made by Zhao [14]. Who have revealed that pH increases during the growth of microalgae due to a shift in the chemical equilibrium system among carbon dioxide, carbonic, carbonate and hydroxide.
TDS (Total Dissolved Solid)
The removal of TDS reduced significantly across both of the weeks in both of the species. There is no significant difference in removal of TDS between Chlorella sorokinianaandChlorogoniumsp, while there is significant difference with Microcystisaeruginosa. These are in line with observations made by Mostafa et al. [13] who reported that the TDS of water samples were significantly decreased with algal treatment these reductions in TDS might be as the result of utilization of various nutrients by algae [15-16].
DO (Dissolved Oxygen)
The value of DO increase for both of the species and it is more significant inChlorella sorokiniana and Chlorogoniumsp, than Microcystisaeruginosa. The increase in DO is due to photosynthesis. This finding is agreed with finding of Oswald et al. [17] who reported that using light as an energy source, microalgae uptake CO2 from the environment as an vital carbon source to synthesize sugar for their biomass growth and produce O2 as a byproduct.
Nitrate
The nitrate reduced significantly for both of the species. The finding of this research corresponds with the findings of Aslan and Kapdan, [18] that used C. vulgaris for nitrogen and phosphorus removal from wastewater. Shi et al. [19] also conducted experiments with Chlorella to remove nitrate from municipal wastewater and reduce levels of phosphate, ammonium and nitrate in synthetic secondary wastewater. Kshirsagar [20] observed that removal efficiencies of nitrate of wastewater were 78.08% respectively using C. vulgaris up to 15 days.
Phosphorus
The removal of phosphorus for both species shows significant. Kshirsagar, [20] observed that, removal efficiencies of Phosphate of waste water were 62.73% respectively using C. vulgaris up to 15 days after inoculation. All this observations are in line with the finding of this research. Phosphate removal by algae during bioremediation is due to the utilization of phosphorus for growth. This is similar observation made by Kshirsagar [21]. Phosphorus is the second vital nutrient for microalgae.
Ammonium (NH4)
This result indicated the removal of Ammonium (NH4-) for both of the species considered extremely significant. These is in line with the observations made by González et al. who reported ammonium removal efficiencies of 90% from agro-industrial wastewater after216 hr. This results about ammonium removal efficiency was in line with research conducted by Martínez et al. [22], who labeled elimination of NH4+ (between 79% and 100%) after 188.25 h of culture.
Potassium
The obtained results revealed the remarkable decrease in Potassium concentration for both of the species. The finding of this research is in line with observation made by who stated that the application of algae for wastewater treatment showed variable percentages of decrease in minerals
Heavy Metals
The concentration of heavy metals for the both of the species reduced significantly with increase in the number of days, but it shows moresignificantin (Chlorella,sorokiniana and Chlorogoniumsp than Microcystisaeruginosa). Al- Qunaibit, [23] reported that, dried dead C.vulgariswas studied in terms of its performance in binding divalent Cu, Cd and Pb ions from their aqueous solutions. The finding of this research is in line with finding of Chan et al. [24], who also reported that microalgae removed up to 81.7% Cu reaching lowest final concentration of 7.8 ppb after 10 days. Zn reduced up to 94.1% reaching 0.6 ppb after 10 days.
CONCLUSION
The present result showed that both the algal species had very good potentials to remediate the toxic level of all physico-chemical parameters. This research confirmed that microalgae showed high reduction capacity on TDS, phosphate, ammonium, nitrate, potassium and heavy metals.
REFERENCE
Olguin, E.J. “Phycoremediation: Key issues for cost-effective nutrient removal processes.” Biotechnology Advances, vol. 22, 2003, pp. 81–91.
De la Noue, J. and N. De Pauw. “The potential of microalgal biotechnology: A review of production and uses of microalgae.” Biotechnology Advances, vol. 6, 1988, pp. 725–770.
Alsull, M. and W. Omar. “Responses of Tetraselmis sp. and Nannochloropsis sp. isolated from Penang National Park coastal waters, Malaysia, to the combined influences of salinity, light and nitrogen limitation.” International Conference on Chemical, Ecology and Environmental Sciences (ICEES 2012), March 2012, pp. 142–145.
Validi, M. “Bioremediation: An overview.” Pure and Applied Chemistry, vol. 73, no. 7, 2001, pp. 1163–1172.
Han, S.Q. et al. “Present situation and developmental trend of wastewater treatment and eutrophication waters purification with alga technology.” Agro Environmental Development, vol. 63, no. 1, 2000, pp. 13–16.
Zhao, B. et al. “Effect of cultivation mode on microalgal growth and CO₂ fixation.” Chemical Engineering Research and Design, 2012.
Godos, I.D. et al. “Long-term operation of high rate algal ponds for the bioremediation of piggery wastewaters at high loading rates.” Bioresource Technology, vol. 100, 2009, pp. 4332–4339.
Arrendondo-Figueroa, J. et al. “Liquid manure as a culture medium for three species of Chlorella (Chlorophyta).” Cryptogamie-Algologie, vol. 19, no. 3, 1998, pp. 229–235.
Chan, H. “Recycling of nutrients from trash fish wastewater for microalgae production as health and pharmaceutical products and renewable energy.” WebmedCentral Microbiology, vol. 2, no. 7, 2011, WMC002027.
Changfu, W. et al. “Nitrogen and phosphorus removal from municipal wastewater by the green alga Chlorella sp.” Journal of Environmental Biology, vol. 34, 2013, pp. 421–425.
Aarti, N. et al. “Phycoremediation to improve algal water quality.” Industrial Hydrobiology, vol. 11, 2008, pp. 173–184.
Makarevi, V. et al. “Cultivation of microalgae Chlorella sp. and Scenedesmus sp. as a potential biofuel feedstock.” Environmental Research, Engineering and Management, vol. 3, no. 57, 2011, pp. 21–27.
Mostafa, M. et al. “Bioremediation of different types of polluted water using microalgae.” Accademia Nazionale dei Lincei, 2015.
Zhao, Y. et al. “Ability of different microalgae species in synthetic high-strength wastewater treatment and potential lipid production.” Journal of Chemical Technology and Biotechnology, 2016.
Rao, H.P. et al. “Application of phycoremediation technology in the treatment of wastewater from a leather-processing chemical manufacturing facility.” Water SA, vol. 37, 2011, pp. 7–14.
Ahmad, F. et al. “Comparative phycoremediation of sewage water by various species of algae.” Proceedings of the Pakistan Academy of Sciences, vol. 50, 2013, pp. 131–139.
Oswald, W.J. “My sixty years in applied algology.” Journal of Applied Phycology, 2003, pp. 99–106.
Aslan, S. and I.K. Kapdan. “Batch kinetics of nitrogen and phosphorus removal from synthetic wastewater by algae.” Ecological Engineering, vol. 28, no. 1, 2006, pp. 64–70.
Shi, J. et al. “Removal of nitrogen and phosphorus from wastewater using microalgae immobilized on twin layers: An experimental study.” Journal of Applied Phycology, vol. 19, 2007, pp. 417–423.
Kshirsagar, A.D. “Bioremediation of wastewater by using microalgae: An experimental study.” International Journal of Life Sciences, vol. 2, 2013, pp. 140–146
Recommended Articles
Research Article
Electrochemical Comparative Studies On The Redox Behavior Of Cu(II) And Cr(II) Before And After Interactions With Ciprofloxacin In Solutions
H. M. Naseem Akhtar,
M. Q. Ehsan
Published: 10/08/2021
Download PDF
Research Article
A Rare Case Report of Waugh Syndrome in an Eight Months Old Male
Pielly Hanna,
...
Bassem Abou Merhi
Published: 10/03/2021
Download PDF
Research Article
Study on Prevalence and Etiology of Early Neonatal Deaths in Jasin district, Melaka from 2014-2017
Sujat a Khobragade,
...
Yadneshwar Khobragade
Published: 30/05/2021
Download PDF
Research Article
Clinicopathological Correlation in Cases of Acute Appendicitis: An Overview
Rahul Rai,
...
Tushar
Published: 05/04/2025
Download PDF
PO Box 101, Nakuru
Kenya.
Email: office@iarconsortium.org
Editorial Office:
J.L Bhavan, Near Radison Blu Hotel,
Jalukbari, Guwahati-India
Adamasi, M. B., Safana, A., Bdulkarim, B. A., Abdullahi, B. A. & Kabir, S. (2023). Bioremediation of Municipal Wastewater using Consortium of Chlorogium sp, Chlorella sorokiniana and Microcystis aeriginosa at River Ginzo Katsina State, Nigeria. International Academic Journal of Applied Bio-Medical Sciences, 4(1), 1-7.
MLA
Adamasi, M. B., et al. "Bioremediation of Municipal Wastewater using Consortium of Chlorogium sp, Chlorella sorokiniana and Microcystis aeriginosa at River Ginzo Katsina State, Nigeria." International Academic Journal of Applied Bio-Medical Sciences 4.1 (2023): 1-7.
Chicago
Adamasi, M. B., A. Safana, B. A. Bdulkarim, B. A. Abdullahi and S. Kabir. "Bioremediation of Municipal Wastewater using Consortium of Chlorogium sp, Chlorella sorokiniana and Microcystis aeriginosa at River Ginzo Katsina State, Nigeria." International Academic Journal of Applied Bio-Medical Sciences 4, no. 1 (2023): 1-7.
Harvard
Adamasi, M. B., Safana, A., Bdulkarim, B. A., Abdullahi, B. A. and Kabir, S. (2023) 'Bioremediation of Municipal Wastewater using Consortium of Chlorogium sp, Chlorella sorokiniana and Microcystis aeriginosa at River Ginzo Katsina State, Nigeria' International Academic Journal of Applied Bio-Medical Sciences 4(1), pp. 1-7.
Vancouver
Adamasi MB, Safana A, Bdulkarim BA, Abdullahi BA, Kabir S. Bioremediation of Municipal Wastewater using Consortium of Chlorogium sp, Chlorella sorokiniana and Microcystis aeriginosa at River Ginzo Katsina State, Nigeria. International Academic Journal of Applied Bio-Medical Sciences. 2023 Jan;4(1):1-7.


 Download PDF
 Download XML