The relative success or failure of the investment policies introduced by various government have being a subject of controversy and the importance accorded tax incentive as a policy strategy influencing FDI called for studying the relationship between them going by the conflicting research findings of negative and positive uni-directional relationships between the concepts from some writers. Therefore, this study examined the nexus between tax revenue and Foreign Direct Investment (FDI) in Nigeria between1976-2012. The data for the study were gathered from Central Bank of Nigeria (CBN) Statistical Bulletin (Various Issues) & National Bureau of Statistics, International Monetary Fund (IMF), Balance of Payments database. The underpinning theory for this study was neo-classical traditional theory of the users cost of capital approach. The ARDL methodology approach to cointegration analysis and vector Error Correction model were adopted to examine the equilibrium relationship and direction of causality respectively. The Pesaran et al. [1] test of cointegration analysis used in the study established a cointegration running from company income tax and foreign direct investment as F-statistic of the unrestricted value of 7.055295 exceeds the upper bound at both 1% and 5% significant levels. The result of long-run ARDL also confirmed that there is evidence of a co-integration relationship running between CIT and FDI. The magnitude of R2 reflects that the variation in company income tax can be explained by both short-run and long-run impact of foreign direct investment. The findings from study as well showed that there is long run uni-directional causality running between FDI and CIT. In line with the findings of this study, it was recommended that Government should intensify more efforts at introducing foreign investment friendly incentive policies. These policy measures such as promotion of domestic based production, non-oil exports, rationalization and restructuring of tariff, liberalization of the external trade, reduction in value-added tax, property tax, rent, royalties, import duties, sales tax and depreciation tax are to increase the inflow of foreign direct investment as well as boosting the value of company income tax in the future. Also, floating or flexible exchange rate, interest rate and unemployment rate should be reduced so as to increase the inflow of FDI in the economy.
Keywords
Tax Revenue
Foreign Direct Investment
ARDL Cointegration Analysis and Granger Causality
INTRODUCTION
Foreign Direct Investment (FDI) occurs when a company from one country makes a physical investment to structure its business in another country by moving capital across national frontiers in a way that grants the investors control over the acquired asset [2]. For the country getting the investment, it provides source of capital flow, new technologies, processes, products, organizational techniques and management skills. FDI is different from portfolio investment which may cross borders but does not offer such control over the business. The contributions of foreign investment to countries like Japan and emerging economic ‘Tigers’ of Asia, namely, South Korea, Singapore, Taiwan and Hong Kong are of great importance which has made many developing countries around the world to be engaging in policies to attract the inflow of FDI to their economy especially during the late 1980s and the 1990s. They owe their successes to heavy inflows of FDI over the years through some liberalized trade and economic policies [3].
American government in 1954 and 1962 went for liberalization policy and this led to the liberalizing of its post war tax policy to stimulate both domestic and foreign investment into the country [4].
China began economic reforms in the late 1970s to attract FDI. Their economy initially grew slowly in the early years but witnessed rapid growth in the late 1980s. Japan, one of the fast growing technologically advanced nations of the world introduced reforms measures after the Tohoku earthquake of 2011 that ravaged the country by developing a tax incentive measures [2].
Among the African countries, Ghana opened her economy to foreign investors’ through Ghana Investment Promotion Center Act 1994 number 478 by delineated incentives and guarantees that relate to taxation, transfer of capital, profits and dividends. South Africa experienced increase in FDI inflow after the global crisis of 2008-2009 through incentive measures geared towards encouraging foreign participation in the running of the economy through a transparent regulatory framework involving tax reliefs, political stability and accessible raw materials (Bureau of Economic and Business Affairs-UNCTAD 2011). Liberia opened her economy to attractive investment facilities especially in Monrovia, the nation’s capital through the investment act of 2009 with incentives including exemption from customs duty; tax exemptions on profits re-invested in fixed assets and provision for loss carry over and accelerated depreciation of fixed assets [5].
Nigeria too, was not left out in these moves to improve her economy and shift from mono-based to diversified economy. This has made successive governments initiated either partial or wholly investment based policies. The indigenization policies was liberalized but was hampered due to the stringent economic, trade and foreign policies adopted by the government, e.g. closure of borders, changing of currency, reduction in government expenditure and wage freezing [6]. Nigerian governments have introduced various investment induced policies to improve the contribution of FDI into the economy because FDI is considered a strategic instrument for economic growth as opined by Onu and Joel [6]. The policies and regulatory measures introduced which were partly or wholly investment based adopted tax incentive policies strategies geared essentially towards the promotion of the inflow of FDI to the country. Policies such as Structural Adjustment Programmes, Investment Securities Act No 45 of 1999, Nigerian Investment Promotion Council etc. were designed to attract, register, regulate and protect investment opportunities in Nigeria as well as to enhance foreign participation in the running of the economy. Despite all these policies, foreign direct investment has not attained the desired goal in transforming Nigerian economy. On this backdrop, this study becomes imperative to examine the nexus between tax revenue and foreign direct investment in Nigeria. The broad objective of this study is to examine nexus between tax revenue and foreign direct investment in Nigeria while specific objective is to analyse the direction of causality between tax revenue and foreign direct investment in Nigeria. The rest of the paper is organised as follows: section two is on literature review. This is followed by the research methods and discussion of results in section three and four respectively. Section five concludes the paper.
LITERATURE REVIEW
Foreign Direct Investment (FDI) occurs when a company from one country makes a physical investment to structure its business in another country by moving capital across national frontiers in a way that grants the investors control over the acquired asset [2]. For the country getting the investment, it provides source of capital flow, new technologies, processes, products, organizational techniques and management skills. FDI is different from portfolio investment which may cross borders but does not offer such control over the business. The contributions of foreign investment to countries like Japan and emerging economic ‘Tigers’ of Asia, namely, South Korea, Singapore, Taiwan and Hong Kong are of great importance which has made many developing countries around the world to be engaging in policies to attract the inflow of FDI to their economy especially during the late 1980s and the 1990s. They owe their successes to heavy inflows of FDI over the years through some liberalized trade and economic policies [3].
American government in 1954 and 1962 went for liberalization policy and this led to the liberalizing of its post war tax policy to stimulate both domestic and foreign investment into the country [4].
China began economic reforms in the late 1970s to attract FDI. Their economy initially grew slowly in the early years but witnessed rapid growth in the late 1980s. Japan, one of the fast growing technologically advanced nations of the world introduced reforms measures after the Tohoku earthquake of 2011 that ravaged the country by developing a tax incentive measures [2].
Among the African countries, Ghana opened her economy to foreign investors’ through Ghana Investment Promotion Center Act 1994 number 478 by delineated incentives and guarantees that relate to taxation, transfer of capital, profits and dividends. South Africa experienced increase in FDI inflow after the global crisis of 2008-2009 through incentive measures geared towards encouraging foreign participation in the running of the economy through a transparent regulatory framework involving tax reliefs, political stability and accessible raw materials (Bureau of Economic and Business Affairs-UNCTAD 2011). Liberia opened her economy to attractive investment facilities especially in Monrovia, the nation’s capital through the investment act of 2009 with incentives including exemption from customs duty; tax exemptions on profits re-invested in fixed assets and provision for loss carry over and accelerated depreciation of fixed assets [5].
Nigeria too, was not left out in these moves to improve her economy and shift from mono-based to diversified economy. This has made successive governments initiated either partial or wholly investment based policies. The indigenization policies was liberalized but was hampered due to the stringent economic, trade and foreign policies adopted by the government, e.g. closure of borders, changing of currency, reduction in government expenditure and wage freezing [6]. Nigerian governments have introduced various investment induced policies to improve the contribution of FDI into the economy because FDI is considered a strategic instrument for economic growth as opined by Onu and Joel [6]. The policies and regulatory measures introduced which were partly or wholly investment based adopted tax incentive policies strategies geared essentially towards the promotion of the inflow of FDI to the country. Policies such as Structural Adjustment Programmes, Investment Securities Act No 45 of 1999, Nigerian Investment Promotion Council etc. were designed to attract, register, regulate and protect investment opportunities in Nigeria as well as to enhance foreign participation in the running of the economy. Despite all these policies, foreign direct investment has not attained the desired goal in transforming Nigerian economy. On this backdrop, this study becomes imperative to examine the nexus between tax revenue and foreign direct investment in Nigeria. The broad objective of this study is to examine nexus between tax revenue and foreign direct investment in Nigeria while specific objective is to analyse the direction of causality between tax revenue and foreign direct investment in Nigeria. The rest of the paper is organised as follows: section two is on literature review. This is followed by the research methods and discussion of results in section three and four respectively. Section five concludes the paper.
LITERATURE REVIEW
Conceptual Clarifications
Taxation: Taxation has been defined by different authors in a similar way, mostly emphasizing the compulsory nature and the payment made to government for the provision of social goods for the people. For instance, Ayodele [7] defines taxation as macroeconomic instrument being used by the government to levy compulsory payments on individuals and organizations to the relevant inland or internal revenue authorities at the Federal, State or local government levels. He asserts further that taxes are sums of money that government imposes in accordance with some established criteria such as net profit earned, property owned, income received, etc. in order to raise revenue to provide services which can be most efficiently provided by the State than by individuals themselves. Webster Dictionary describes ‘tax’ simply as a charge imposed by governmental authority upon property, individuals or transactions to raise money for public purposes. Soyede and Kajola [8] define tax as a compulsory extraction of money by a public authority for public purposes and Taxation is a system of raising money for the purpose of governance by the means of contributions from individual persons or corporate bodies. According to the Oxford Advance Learners Dictionary “tax is money that has to be paid to the government”. People pay tax according to their incomes and it is often paid on goods and services, while Garner [9], defines it as “Monetary charge impose by the government on person, entities or property, levied to yield public revenue”.
Ola [10] defines taxation as the demand made by the government of a country for a compulsory payment of money by the citizens of the country. Coolly [11] defines tax as “enforced proportional contribution from person property, levied by the state by virtue of its sovereignty, for the support of government and for all public needs”. Nightingale [12], describes tax as a compulsory contribution imposed by the government and concluded that even though tax payers may receive nothing identifiable in the return for their contributions, they nevertheless have the benefit of living in a relatively educated, healthy and safe society.
Foreign Investment
According to Borensztein et al. [13], foreign investment is a type of investment whether in real or financial assets across the national boundaries of the investors, it can be undertaken by individual, firms or government. Basically, they identified foreign investment in two broad categories (a) Foreign Portfolio Investment and (b) Foreign Direct investment. Foreign Portfolio Investment is an investment in which the investors lack control over the investment. This typically takes the form of investing in financial assets such as bonds and stocks; and in which case the investors do not have a controlling interest. Obadan posits that Portfolio investment is made primarily for the purpose of dividends, capital gains or earning interests. He states further that portfolio investment has been a notable feature of the advanced market economies of Europe and North America. It is also becoming significant in the emerging economies of China, Hong Kong, India, Singapore, South Korea, Taiwan, Brazil, South Africa and Russia among others.
Foreign Portfolio investment is however a recent phenomenon in Nigeria. Up to the mid-1980s, Nigeria does not record any figure on portfolio investment (inflow and outflow) in her balance of payments accounts. The nil return on the inflow column of the account is attributable to the absence of foreign portfolio investors in Nigeria’s economy. This is largely because of the non-internationalization of the country’s money and capital markets as well as the non-disclosure of information on the portfolio investments of Nigerian investors in foreign capital/money markets. However, the record changes from 2003 when the federal government through the debt management office issued the first Federal Government of Nigeria (FGN) Bond series. In addition, between 2003 and 2011, the contribution of foreign portfolio investment to long term funds in the bond market was 10% of the total bond market capitalization.
Foreign Direct Investment is an investment in a foreign country where the investors retain control over the investment. This typically, takes the form of a foreigner on a foreign manufacturing firm sets up a subsidiary of their home manufacturing firm and takes over the control of the existing firm in the country of its establishment [14]. Blomstrom et al. [15] assert that Foreign Direct Investment involves internationalization of product in order to service markets, which were served by export. They are of the view that Foreign Direct Investment is distinguished from other form of foreign investment by the fact that it involves not only foreign investment ownership but also foreign management and control. According to International Monetary Fund [16], Foreign Direct Investment is defined as investment that is made to acquire a lasting interest in an enterprise operating in an economy other than that of the investor, the investor purpose being to have an effective voice in the management of the enterprise. The foreign or entity or group of associated entities that makes up the investment is termed the direct investors. The unincorporated or incorporated enterprise, a branch or subsidiary respectively in which foreign direct investment is made referred to as a direct investment enterprise.
Mosima [17] defines FDI as ‘’investment made to acquire lasting interest in enterprises operating outside of the economy of the investor’’. Thus, it is not only a transfer of ownership from domestic to foreign residents but also a mechanism that makes it possible for foreign investors to exercise management and control over host country’s firms.
Empirical Literature
Atoyebi [18] analyzes the effects of tax incentives on real investment behaviour in Nigeria’s manufacturing industries over a twenty years period of1962 and 1982. He focused on the vintage neo-classical model based on the generalized form of Cobb-Douglas production function and he concluded that a reduction in the prevailing company income tax rate will have some significant effect on the level of investment in the country. But this can only happens at the early stage of establishing the company as this policy is not sufficient enough to have any significant influence on real investment in the country. Wei, while contributing his own view, on this topic generalized his work by stating that the relationship between foreign direct investment and the tax rate is always negative. His opinion seems to be that tax rate affects the volume of foreign direct investment only when market and political factors are seldom equal. Still, the tax rate effect seems to vary according to the firm and the local characteristics of the country. Slemrod conducts his own study with regard to the relationship between tax and FDI as well. He starts his work by pointing to the drawbacks of the previous studies on the same matter. He sets forward that previous studies have used the average tax rate and attempted to use only the host country tax which would yield more objective results. Beside all mentioned above, the author regards all previous empirical results close to the one provided by Hartman’s work.
Sun [19], in his own paper, “on the economy of China” opines that export oriented companies and companies financed by retained earnings are more sensitive to tax advantages. Feldstein states that start-up companies highly appreciate incentives that help them avoid or postpone initial expenses and small countries tend to have a small corporate tax rate in order to attract big companies. Nevertheless, policy makers still feel that significant differences among neighbours or other countries with which they believe to be competing with an attracting foreign direct investment are to be avoided whenever possible. Desai et al. [20] conduct a study on the impact of tax revenue on FDI in the USA. and came up with the conclusion that reduction in tax rate brings a considerable increase in FDI. Benassy-Quere et al. [21] empirically analyze foreign direct investment among 11 OECD countries (1984 through 2000) and find that “a reduction of one percentage point in the (statutory) corporate tax rate of a host country leads to 4% decision on foreign investment”. As discussed above globally, it is a share view that “corporate tax influence foreign direct investment”. The estimation methodology adopted in this process is the system of Generalized Least Square Method (GLSM) estimator that has never been used in the existing related researches. The estimation results show that, just as hypothesized, the level of foreign direct investment in the previous year has statistically significant positive effect on the size of foreign direct investment in the current year. As indicated in static analyses, the dynamic panel analysis confirms that the corporate tax has statistically negative effects on foreign direct investment. In his own contribution to this study, Taro [22], analyzes his research by bringing more recent evidence and thought to the issue of tax competition in regard to investments. Like Hartman, the author begins his study by providing the foundation of tax incentives for investment location. He discussed the fact that the location of capital is not primarily motivated by the level of corporate income tax, but, as well, access to markets, political considerations, labour costs and expected economic conditions. Nevertheless, with his OLS method of analysis, he found out that tax is considered to have some effect upon the location of investments. Babatunde [23], while contributing her own view to this topic investigates the determining factors of FDI and analyzed whether or not some selected factors such as tax incentives, availability of natural resources, macroeconomic stability, market size, openness to trade, infrastructural development and political risk have an impact on FDI in the oil and gas sector. Even though she has an elaborate variables, she however employs Karl Pearson rank correlation coefficient estimation techniques and came up with the conclusion that there is a significant impact of tax incentives, availability of natural resources and openness to trade on FDI in the oil and gas sector in Nigeria.
RESEARCH METHODS OF ANALYSIS
The empirical investigation in this section focused on model specification, A priori expectation, estimation techniques and sources of data.
Model Specification
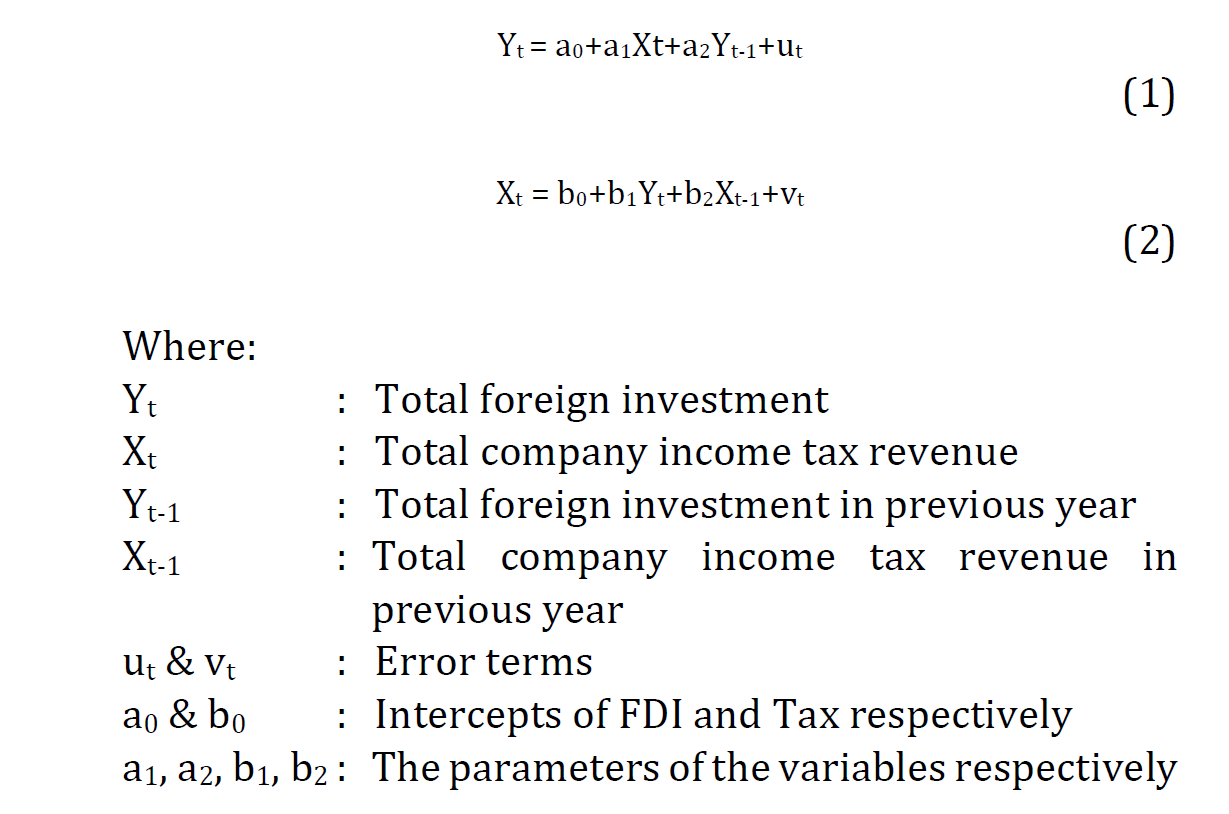
The total annual revenue on company income tax is used as proxy for tax revenue, while annual record of income on FDI is used for data on foreign direct investment. Data on annual Unemployment rate, interest rate, growth rate of gross domestic product and exchange rate are examined. Therefore, to examine the relationship between tax revenue and foreign direct investment, the model adopted by Toda and Yamamoto and Dave Giles specified in Equation 1 and 2 are adopted:
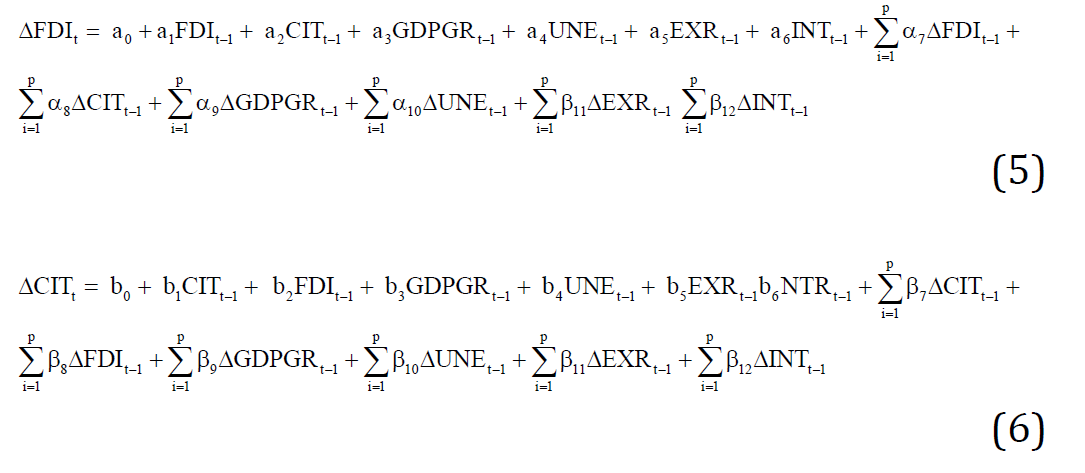
The model above is adopted but modified as shown below to incorporate those variables to be tested in the work:
Where, αit and βit in Equation 3 and 4 are the variables to be included at time t respectively and ai,bi are the parameters of the included variables in the equations, respectively. The inclusion of those variables is to key into the objectives of the study. This owns to the fact that it has been stated in the study that FDI and TAX has functional relationship with gross domestic product growth rate, Unemployment rate, exchange rate and interest rate. Therefore, the models are specified as:
Where:
FDIt : Total foreign direct investment
CITt : Total company income tax revenue
FDIt-1 : The total foreign direct investment in previous year
CITt-1 : Total company income tax revenue in previous year
GDPGRt : The gross domestic product growth rate
GDPGRt-1 : The lag of gross domestic product growth rate
UNEt : Stands for Unemployment rate
UNEt-1 : Stands for lag of Unemployment rate
EXRt : The exchange rate
EXRt-1 : The lag of exchange rate
INTt : Interest rate
INTt-1 : The lag of interest rate
ut & vt : Error terms
a0 & b0 : Intercepts of FDI and Tax equation respectively
a1-a12, b1-b12 : The parameters of the variables respectively
Estimating Techniques
The research work makes use of the method of Autoregressive Distributed Lag (ARDL) approach to Cointegration and Vector Error Correction Model. This is used for this study owing to the superior need of establishing the long-run and short-run relationship between tax and foreign direct investment in Nigeria as well as Vector Error Correction Model to determine the direction of causality in the variables.
Table 1: Augmented Dickey Fuller Unit Root Test
At Levels
1st Difference
Level of Integration
Variable
ADF-Test
1% C. V.
5% C. V.
ADF-Test
1% C. V.
5% C. V.
FDI
-3.646883
-3.626784
-2.945842
NA
NA
NA
I(0)
CIT
-5.268674
-3.626784
-2.945842
NA
NA
NA
I(0)
GDPGR
-6.098852
-3.626784
-2945842
NA
NA
NA
I(0)
INTR
-6.269232
-3.626784
-2.945842
NA
NA
NA
I(0)
EXR
0.250106
-3.626784
-2.945842
-5.561806
-3.632900
-2.948404
I(1)
UNEM
-1.530651
-3.653730
-2.957110
-8.890213
-3.632900
-2.948404
I(1)
Source: Author’s Computation, 2015
Table 2: Lag Length Selection Criteria
Lag
LogL
LR
FPE
AIC
SC
HQ
0
7.465381
NA*
0.053915*
-0.086199*
0.183159*
0.005660*
1
7.581194
0.183939
0.056921
-0.034188
0.280063
0.072981
2
7.869669
0.441197
0.059533
0.007667
0.36681
0.130145
3
8.84762
1.438164
0.059845
0.008964
0.413
0.146752
Source: Author’s Computation, 2016, *Indicates lag order selected by the criterion, FPE: Final prediction error, LR: Sequential modified LR test statistics (each test at 5% level), AIC: Akaike information criterion, SC: Schwarz information criterion, HQ: Hannan-Quinn information criterion
Table 3: Unrestricted Auto-Regressive Distributed Lag Model for Company Income Tax in Nigeria
Dependent Variable: D(CIT)
Variable
Coefficient
Std. Error
t-Statistic
Prob.
D(CIT(-1))
-0.1221
0.131467
-0.928756
0.3631
D(FDI(-1))
0.010309
0.020595
0.500541
0.6217
D(GDPGR(-1))
-4271
0.037178
-1.148654
0.263
D(INT(-1))
-0.0494
0.002223
-2.221554
0.0369
D(EXR(-1))
-0.0359
0.002653
-1.354057
0.1895
D(UNE(-1))
0.010799
0.016187
0.667149
0.5116
FDI(-1)
0.030065
0.024349
2.136883
0.044
GDPGR(-1)
0.118538
0.053887
1.468179
0.1562
INT(-1)
0.007239
0.003361
1.919158
0.068
EXR(-1)
-0.0025
0.000868
-1.933727
0.0661
UNE(-1)
0.042622
0.013081
1.462302
0.1578
CIT(-1)
-0.86014
0.184025
-4.674069
0.0001
C
-0.07526
0.140577
-0.535395
0.5977
R-squared
0.778499
Akaike info criterion
-0.251051
Adjusted R-squared
0.738945
Schwarz criterion
0.326649
S.E. of regression
0.185678
Hannan-Quinn criterion
-0.051629
Sum squared residual
0.758481
Log likelihood
17.3934
Durbin-Watson stat
2.007452
Source: Author’s Computation, 2016
Sources of Data
The data for this research is sourced from the Central Bank Annual Financial Reports and Statistical Bulletin, publications of the National Bureau of Statistics, World Bank Economic indicator, United Nations Conference on Trade and Development and the data composed of time series data covering a thirty seven years (37) period between 1976 and 2012.
RESULTS AND DISCUSSION
Stationary and Non-Stationary Tests
From Table 1, the ADF test shows that Company Income Tax (CIT), Foreign Direct Investment (FDI), growth rate of gross domestic product (GDPGR) and interest rate (INTR) variables are stationary at levels I(0), while exchange rate (EXR) and unemployment UNEM are stationary at first difference, I(1) at 5% level of significance. Since the two series are integrated of different orders, the condition for Johansen cointegration test is not met and therefore we employ the ARDL-bound testing method of cointegration analysis rather than the Johansen method.
Results of ARDL Cointegration Analysis
To begin with the estimation of the ARDL model, the lag length must be determined. To implement the information criteria for selecting the lag length in a time effect way, the lag structure was estimated. The appropriate lag length is determined by using one or more of AIC, SC and HQ. The result is presented in Table 2.
The result generated in Table 2 shows that all the lag length selection criteria suggest a maximum of one lag for the ARDL model in this study. A key assumption of the ARDL-Bound testing methodology of Pesaran et al. [1] is that the errors of the equation must be serially independent.
In order to ascertain the nexus between company income tax and foreign direct investment, we first make company income tax a dependent variable and the result is shown Table 3.
Table 4: Wald Bounds Test for Cointegration in ARDL
Source: Author’s Computation, 2016, Restrictions are linear in coefficient
Table 5: Critical Lower and Upper Bounds
5%
1%
LOWER
UPPER
LOWER
UPPER
2.45
3.61
3.15
4.43
Source: Pesaran et al. [1]
Table 6: Unrestricted ARDL Model for Foreign Direct Investment in Nigeria
Dependent Variable: D(FDI)
Variable
Coefficient
Std. Error
t-Statistic
Prob.
D(FDI(-1))
-0.159073
0.245941
-0.646795
0.5245
D(CIT(-1))
0.609187
0.78352
0.777499
0.4451
D(GDPGR(-1))
0.039611
0.138763
0.28546
0.778
D(EXR(-1))
-0.006642
0.016099
-0.41255
0.6839
D(UNE(-1))
-0.052992
0.08089
-0.655112
0.5192
D(INT(-1))
0.027041
0.025673
1.053264
0.3037
CIT(-1)
-0.687123
2.033691
0.33787
0.7387
GDPGR(-1)
0.077984
0.17376
-0.448803
0.658
EXR(-1)
0.003854
0.004767
0.808305
0.4276
UNE(-1)
0.064891
0.094302
0.68812
0.4986
INT(-1)
-0.036607
0.028169
-1.299583
0.2072
FDI(-1)
-0.587112
0.262504
-2.236582
0.0358
C
0.636149
0.902546
0.704838
0.4883
R-squared
0.441347
Mean dependent var
0.056000
Adjusted R-squared
0.136628
S.D. dependent var
1.982414
S.E. of regression
1.842016
Akaike info criterion
4.33815
Sum squared residual
74.64652
Schwarz criterion
4.915851
Log likelihood
-62.91763
Hannan-Quinn criterion
4.537572
F-statistic
1.448372
Durbin-Watson statistic
1.986482
Prob (F- statistic
0.217622
Source: Author’s Computation, (2019)
The ARDL in Table 4 portrays both the short-run and long-run analyses. The major hypothesis of the study is:
H0: There is no significant equilibrium relationship between company income tax and foreign direct investment in Nigeria
H1: There is significant equilibrium relationship between company income tax and foreign direct investment in Nigeria
The ARDL result is well fit as shown by the magnitude of the R2 which is 0.78, that is about 78% of the variation in company income tax which can be explained by both the short-run and long-run impact of foreign direct investment. To test for co-integration therefore, the Bound test is conducted on the unrestricted ARDL result in Table 3 by conducting the F-statistics of the hypothesis, H0: θ7 = θ8 = θ9 = θ10 = θ11 = θ12 = 0 against the alternative. As a check, we perform a “Bounds” t-test of H0 = 0, if the t-statistic for CITt-1 in our equation is greater than the lower and upper bounds of the Pesaran et al supplied bounds table at both 1 and 5% significant levels.
If the computed F-statistic falls below the lower bound we would conclude that the variables are I(0), so no cointegration is possible, by definition. If the F-statistics exceeds the upper bounds, we conclude that we have cointegration. Finally if the F-statistics falls between the bounds, the test is inconclusive, we therefore rely on the result of the short-run analysis.
From the Table 4, the value of our F-statistic is 7.055295 and very significant at 5 percent level and we have (k+5) = 6 variables in our model. The critical lower and upper bounds of the Pesaran et al. [1] for the unrestricted intercept with no trend is presented in Table 5.
Table 7: Long run multiplier
CIT(-1)
FDI(1)
FDI(-1)
0.034953612
CIT(-1)
0.000001
GDPGR(-1)
0.137812449
GDPGR(-1)
-0.132826
EXR(-1)
-0.002906504
EXR(-1)
0.006564
UNE(-1)
0.049552398
UNE(-1)
-0.110526
INT(-1)
0.008416072
INT(-1)
-0.062351
Source: Author’s Computation, 2016
From Table 4, the value of F-statistic is 7.055295. It exceeds the upper bound at both 1 and 5% significant level, we can therefore reject the null hypothesis and accept the alternative one thereby concluding that there is evidence of a cointegration relationship between CIT (company income tax) and FDI (foreign direct investment).
Also, we decided to make foreign direct investment endogenous to all other variables and the result is presented in Table 6.
Still on the major hypothesis that:
H0: There is no significant equilibrium relationship between company income tax and foreign direct investment in Nigeria
H1: There is significant equilibrium relationship between company income tax and foreign direct investment in Nigeria
The ARDL result in Table 6 is weakly fit as shown by the magnitude of the R2 which is 0.44, that is about 44% of the variation in foreign direct investment can be explained by both the short-run and long-run impact of company income tax. Also, we can therefore accept the alternative hypothesis stating that there is significant equilibrium relationship between company income tax and foreign direct investment.
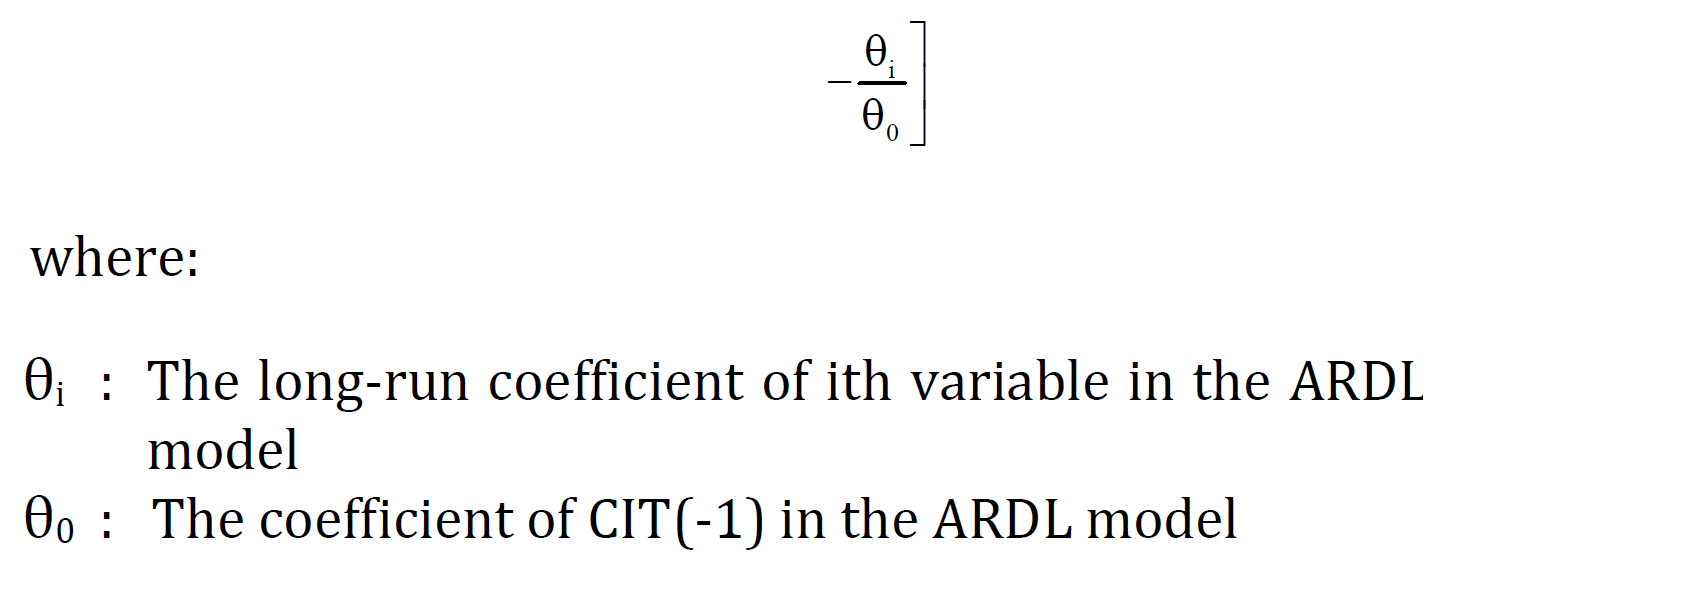
We can from the above extract the long-run multiplier equation from the ARDL result. The long-run coefficient for the respective variables is derived from the following equation.
The long-run coefficient for the respective variables is derived from the following equation:
The long run result shows a positive long-run multiplier effect of FDI on CIT (Table 7). A unit increase of foreign direct investment will increase company income tax by approximately 3.5 percent in the long-run while CIT has infinitesimal effect on FDI in the long run from the result of the test above.
As discovered in the study from the theoretical literature, other factors determining or influencing FDI and tax were noticeable and to buttress the research findings from the ARDL tables, the coefficient of exchange rate (EXR) has negative value which indicates an inverse relationship between company income tax and exchange rate (EXR). However, growth rate of GDP, foreign direct investment (FDI), interest rate (INT) and unemployment rate (UNE) have positive values and it is inferred that a unit increase in any of these variables will respectively lead to increase in the level of company income tax. Even though, the effects are very low with the values of the coefficients as can be seen in the Table 3. The coefficient of the constant term is -0.07526 and it is statistically insignificant at 5% level.
CONCLUSION AND POLICY RECOMMENDATIONS
Having searched into the dynamic relationship between tax revenue and foreign direct investment in Nigeria, the empirical tests show that there exists cointegration between CIT and FDI from the Wald test cointegration result. It shows from the test that GDPGR, INT, UNE and FDI have positive relationship with CIT while EXR has inverse relationship with CIT. This means that a unit increase in gross domestic product, interest rate, foreign direct investment and unemployment will lead to 13.7, 0.8, 4.9 and 3.4% increase in the company income tax respectively, while a unit reduction in the exchange rate will lead to 0.02% increase in company income tax. Also, GDPGR, UNE and INT have negative relationship with FDI while EXR have positive relationship with FDI. This means, a unit decrease in gross domestic product, interest rate and unemployment will lead to 13.2, 11.0% and 6.2% increase in the foreign direct investment respectively, while a unit increase in the exchange rate will lead to 0.06% increase in foreign direct investment. Therefore, it is concluded based on Wald bound test that there is co-integration between CIT and FDI.
Moreover, the result of the study as presented in appendix 1 reveals that there is a uni-directional long-run causality running from FDI to CIT. Therefore, it is concluded that foreign direct investment has the tendency of increasing the contribution of company income tax in the long- run. Based on the findings of this study, the following recommendations are put forward. Government should intensify more efforts at introducing other foreign investment friendly incentives on value-added tax, royalty payments, import tariffs, sales taxes, property tax and depreciation allowances. This includes stable power supply, good transport and communication system, relative secured environment in their policies to prepare an encouraging atmosphere for increase flow of foreign direct investment in the future in order to bring about a collaborative effort for company income tax. Floating or flexible exchange rate should be introduced so as to boost its impact on foreign direct investment and company income tax. Government should reduce the interest rate, embark on expansionary fiscal policy and also reduce the rate of unemployment as a way to increase the inflow of FDI in the economy.
REFERENCE
Pesaran, H.M. et al. "Bound testing approaches to the analysis of long-run relationships." Journal of Applied Econometrics, vol. 16, 2001, pp. 289-326.
Rajender, S.G. et al."Foreign direct investment and economic growth in India: An empirical analysis." International Journal of Research in Commerce and Management, 2010. www.ijrcm.org.in.
Oyeranti, O.A. "Conceptual and theoretical issues in foreign private investment in Nigeria." Proceedings of the 12th Annual Conference of the Zonal Research Units of the Central Bank of Nigeria, Kaduna, 1-5 Sept. 2003, pp. 1-24.
Hall, Robert and Dale Jorgenson. "Tax policy and investment behaviour." American Economic Review, 1967.
UNCTAD. World Investment Report 2010. 2010.
Onu, A. and C. Joel. "Impact of foreign direct investment on economic growth in Nigeria." Interdisciplinary Journal of Contemporary Research in Business, vol. 4, no. 5, 2012.
Ayodele, O. Tax Policy Reform in Nigeria. WIDER Research Paper 2006/03, UNU-WIDER, Finland, 2006. http://www. wider.unu.edu/2006/en-GB/rp2006-03/.
Soyede, L. and S.O. Kajola. Taxation Principles and Practice in Nigeria. 1st ed., Silicon Publishing Company, 2006.
Garner, Bryan A. Black’s Law Dictionary. 10th ed., 2010.
Ola, C.S. Nigerian Income Tax Law and Practice. 4th ed., Macmillan Publishers, 2005.
Coolly, Thomas. ICAN Study Pack: Taxation for Professional Examination 1. Lagos, VI Publishing Limited, 2006.
Nightingale, K. Taxation Theory and Practice. 4th ed., Pearson Education Limited, 2007.
Borensztein, E.J. et al."How does foreign direct investment affect economic growth?" Journal of International Economics, vol. 45, no. 1, 1998, pp. 115-135.
Ayanwale, A.B. FDI and Economic Growth: Evidence from Nigeria. AERC Research Paper 165, African Economic Research Consortium, Nairobi, 2007.
Blomstrom, M. et al. Does Foreign Direct Investment Promote Development? Washington, D.C., Institute for International Economics, 2002, pp. 195-220.
International Monetary Fund. Transition: The First Ten Years. Analysis and Lessons for Eastern Europe and the Former Soviet Union. The World Bank, Washington, D.C., 2002.
Mosima, M. The Attraction of the Foreign Direct Investment (FDI) by the African Countries. 2003.
Atoyebi, G.O. Tax Incentives and Investment Behaviour in Nigeria. Ph.D. Thesis, University of Ife, 1985.
Sun, H. "Macroeconomic impact of foreign direct investment in China: 1976-1996." The World Economy, vol. 21, no. 5, 1998, pp. 675-694.
Desai, M.A. et al. "Foreign direct investment in a world of multiple taxes." Journal of Public Economics, vol. 88, 2004, pp. 2727-2744.
Benassy-Quere, A. et al. "How does FDI react to corporate taxation?" International Tax and Public Finance, vol. 12, no. 5, Sept. 2005, pp. 583-603.
Taro, P. "Empirical analysis of international tax treaties and foreign direct investment." Financial Review, vol. 94, 2009, pp. 172-190.
Babatunde, S.A. The Impact of Tax Incentives on Foreign Direct Investment in Oil and Gas Sector in Nigeria. Postgraduate Thesis. IOSR Journal of Business and Management, 2012. www.iosrjournal.org.
APPENDIX 1
Causality Test
H0: There is no causal relationship between foreign direct investment and company income tax in Nigeria
H1: There is causal relationship between foreign direct investment and company income tax in Nigeria
The hypothesis above is tested through the system equation of the vector error correction table presented below:
Table 1: System Equation Vector Error Correction Model
Dependent Variable D(CIT)
Method: Least Squares
Date: 09/30/15 Time: 13:37
Sample (adjusted): 1978 2012
Included observations: 34 after adjustments
HAC standard errors & covariance (Barlett Kernel, Newey-West fixed bandwidth = 4.0000
Ogunleye, E., Adeyemi, P., Abegunde, J. & Oloniluyi, A. (2021). The Dynamic Relationship Between Tax Revenue and Foreign Direct Investment in Nigeria. IAR Journal of Business Management, 2(1), 1-9.
MLA
Ogunleye, E.O., et al. "The Dynamic Relationship Between Tax Revenue and Foreign Direct Investment in Nigeria." IAR Journal of Business Management 2.1 (2021): 1-9.
Chicago
Ogunleye, E.O., P.A. Adeyemi, J.K. Abegunde and A.E. Oloniluyi. "The Dynamic Relationship Between Tax Revenue and Foreign Direct Investment in Nigeria." IAR Journal of Business Management 2, no. 1 (2021): 1-9.
Harvard
Ogunleye, E., Adeyemi, P., Abegunde, J. and Oloniluyi, A. (2021) 'The Dynamic Relationship Between Tax Revenue and Foreign Direct Investment in Nigeria' IAR Journal of Business Management 2(1), pp. 1-9.
Vancouver
Ogunleye E, Adeyemi P, Abegunde J, Oloniluyi A. The Dynamic Relationship Between Tax Revenue and Foreign Direct Investment in Nigeria. IAR Journal of Business Management. 2021 Jan;2(1):1-9.



 Download PDF
 Download XML