The study was conducted on the ground covers in Sulaymaniyah district, northeastern Iraq located between longitudes (45°0'0"E) (45°20'0"E) and latitudes (35°50'0"N) (36°50'0"N), Remote sensing and GIS techniques were used, using Sentinel-2 satellite image data, with a spatial resolution of 10 meters. The results of the study showed that there are six ground covers: (Shrub and Grassland and natural pastures and agricultural areas ranked first, followed by rocky lands and barren lands, sparse vegetation covers, urban areas, dense vegetation cover, which form part of coniferous forests, and water). And in percentages (24, 22, 17, 14, 10.9 and 10.2%) respectively. Overall accuracy of 86% and Kappa Coefficient 0.82. These results are consistent with the reality of the study area.
The profound transformations of land transformations are becoming increasingly evident from local to global scales [1]. There is clear evidence that global environmental change is largely due to human activities, and in recent times land use change has become the main driver of change in the Earth system either by transforming landscapes for the purposes of human activities or by changing management practices in the landscapes they dominate human Changes in land use and land cover are the main drivers of global climate change [2].
Mapping land use and land cover using remote sensing techniques and geographic information systems is one of the most effective and modern methods with lower costs to obtain a clear understanding of land cover classification processes, there are many studies in the field of monitoring and evaluating land cover to work on improving the management of natural environmental resources. Among the applications that enable us to obtain this information are the spectral indicators of the land cover, including the natural vegetative difference index, which depends on mathematical equations from the reflectivity data recorded by sensors to reach the goal It is based on the principle of interaction of rays falling from the targets under study, This method is one of the most famous and widely used automated methods, because it uses statistical algorithms and mathematical methods such as addition, subtraction, division and multiplication to extract ground variables [3].
The use of remote sensing techniques and geographic information systems are important tools for studying land uses and land cover to obtain useful outputs for monitoring the Earth’s surface using satellite data. Such studies are useful for developing countries where changes in land use occur much faster. These developments have specific effects on the environment as it provides a strategic guide for all urban and rural land use planners for effective land management aimed at including biophysics and social and economic factors [4]. Therefore, GIS has the ability to manipulate and analyze spatio-temporal data that can be used to map, monitor and identify the driving forces and measure the intensity of land use and land cover changes that occur during different time periods [5].
Figure 1: Geographical Location of Study Area
This study aims to achieve the following:
Calculation of land use areas and ground cover using remote sensing techniques and geographic information systems
Preparing maps of land covers and land uses and calculating the accuracy of the maps that are produced
Study Area
Study area located in the northeastern Iraq located between longitudes (45°0'0"E) (45°20'0"E) and latitudes (35°50'0"N) (36°50'0"N) (Figure 1). It includes several districts of 14 districts, the most important of which are the border district of Penguin, Chamchamal, and others, and 46 districts. There are resorts in the province, including the resorts of Ahmedawa, Sercinar, Dokan, Surtak, Konmassi, and the famous Mount Azmar in the city. and others. There are also two large dams in the province that were built in the fifties of the last century, namely the Dukan Dam and the Darbandikhan Dam (Figure 1). The average annual rainfall reaches 900 mm per year and temperatures reach 40 degrees Celsius in the summer, located at an altitude of 845 meters above sea level. It is characterized by agricultural lands and their containment of wooden lands represented by scattered oak trees and the presence of areas of artificial coniferous trees on the mountain slopes in the governorate, in addition to other types of trees that are naturally spread in the study area.

Dataset
Satellite data was used for this study images of 2021, which contains 13 spectral bands Table 1 and used the fourth spectral band represented in the infrared and the eighth band represented in the near infrared,
Table: Spectral Bands and Spatial Resolution for Sentinal-2
| Band | Wavelength | Resolution (m) |
| Coastal Aerosol | 0.443 | 60 |
| Blue | 0.490 | 10 |
| Green | 0.560 | 10 |
| Red | 0.665 | 10 |
| Red-Edge 1 | 0.705 | 20 |
| Red-Edge 2 | 0.740 | 20 |
| Red-Edge 3 | 0.783 | 20 |
| Near Infrared (NIR) | 0.842 | 10 |
| Near Infrared Narrow (NIRn) | 0.865 | 20 |
| Water Vapor | 0.945 | 60 |
| Cirrus | 1.375 | 60 |
| SWIR 1 | 1.610 | 20 |
| SWIR 2 | 2.190 | 20 |
these satellite images were obtained from the website of the State Geological Survey (http://earthexchanrer. usgs.gov) in order to extract the values of the NDVI index, whose value ranges between (+1) and (-1). Positive values indicate the presence of vegetation covers, while negative values indicate urban areas, barren lands and water.
Image Pre‑Processing
The images were collected from the USGS earth explorer to assess the spatial growth of the forest canopy as well as the various forest features of the study area. The images are also converted into a Universe Transverse Mercator (UTM) display from the geographic coordinate system for better area calculation and data extraction. The WGS84 data system was considered during the image processing time. Atmospheric correction was performed in Arc GIS software for better satellite image representation and data acquisition. Meanwhile, the appropriate bands combinations were selected and the images were properly optimized by Arc GIS software.

Figure 2: Min and Max NDVI index Values

Figure 3: Normalized Difference Vegetation Index Map

Figure 4: Ratios Land Use and Land Cover

Figure 5: Area Land Use and Land Cover
Normalized Difference Vegetation Index
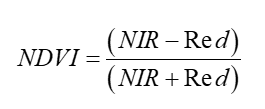
In general, the NDVI index is a vegetation index that indicates the appropriate health status of plants and forest lands in a region. Its value ranges between (+1) and (-1) (Figure 2) a higher value indicates better health of plants, on the contrary a lower value indicates poor vegetation health, this is the most common and most used vegetation indicator which is NDVI which detects vegetative areas and the differences are used Between the red band and the near infrared band [6]:

where:
NIR = Near Infrared
Red = Reflectance value of red Bhandari and Kumar
The results of the study showed that the value of the Normalized Difference Vegetation Index ranged between (-0.553) and (+0.812) in the study area (Figure 2). The natural pastures, shrub and grassland constituted the largest area and reached (87.23) Km2 with a percentage (24%), then barren lands and rocky lands with an area (80.79) Km2 and in percentage (22%) and Sparse vegetation areas formed an area (63.76) Km2 and in percentage (17%), The area of urban areas (52.75) ) Km2 with a percentage (14%) and dense vegetation appeared in the penultimate rank with an area (39.34) Km2 and in percentage (10.9%) and water appeared the least area (36.92) Km2 and by (10.2%) (Table 2), (Figure 4), (Figure 5). These results are consistent with the reality of the study area.
Table 2: Pixel Values, Ratios and Areas for Land Use and Land Cover
Classes | Count | Ratios (%) | Area km2 |
Water | 369252 | 10.23 | 36.92508 |
Built Up Area | 527567 | 14.62 | 52.75653 |
Barren Land | 807933 | 22.39 | 80.79304 |
Shrub and Grassland | 872381 | 24.17 | 87.23781 |
Sparse Vegetation | 637645 | 17.67 | 63.76429 |
Dense Vegetation | 393484 | 10.90 | 39.34827 |
3608262 | 100 % | 360.825 | |
Table 3: Confusion Matrix for NDVI Map
| Classes | Water | Built Up Area | Barren Land | Shrub and Grassland | Sparse Vegetation | Dense Vegetation | Total | User's Accuracy % |
| Water | 10 | 0 | 1 | 0 | 0 | 0 | 11 | 90.90 |
| Built Up Area | 0 | 8 | 0 | 0 | 0 | 0 | 8 | 100 |
| Barren Land | 0 | 0 | 9 | 0 | 0 | 0 | 9 | 100 |
| Shrub and Grassland | 0 | 0 | 0 | 8 | 0 | 0 | 8 | 100 |
| Sparse Vegetation | 0 | 2 | 0 | 2 | 8 | 1 | 13 | 72.72 |
| Dense Vegetation | 0 | 0 | 0 | 0 | 2 | 9 | 11 | 81.81 |
| Total | 10 | 10 | 10 | 10 | 10 | 10 | ||
| Producer's Accuracy (%) | 100% | 80% | 90% | 80% | 80% | 90% | ||
| Overall Accuracy | 86% | |||||||
| Kappa Coefficient | 0.826 | |||||||
Accuracy Assessment
Evaluate classification accuracy using error matrix method and kappa scale [7,8]. Use for this purpose High resolution images provided by Google Earth, this is done by creating points on land uses in the (Arc GIS) program and linking these points with Google Earth (Table 3), (Figure 3).
This study reached to determine the ground covers that cover the study area by classifying the data of the Sentinel-2 satellite Image.
The use of indicators is one of the appropriate methods as it can be relied upon in the classification of land uses, due to its dependence on mathematical equations, and the study concluded six types of land covers (water, Built Up Area, Barren Land, Shrub and Grassland, Sparse Vegetation and Dense Vegetation), and these results are consistent with the reality of the study area.
Reid, W.V. et al. "Ecosystems and human well-being-synthesis: A report of the Millennium Ecosystem Assessment." Island Press, 2005.
Gbetkom, P.G. et al. "Mapping change detection of LULC on the Cameroonian shores of Lake Chad and its hinterland through an inter-seasonal and multisensor approach." International Journal, vol. 7, no. 1, 2018, pp. 2835–2849.
Bera, B. et al. "Estimation of forest canopy cover and forest fragmentation mapping using Landsat satellite data of Silabati River Basin (India)." 2020.
Singh, S.K. et al. "Predicting spatial and decadal LULC changes through cellular automata Markov chain models using earth observation datasets and geo-information." Environmental Processes, vol. 2, no. 1, 2015, pp. 61–78.
Samanta, S. and Pal, D.K. "Change detection of land use and land cover over a period of 20 years in Papua New Guinea." Natural Science, vol. 8, 2016, pp. 138–151. http://dx.doi.org/10.4236/ns.2016.83017.
Gandhi, G. "Ndvi: vegetation change detection using remote sensing and GIS-a case study of Vellore District." Procedia Computer Science, vol. 57, 2015, pp. 1199–1210. https://doi.org/10.1016/j.procs.2015.07.415.
Banko, G. "A review of assessing the accuracy of classification of remotely sensed data and methods including remote sensing data in forest inventory." International Institute for Applied Systems Analysis- Interim Report, no. 119, 1998, pp. 270–279.
Ranjan, A.K. et al. "Prediction of land surface temperature using artificial neural network in conjunction with geoinformatics technology in Sun City Jodhpur (Rajasthan), India." Asian Journal of Geoinformatics, vol. 17, no. 3, 2017, pp. 14–23.