+91 6002993949
submission@iarconsortium.org
Open Access
ISSN (Print) : XXXX-XXXX
ISSN (Online) : 2708-3594
Background: Dengue fever is associated with electrolyte disturbances. Hyponatremia and hypokalemia are the commonest electrolyte disturbances. The reason for hyponatremia in classic Dengue fever patients was uncertain. However, it might be the consequence of salt depletion, excess water from increased metabolism, transient inappropriate antidiuretic hormone or the influx of sodium in the cells as a result of dysfunction of sodium potassium pump3. The purpose of the present study was to assess the electrolyte disturbances in Dengue infected patients and to find relation of electrolyte disturbances to complication of Dengue fever. Methods: In this cross sectional study we assessed100 patients admitted with acute stroke in Victoria and Bowring and Lady Curzon hospital during period June 2019 to December 2019. 100 cases of Dengue virus infections were confirmed using Dengue day 1 test kit for detecting dengue antigen. It is a rapid solid phase immune-chromatographic test for the qualitative detection of Dengue NS1 antigen and differential detection of IgM and IgG antibodies to Dengue virus. Serum Sodium and potassium were estimated. Serum electrolyte levels are correlated with Dengue severity. Results: Out of 100 subjects, 3 were having dengue shock syndrome; 28 were having dengue with warning signs and 69 were having dengue without warning signs Majority of patients were males (73) while (27) were female patients. Out of 3 subjects having dengue shock syndrome, all the 3 subjects were females. Fever was found to be the most common clinical presentation in 97 patients (97.9) followed by myalgia in 69 patients (69.6%), headache in 59 patients (59.5%), skin rash in 27 patients (27.27). In the present study, Median sodium levels were high in group having dengue without warning signs (137) followed by dengue with warning signs (131) and dengue shock syndrome (124). Out of 100 subjects, 31 had mild hyponatremia, 7 had moderate hyponatremia and 62 had normal Sodium scores. Chi-square test showed significant association between sodium and dengue severity (c2 = 34.82, p = 0.00). Median Potassium levels were high in group having dengue without warning signs (3.9) followed by dengue with warning signs (3.75) and dengue shock syndrome (3.7). Out of 100 subjects, 35 had mild hypokalemia, 1 had moderate hypkalemia and 84 had normal potassium scores. Chi-square test showed no significant association between potassium and dengue severity. Conclusion: Hyponatremia was the most frequent electrolyte disturbance. Mild hyponatremia and mild hypokalemia were more common among patients of Dengue without warning signs, whereas moderate and severe hyponatremia were more common among Dengue with warning signs and severe Dengue.
Dengue is a disease spread by the Aedes mosquito and it is an entity known to mankind since 1780 [1]. Dengue fever is a viral illness caused by one of the four serotypes of Dengue viruses belonging to the flaiviviridae family. It has four serotypes DENV 1, DENV 2, DENV 3 and DENV 4.
According to World Health Organization (WHO) more than 2.5 billion people are at risk of Dengue infection. Dengue has been identified as a disease of the future owing to trends toward increased urbanization, scarce water supplies and possibly environmental change [2].
Infection with the dengue virus may be asymptomatic or may give rise to a spectrum of clinical illness, ranging from undifferentiated fever to a severe life threatening hemorrhagic/shock syndrome with multiple organ failure and fatality.
Dengue fever is associated with electrolyte disturbances. Hyponatremia and hypokalemia are the commonest electrolyte disturbances. The reason for hyponatremia in classic Dengue fever patients was uncertain. However, it might be the consequence of salt depletion, excess water from increased metabolism, transient inappropriate antidiuretic hormone or the influx of sodium in the cells as a result of dysfunction of sodium potassium pump [3].
The purpose of the present study was to assess the electrolyte disturbances in Dengue infected patients and to find relation of electrolyte disturbances to complication of Dengue fever.
A study was conducted on 100 Dengue patients who were admitted in hospitals attached to BMCRI. History was taken, general physical examination and a detailed systemic examination was done. Dengue virus infections was confirmed using Dengue day 1 test kit for detecting dengue antigen. It is a rapid solid phase immune-chromatographic test for the qualitative detection of Dengue NS1 antigen and differential detection of IgM and IgG antibodies to Dengue virus. Serum Sodium and potassium were estimated. Serum electrolyte levels are correlated with Dengue severity.
Objectives of the Study
To estimate Serum Electrolytes in patients with Dengue
To correlation between Dengue infection severity and serum electrolyte levels
Study Period
June 2019-December 2019.
Inclusion Criteria
Age more than 18 years.
Patients of all gender aged >18 years with diagnosis of Dengue fever
Exclusion Criteria
Patient not willing to give informed consent
Patients aged <18 years
pre-existing renal and hepatic dysfunction
Chronic liver disease
Chronic kidney disease
Statistical Methods
Data was analyzed by descriptive statistics. Correlation between Dengue infection severity and serum electrolyte levels was measured using Spearman’s correlation coefficient Correlation between Dengue infection severity and serum electrolyte levels was measured using Spearman’s correlation coefficient.
Statistical Software
The Statistical software namely SAS 9.2, SPSS 15.0, Stata 10.1, Med Calc 9.0.1, Systat 12.0 and R environment ver.2.11.1 were used for the analysis of the data and Microsoft word and Excel have been used to generate graphs, tables etc.
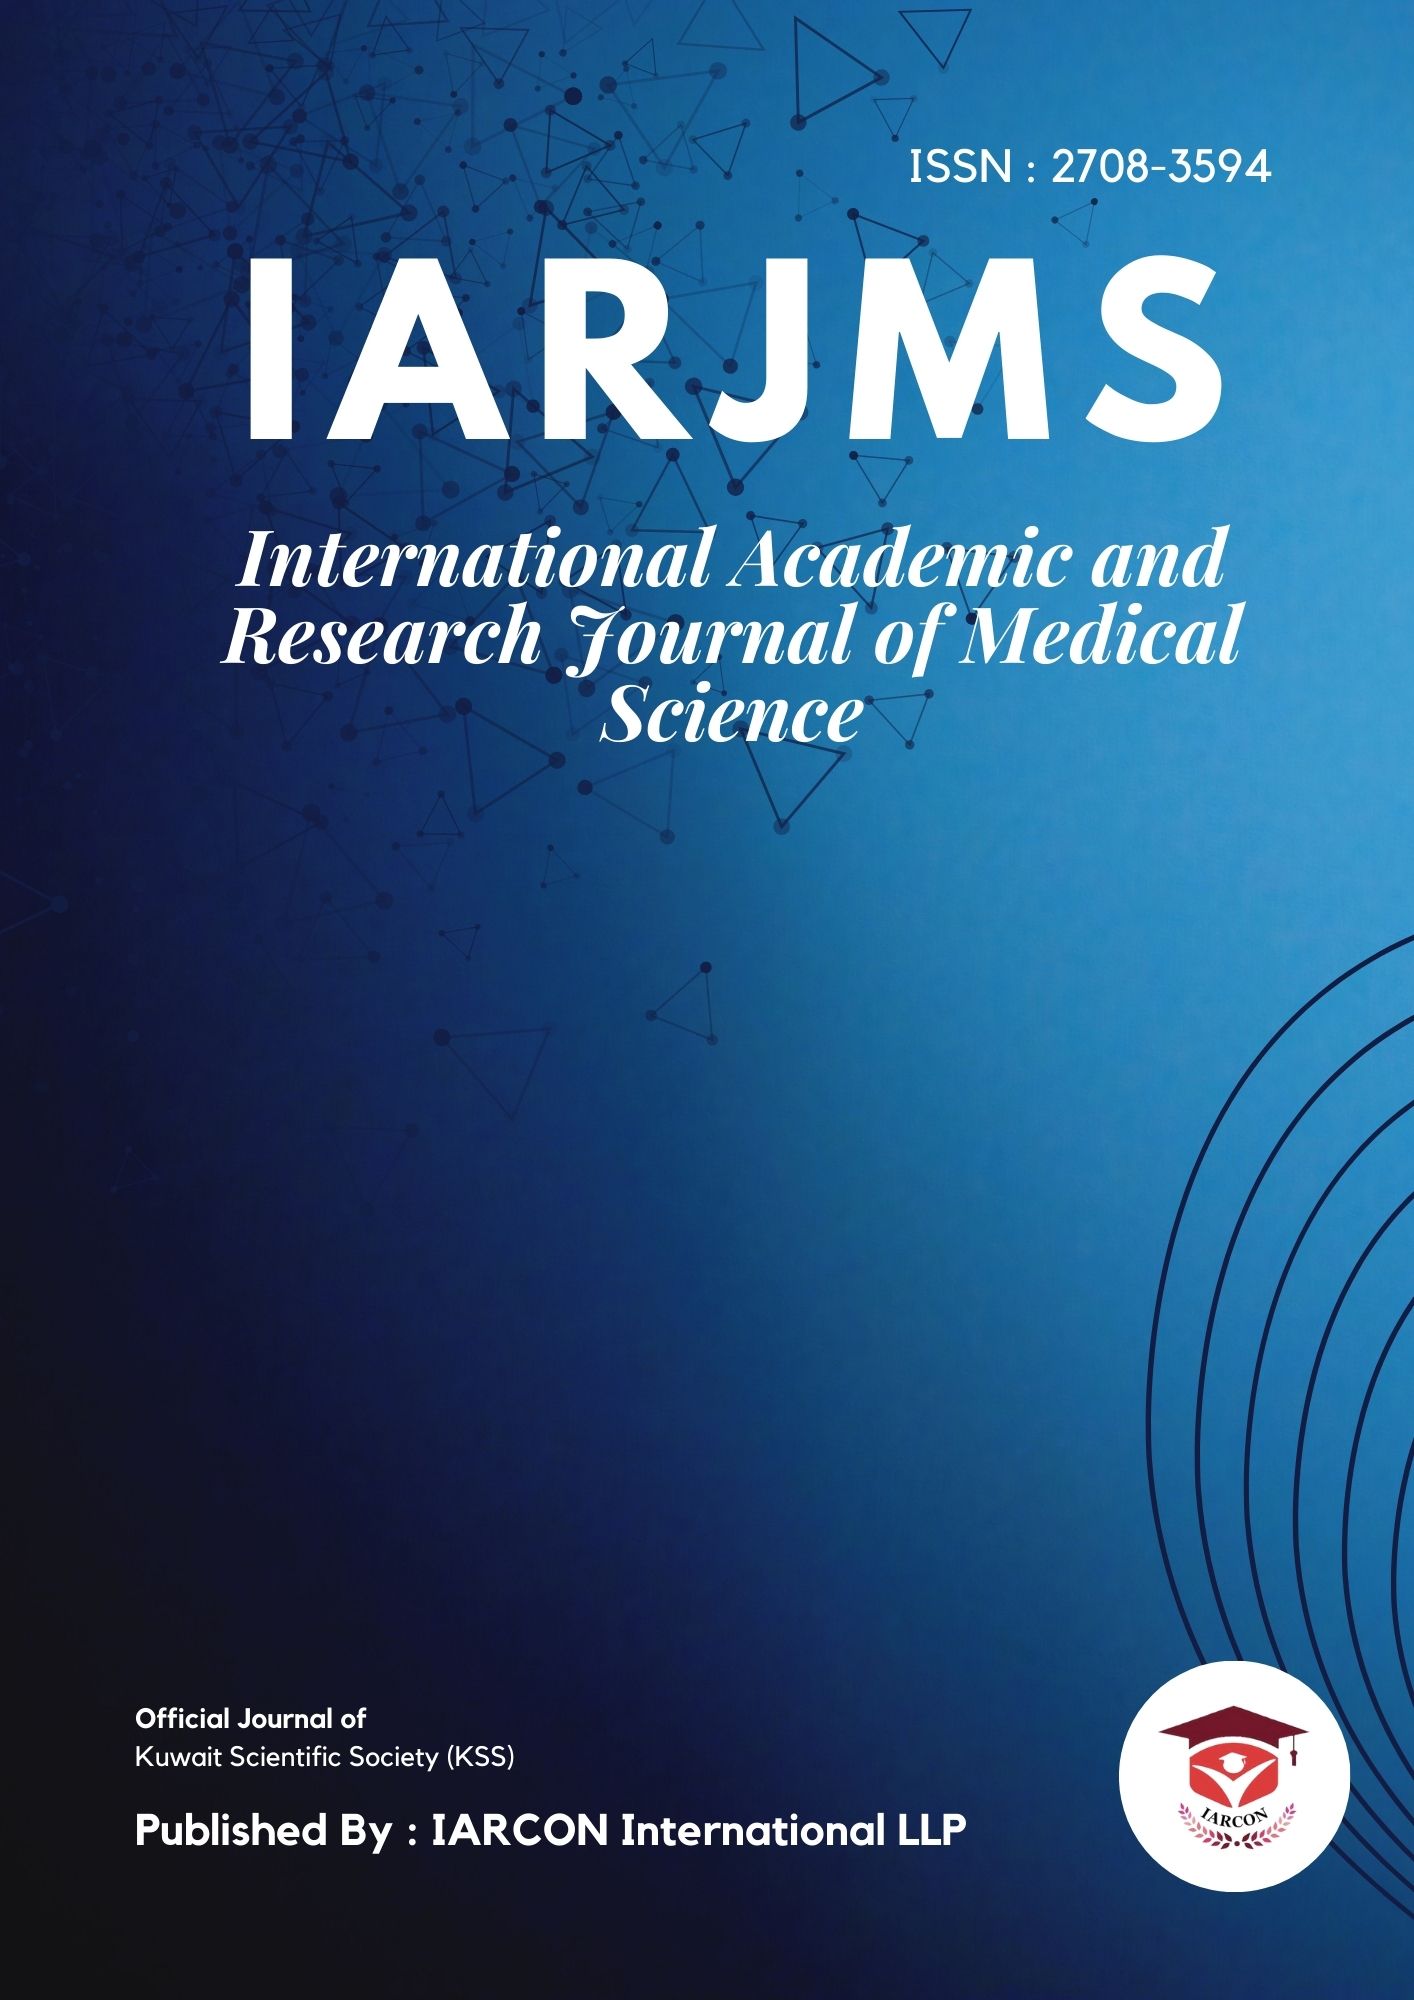
In the present study Out of 100 subjects, 3 were having dengue shock syndrome; 28 were having dengue with warning signs and 69 were having dengue without warning signs.
Majority of patients were males (73) while (27) were female patients. Out of 3 subjects having dengue shock syndrome, all the 3 subjects were females. Out of 28 (100%) subjects having dengue with warning signs, 17 (60.7%) were males and 11 (39.3%) were females. Out of 69 (100%) subjects having dengue without warning signs, 53 (76.8%) were males and 16 (23.2%) were females. Chi-square test was applied to associate the groups with gender. Chi-square test showed no significant association with respect to gender (c2 = 3.76; p = 0.152) (Table 1).
Table 1: Distribution of The Subjects Based On Dengue Severity
Groups | Frequency | Percent |
Dengue shock syndrome | 3 | 3.0 |
Dengue with warning signs | 28 | 28.0 |
Dengue without warning signs | 69 | 69.0 |
Total | 100 | 100.0 |
Median age was 45 for subjects with dengue shock syndrome; 28 for subjects having dengue with warning signs and 26 for subjects having dengue without warning signs (Table 2).
Table 2: Distribution of The Subjects Based On Age
Groups | N | Minimum | Maximum | Median | IQR |
Dengue Shock syndrome | 3 | 40 | 50 | 45 | - |
Dengue with warning signs | 28 | 18 | 60 | 28 | 14 |
Dengue without warning signs | 69 | 18 | 56 | 26 | 12 |
Fever was found to be the most common clinical presentation in 97 patients (97.9) followed by myalgia in 69 patients (69.6%), headache in 59 patients (59.5%), skin rash in 27 patients (27.27).
In the present study, Median sodium levels were high in group having dengue without warning signs (137) followed by dengue with warning signs (131) and dengue shock syndrome (124), Kruskal-wallis test was applied to compare the sodium levels among the groups. Kruskal-wallis test showed statistical significant difference among the groups (p = 0.00) (Table 3, Figure 1).
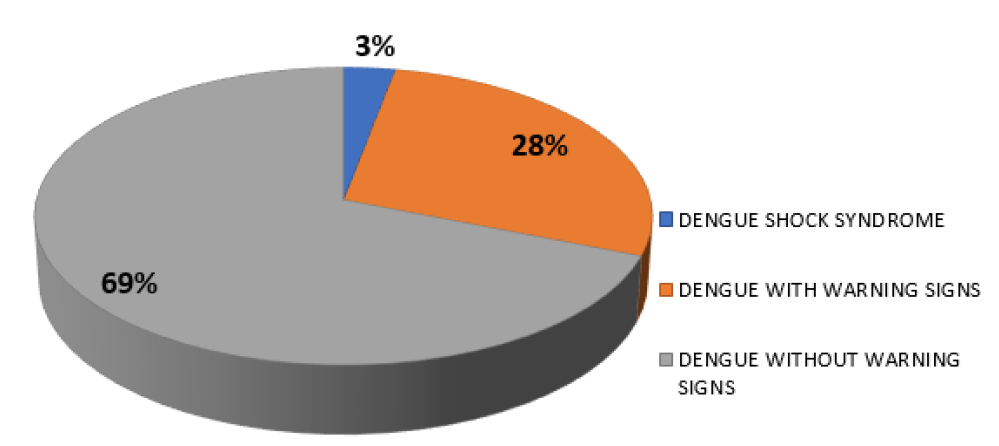
Figure 1: Distribution of the Subjects Based on Dengue Severity
Table 3: Comparison of The Subjects Based On Sodium Levels Using Kruskal-Wallis
| Groups | N | Minimum | Maximum | Median | IQR | p-value |
| Dengue Shock syndrome | 3 | 122 | 126 | 124 | - | 0.00* |
| Dengue with warning signs | 28 | 122 | 141 | 131 | 9 | |
| Dengue without warning signs | 69 | 130 | 150 | 137 | 4 |
*significant
Median Potassium levels were high in group having dengue without warning signs (3.9) followed by dengue with warning signs (3.75) and dengue shock syndrome (3.7). Kruskal-wallis test was applied to compare the potassium levels among the groups. Kruskal-wallis test showed no statistical significant difference among the groups (p = 0.398) (Table 4, Figure 2).
Table 4: Comparison of The Subjects Based On Potassium Levels Using Kruskal-Wallis
| Groups | N | Minimum | Maximum | Median | IQR | p-value |
| Dengue Shock syndrome | 3 | 3.4 | 5.1 | 3.7 | - | 0.398 |
| Dengue with warning signs | 28 | 3.1 | 5.2 | 3.75 | 0.5 | |
| Dengue without warning signs | 69 | 2.7 | 4.9 | 3.9 | 0.5 |
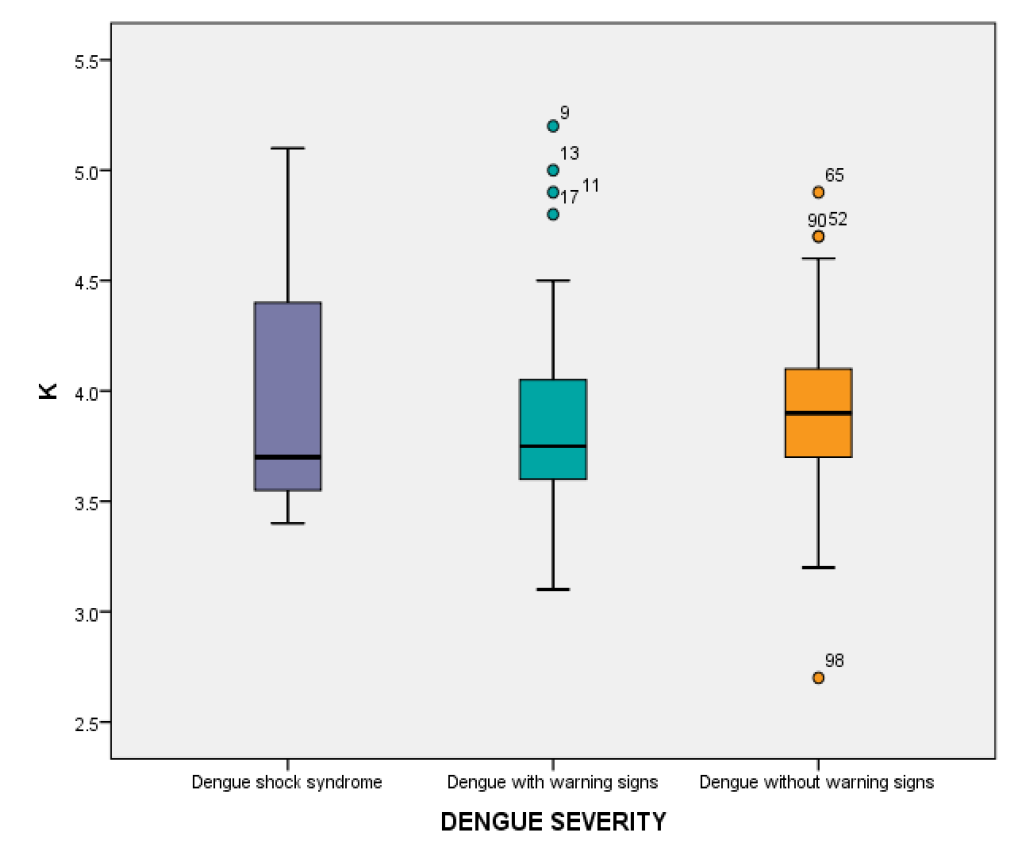
Figure 2: Dengue Severity
Post-hoc Mann-whitney test was applied to compare the sodium and Potassium levels between the groups. Statistical significant difference was seen between dengue shock syndrome and dengue without warning signs (p = 0.00); between dengue with warning signs and dengue without warning signs (p = 0.00) (Table 5).
Table 5: Post-Hoc Mann-Whitney
| Elements | Values | Dengue shock syndrome v/s dengue with warning signs | Dengue shock syndrome v/s dengue without warning signs | Dengue with warning signs v/s dengue without warning signs |
| Na | U value | 9.5 | 0 | 420 |
| p-value | 0.029 | 0.00* | 0.00* | |
| K | U value | 41 | 93 | 796.5 |
| p-value | 0.94 | 0.76 | 0.17 |
*p-value set significant at 0.05/3 = 0.016
Out of 100 subjects, 31 had mild hyponatremia, 7 had moderate hyponatremia and 62 had normal Sodium scores. Chi-square test showed significant association between sodium and dengue severity (c2 = 34.82, p = 0.00) (Table 6, Figure 3).
Figure 3: Cross Tabulation of Dengue Status and Sodium Scores
Table 6: Cross-Tabulation of Dengue Status and Sodium Scores
| Parameters | Dengue Severity | Total | |||
| Dengue Shock Syndrome | Dengue with warning signs | Dengue without warning signs | |||
| mild hyponatremia | Count | 1 | 13 | 17 | 31 |
| % | 33.3 | 46.4 | 24.6 | 31.0 | |
| moderate hyponatremia | Count | 2 | 5 | 0 | 7 |
| % | 66.7 | 17.9 | 0.0 | 7.0 | |
| normal | Count | 0 | 10 | 52 | 62 |
| % | 0.0 | 35.7 | 75.4 | 62.0 | |
| Total | Count | 3 | 28 | 69 | 100 |
| % | 100.0 | 100.0 | 100.0 | 100.0 | |
Chi-square value- 34.82, p-value- 0.00*, *significant
Out of 100 subjects, 35 had mild hypokalemia, 1 had moderate hypkalemia and 84 had normal potassium scores. Chi-square test showed no significant association between potassium and dengue severity (c2 = 2.7, p = 0.60) (Table 7, Figure 4).
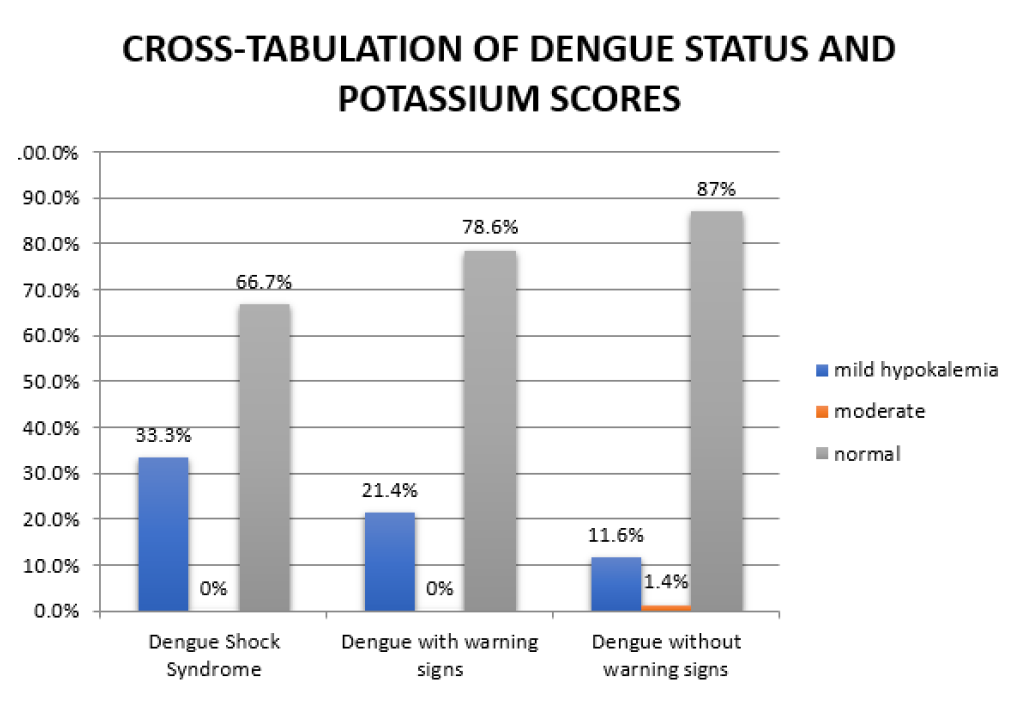
Figure 4: Cross Tabulation of Dengue Status and Potassium Scores
Table 7: Cross-Tabulation of Dengue Status and Potassium Scores
| Parameters | Dengue Severity | Total | |||
| Dengue Shock Syndrome | Dengue with warning signs | Dengue without warning signs | |||
| mild hypokalemia | Count | 1 | 6 | 8 | 15 |
| % | 33.3 | 21.4 | 11.6 | 15.0 | |
| moderate | Count | 0 | 0 | 1 | 1 |
| % | 0.0 | 0.0 | 1.4 | 1.0 | |
| normal | Count | 2 | 22 | 60 | 84 |
| % | 66.7 | 78.6 | 87.0 | 84.0 | |
| Total | Count | 3 | 28 | 69 | 100 |
| % | 100.0 | 100.0 | 100.0 | 100.0 | |
Chi-square value- 2.70, p-value- 0.60
In the present study demographic characteristics of the study participants was studied in which, majority of the patients 73 were males while 27 were female patients. Median age was 45 for subjects with dengue shock syndrome; 28 for subjects having dengue with warning signs and 26 for subjects having dengue without warning signs. Rahul et al. cited that the mean age of the cases was 66.1±4.7 years, of which 87% belonged to the age group of 60–70 years, 11% were in the age group 70–80 and 2% of the patients were 80+ years old [4]. Muhammad et al. cited that two-thirds (70.9%) were male. The mean age was 35.2±14.7 years (range 15–85 years. In the present study patients were distributed according to their clinical presentation. Fever was found to be the most common clinical presentation in 97 patients (97.9) followed by myalgia in 69 patients, headache in 59 patients, skin rash in 27 patients [5].
The two leading symptoms other than fever and myalgia 69 were headache (59) and skin rash (27). Garg RK et al. quoted that ten patients had myalgia and eight patients had a history of fever prior to development of weakness. Two patients had a family history of similar illness. One patient with idiopathic and two patients with secondary hypokalemic paralysis had respiratory involvement; none of them required ventilatory support [6].
In this study 69 patients belonged to Dengue fever category whereas, 28 patients belonged to Dengue hemorrhagic fever category and 3 patients belonged to dengue shock syndrome category. In the present study, Median sodium levels were high in group having dengue without warning signs (137) followed by dengue with warning signs (131) and dengue shock syndrome (124), Kruskal-wallis test was applied to compare the sodium levels among the groups. Kruskal-wallis test showed statistical significant difference among the groups (p = 0.00). Out of 100 subjects, 31 had mild hyponatremia, [7], had moderate hyponatremia and 62 had normal Sodium scores. Chi-square test showed significant association between sodium and dengue severity (c2 = 34.82, p = 0.00). Rahul et al. quoted that the incidence of hyponatremia (serum sodium <135mEq/L) was higher (50.9%) (mean 129.8 with SD of 14.66) with seven patients (13.2%) of the patients developing significant hyponatremia (<125mEq/L). 58% of the hyponatremic patients were found to be symptomatic [4]. Mekmullica et al. cited that hyponatremia was 9.7 times more common in Dengue patients, the mean serum sodium level was significantly lower in shock patients compared to non-shock patients (p-value = 0.003) [7]. Bandaru et al. stated that the mean serum sodium level was 136.6±5.4 in Dengue fever cases [8].
Median Potassium levels were high in group having dengue without warning signs (3.9) followed by dengue with warning signs (3.75) and dengue shock syndrome (3.7). Kruskal-wallis test was applied to compare the potassium levels among the groups. Kruskal-wallis test showed no statistical significant difference among the groups (p = 0.398). Out of 100 subjects, 35 had mild hypokalemia, 1 had moderate hypkalemia and 84 had normal potassium scores. Chi-square test showed no significant association between potassium and dengue severity (c2 = 2.7, p = 0.60). Widodo et al. stated that prevalence of hypokalemia in 23% (n = 105) of the hospitalized patients with Dengue fever [9]. Kalita et al. observed hypokalemia in association with infectious diseases, particularly in Dengue fever [10]. Rathod N et al. cited that the incidence of abnormal electrolytes as 13% in Dengue fever subjects [11].
Serum sodium and potassium levels with Dengue clinical syndromes (Dengue without warning signs, dengue with warning signs and dengue shock syndrome) was compared using Spearman’s correlation methods to find relationship between both the variables. It was found that there exists a positive and significant correlation between difference in sodium with dengue spectrums which implies that as the difference between the levels increases, greater are chances of the Dengue spectrum towards Dengue with warning signs or Dengue Shock syndrome. Rathod et al. stated that majority of the cases of severe Dengue with warning signs had abnormal serum electrolytes; the incidence of abnormal serum electrolytes was 13% [11] Arun et al. quoted that the mean sodium levels were 135.5 and mean potassium levels were 4.1; The levels were significantly reduced among cases with severe dengue presented with warning signs [12]. Bandaru et al. stated that the prevalence of hyponatremia was 35.5% among DF cases and 53.5% among DHF cases and hypokalemia as 16.1%. They also observed that the prevalence of deranged serum electrolytes was more common among severe cases of Dengue Hemorrhagic Fever (DHF) [8].
Hence the present study proves the correlation between Hyponatremia and severity of Dengue viral infections.
Hyponatremia was the most frequent electrolyte disturbance. Mild hyponatremia and mild hypokalemia were more common among patients of Dengue without warning signs, whereas moderate and severe hyponatremia were more common among Dengue with warning signs and severe Dengue.
Gurugama, P. et al. “Dengue viral infections.” Indian Journal of Dermatology, vol. 55, 2010, pp. 68–78.
Vikram, K. et al. “An Epidemiological study of dengue in delhi, India.” Acta Tropica, vol. 153, 2016, pp. 21–27.
Rush, B. “An account of the bilious remitting fever, as it appeared in philadelphia, in the summer and autumn of the year 1780.” Medical Inquiries and Observations, 1st ed., Prichard and Hall, 1789, pp. 89–100.
Unnikrishnan, R. et al. “Clinical and laboratory profile of dengue in the elderly.” Journal of Family Medicine and Primary Care, vol. 4, 2015, pp. 369–372.
Khalil, M.A.M. et al. “Electrolyte disturbances in dengue fever.” Clinical Kidney Journal, vol. 5, 2012, pp. 390–394.
Garg, R.K. et al. “Etiological spectrum of hypokalemic paralysis: A retrospective analysis of 29 patients.” Annals of Indian Academy of Neurology, vol. 16, 2013, pp. 365–370.
Mekmullica, J. et al. “Serum and urine sodium levels in dengue patients.” Southeast Asian Journal of Tropical Medicine and Public Health, vol. 36, 2005, pp. 197–199.
Bandaru, A.K. and C.S. Vanumu. “Early predictors to differentiate primary from secondary dengue infection in children.” Medical Journal of Dr. D.Y. Patil Vidyapeeth, vol. 9, 2016, pp. 587.
Widodo, D. et al. “The prevalence of hypokalemia in hospitalized patients with infectious diseases problem at cipto mangunkusumo hospital, Jakarta.” Acta Medica Indonesiana, vol. 38, 2018, pp. 202–205.
Kalita, J. et al. “Acute pure motor quadriplegia: Is it dengue myositis?” Electromyography and Clinical Neurophysiology, vol. 45, 2018, pp. 357–361.
Rathod, N. “A study of hematological and radiological profile of patients of dengue fever in paediatric age group.” 2017, pp. 440–444.
Gogna, A. et al. “Changing clinical profile of dengue fever in Delhi in 2011.” Journal of the Indian Academy of Clinical Medicine, vol. 16, 2015, pp. 20–26.
