+91 6002993949
submission@iarconsortium.org
Open Access
ISSN (Print) : XXXX-XXXX
ISSN (Online) : 2708-3594
Karl Landsteiner, discovered the ABO blood group system. However, the ABO subgroups and other weaker variants create problems in blood grouping. The A1 and A2 phenotypes account for about 99% of all A or AB blood group individuals and the rest are the weaker subgroups. They are usually suspected in cases of blood group discrepancies. Meticulous serological testing with technical expertise will help to differentiate these subgroups. We describe a case of a healthy Blood donor with blood group discrepancy due to a weak subgroup of ‘A’ in the ‘A’ blood group.
Blood group ‘A’ has the most variations in subgroup of any of the ABO blood types. There are about 20 different known subgroups. Al and A2 individuals make up the vast majority of people with A blood type, all other subgroups equal less than 1% of A’s.
Examples of subgroups A1, A2, A3, A4, An, Am, Ax, A4, Abantu, Afinn, Aint (A-A2 intermediate), Ael, Acl (various genotypes -AO1, AO1var, AO2), Aend, Ay and Aweak [1].
Classification of weak subgroups is generally based on the [2]:
Degree of RBC agglutination by anti-A and anti-A1
Degree of RBC agglutination by anti- AB
Degree of anti: H reactivity of the RBCs
Presence or absence of anti-A1 in the serum
Presence of A and H bood group specific substances in the saliva of secretors
Adsorption and Elution studies
Family (Pedigree) studies
Al and A2 Subgroups
These are the most important subgroups the system. Al equals approximately 80% of the entire A blood type population and A2 makes up the remaining 20%.
Differences between Al and A2
Al red blood cells have about one million A antigens per cell. A2 red cells have only 2,50,000 A antigens per cell, approximately one-fourth the amount that Al cells have. Subgroups weaker than A2 occurs infrequently. They are characterized by the declining number of A antigen sites on red cells and a reciprocal increase in H reactivity [2].
The H antigen (fucose) is a precursor of A and B antigens. It is present on the surface of all ABO types red blood cells –A, B, AB and O. Adult ‘O’ group individuals have approximately 1.7 million copies of H antigen per RBC. Normal A allele encodes α – 1,3 – N – acetyl galactosamine (GalNAc) to the H antigen forming A antigen. The Al gene is a much better converter of H (or the ‘O’ antigen) than is the A2 gene. Therefore, A2 red cells have much more H antigen than do Al red cells. The amount of H antigen on red cells of the common ABO groups from most to least is O > A2 > B> A2B> A1> A1B [1].
Al and A2 transferases differ in ‘pH optima’ (the pH -or alkalinity or acidity -at which an enzyme has maximum potency and efficiency). For Al and A1B that pH is 6.0, while forA2 and A2B the optimum pH is 7.0 (7.0 is the ‘neutral’ point and 6.0 is more acidic). The A2 tranferase functions best at a less acidic point than the Al transferase [1].
This is most simply done by using the anti-A1 lectin, Dolichos biflorus. In the undiluted state, the lectin extract of Dolichos biflorus reacts as anti-A, since it agglutinates both Al and A2 cells. When prepared at an appropriate dilution, however, the lectin reacts directly with Al and A1B but not A2 or A2B red cells. If the red cells agglutinate, the person is subgroup Al. If no agglutintion takes place, the blood is not Al and most probably is group A2 (Aint, an uncommon blood group, can also be agglutinated weakly by D. biflorus) [1].
The A3 subgroup is much more uncommon than the A2 subgroup. There is some genetic variability of this sub type but the most common mutation is the substitution of one amino acid for another at the gene codon [3].
It has been demonstrated that the enzymes that produce the A3 antigen are quite variable and fit into 3 categories:
An enzyme with no A transferase activity
An enzyme with an optimum pH of 6, which resembles the A1 producing enzyme but with only one third its activity
An enzyme with an optimal pH of 7 resembling the A transferase but has very low activity [3]
The cause of this is the point mutation which leads to partial glycosylation of H antigens resulting in mixed population of RBCs, one with A antigen and another totally devoid of A antigen. Some A3 individuals have been observed to have only 3-4% the A antigen compared to that of A1 individuals [3].
Sometimes serum may contain anti A1, because A3 individuals often recognize A1 antigen as foreign. Both A and H substance will be detected in secret or study of their saliva.
Case Presentation
A 33-year-old male came to our tertiary care teaching hospital’s blood center as a replacement donor. He did not have any systemic illness and there was no significant history. His hemoglobin was 13.5 g/dL and his weight was 64 kg. He was accepted for donation based on the screening criteria as per NBTC guidelines. We collected 350 ml of whole blood along with pilot tube samples.
Routine blood grouping from the pilot tube was performed by the conventional tube technique. The donor RBCs were tested with commercially available known anti-A, anti-B, anti-AB and anti-D anti-sera (Tulip Diagnostics Pvt. Ltd.). For forward grouping, we prepared a 3-5% washed RBC saline suspension from the Donor blood sample. Two drops of anti-A and anti-B and anti-AB were taken and one drop of RBC suspension was added to labelled test tubes, respectively.
For reverse grouping, donor serum was tested against known RBCs. Two drops of the donor serum were taken and one drop of in-house freshly prepared 3-5% saline suspension of pooled A-cells, B-cells, O-cells and auto-control was added in labelled test tubes, respectively. The test tubes were centrifuged at 1000 rpm for 1 min and the result was read against a well-lit background.
At room temperature, forward grouping showed anti-A:0, anti-B:0 and anti-AB:2+ agglutination; however, reverse grouping showed agglutination of A1-cells: 1+, B-cells: 4+, O-cells: 0 respectively and autocontrol was negative. The donor tested positive for anti-D. All the negative results were checked under the microscope. Testing with blood bag samples also showed similar results. The donor was called again and fresh blood and saliva sample was collected.
The fresh blood sample showed similar results at room temperature. The sample was tested with H and anti A1-lectin, which showed reactions as A1-lectin:0 and H-lectin:4+ at room temperature for 15 minutes. When incubated for 30 minutes at room temperature, the forward and reverse grouping results were the same. When incubated at 4°C for 30 minutes, results were forward grouping: anti-A:0, anti-B:0, anti-AB:3+, anti A1-lectin: 1+ and anti H- 4+ reverse grouping: A-cells:1+, B-cells:4+, O-cells:0 and autocontrol:0 (Table 1). The results were suggestive of cold-reacting low titer anti-A antibody and we suspected anti-A1 antibody in the donor serum.
We further performed an adsorption elution test to resolve the discrepancy; 1 mL of donor red cells washed thrice was mixed with 1 ml of serum for known blood group B as it contains naturally occurring anti-A antibodies. It was incubated at 4°C for 60 minutes and then centrifuged. The supernatant was removed. The red cells were washed with large quantities of cold saline and the final wash was preserved. The heat elution method was used to recover the antibodies. The eluate, as well as the final wash, was tested in parallel with three O-cells and three A-cells at room temperature, 4°C and 37°C after incubating for 15 minutes. It showed 1+ agglutination with A-cells at 4°C and 37°C (Table 2). This suggested the presence of an ‘A’ antigen. Thus, reverse grouping showed reactivity with A-cells and eluate showed the presence of ‘A’ antigen; we concluded that he is having a subgroup of ‘A’ in blood group A with the possibility of cold reacting anti-A1 antibody.
Inhibition testing was performed on a saliva sample. As there was unavailability of anti-Lea antisera and known secretors, only normal saline was used as a control. His saliva showed the presence of A, B and H antigens (Table 3).
Only H substance identified in the secretor study. Based on the results of adsorption elution and secretor studies, we concluded that it was a weak ‘A’ in the ‘A’ blood group and the possibility of Ax was considered. Weak A subgroups sometimes show the presence of naturally occurring anti-A1 antibodies, which further helps in classifying it as a weak ‘A’ phenotype. In our case, we found a 1+ reaction at 4°C with Anti-A1 cells, which we considered as anti-A1 antibodies. In view of these immunohematological findings, in a 33-year-old young healthy male with no underlying illness or under treatment, we reported it as a weak ‘A’ subgroup in the A blood group, Rh positive along with the presence of anti-A1 antibody. Further serum enzyme and molecular testing would have helped in confirming our findings; however, it could not be performed due to the lack of facilities (Figure 1).
Table 1: Forward and Reverse Grouping of Donor Sample at Room Temperature and 4°C
| Forward | Reverse |
|
|
| ||||
| Anti A | Anti B | Anti AB | Anti A1 lectin | Anti H | A1 cells | B cells | O cells | Auto Control |
At RT | 0 | 0 | 2+ | 0 | 4+ | 1+ | 4+ | 0 | 0 |
RT 15 min | 0 | 0 | 2+ | 0 | 4+ | 1+ | 4+ | 0 | 0 |
RT 30 min | 0 | 0 | 2+ | 0 | 4+ | 1+ | 4+ | 0 | 0 |
4°C 30 min | 0 | 0 | 3+ | 1+ | 4+ | 1+ | 4+ | 0 | 0 |
RT-Room Temperature; min-minutes
Table 2: Adsorption Elution Testing
Eluate | 37°C | RT | 4°C |
A-cells | 1+ | 0 | 1+ |
O-cells | 0 | 0 | 0 |
Final wash |
|
|
|
A-cells | 0 | 0 | 0 |
O-cells | 0 | 0 | 0 |
RT- Room Temperature
Table 3: Saliva Testing for Secretor Status
| Saliva+anti A+A-cells | Saliva+anti B+B-cells | Saliva+anti H+O-cells | Normal saline+anti A+A-cells | Normal saline+anti B+B-cells | Normal saline+anti H+O-cells |
Reaction | 1+ | 1+ | 0 | 1+ | 1+ | 1+ |
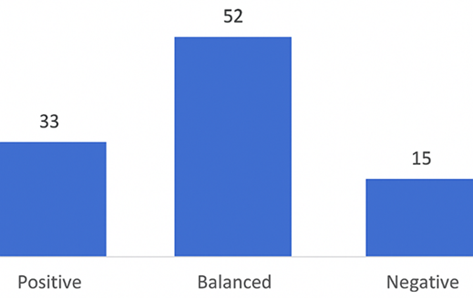
Figure 1: Evaluating Subtypes of ‘A’ Blood Group
The variants of the ‘A’ antigen can be seen in both the blood group A and AB and are more common than the ‘B’ antigen variants. A1 and A2 form 99% of ‘A’ antigen phenotypes [4]. The rest are weaker variants, like Ax, A3, Aend, etc., including others that are difficult to type serologically. The weaker variants usually require advanced testing like serum transferase enzyme studies and ‘A’ substance quantification and molecular analysis for differentiating them accurately. Wasnik et al. [5] presented a case report on weaker subgroup of A in AB blood group.
Sahu et al. [6] reported 15 (0.12%) ABO blood group discrepancies among 12,715 samples studied. Out of the 15 discrepancies, six (40%) were attributed to weak or missing antibodies due to subgroups [6]. Extremes of age, immunodeficiency conditions and other clinical conditions like post-hematopoietic stem cell transplant are a few possible causes of weak or missing reactivity of antibodies in the reverse grouping [7].
Das et al. [8] studied 67,954 samples, out of which 6618 were AB blood group. Among the AB blood group, 84.93% were A1B, 15.05% A2B and only 0.015% were weak subgroups of AB. They mentioned that subgroups are mainly of academic interest and group 'A' phenotypes which show weaker serologic reactivity than A2 are considered as weak subgroups [8].
Cartron [9] demonstrated that there is a gradual decrease in the standard agglutinability of weak 'A' RBC with human anti-A (B) sera, from A3 red cells (63±10%) to Ax (33±10%), Aend (10±5%) then Am, Ay and Ael (0%). The direct measurement of A antigen site densities was also performed and the mean values were 35,000 A sites/RBC in A3, 4800 in Ax, 3500 in Aend and 700 ‘A’ antigen sites/RBC in Am and Ael respectively [9].
Weak ‘A’ subgroups can be missed out or mistyped could lead to delayed hemolytic transfusion reaction and reduced cell survival post-Transfusion. It is advised that forward and reverse grouping should always be performed; if any discrepancy is encountered, meticulous serological testing should be performed to resolve it. In developing countries like India, blood centers should establish procedures to detect and differentiate weak subgroups and ensure safe blood transfusion and transplantation.
Disclosure
Consent was obtained from donor or waived by all participants in this study.
Conflicts of Interest
There are no conflicts of interest.
Lameckepalat39. 7 ABO sub groups.Scribd, [Internet], [cited 2025 Nov 3]. Available from: https://www.scribd.com/document/880045416/7-ABO-Sub-Groups
Directorate General of Health Services. Manual on blood transfusion services. 2nd Edn., New Delhi: Ministry of Health and Family Welfare, Government of India, 2003. Available from: https://dghs.gov.in/
Daniels, G. Human blood groups. Blackwell Science Ltd., 1995, Chapter 2.
Thakral, B. et al. “Importance of weak ABO subgroups.” Lab Medicine, vol. 36, 2005, pp. 32–34. DOI: 10.1309/X59T-AAYP-EPCN-BLUJ.
Wasnik, M. et al. “Blood group discrepancy in a whole blood donor with weak AB.” Cureus, vol. 15, no. 6, June 22, 2023, e40834. DOI: 10.7759/cureus.40834.
Sahu, A. et al. “Analysis of blood group discrepancy in healthy blood donors at a tertiary care referral hospital from Eastern India: a retrospective study.” J Lab Physicians, vol. 14, 2022, pp. 247–252. DOI: 10.1055/s-0042-1742417.
Harmening, D.M. The ABO blood group system. Modern blood banking and transfusion practices. Philadelphia: F.A. Davis Company Publications, 2019, pp. 119–145.
Das, S.S. et al. “Investigating weak A subgroups in a healthy lady: the blood bank limitations.” Asian J Transfus Sci., vol. 8, 2014, pp. 62–63. DOI: 10.4103/0973-6247.126699.
Cartron, J.P. “Quantitative and thermodynamic study of weak A erythrocyte phenotypes.” Rev Fr Transfus Immunohematol., vol. 19, 1976, pp. 35–44. DOI: 10.1016/s0338-4535(76)80087-6.
