
+91 6002993949
submission@iarconsortium.org
Open Access
ISSN (Print) : XXXX-XXXX
ISSN (Online) : 2708-3594
Haematology analysers provide us with the most basic and essential complete blood count of utmost importance in disease diagnosis and patient management. The functioning of the analysers to its most value requires a better machine-human interaction and understanding. The basis of the relationship is found by mutual trust gained through the process of verification, that is, the machine is performing as per the claims of the manufacturer. This process of verification is being described in the current article.
The modern era technological advances in healthcare warrant its reliability and affirmation for better human-machine trust. Automated haematology analysers (HA) form the essential and foremost instrument in present age medical laboratories. In order to gain maximum information from these machines there should be an understanding between the user i.e. Pathologist and the machine. Currently, market is flooded with plethora of these instruments by different manufacturers working essentially on similar principle. Selection of the instrument however, depends on various technical and other factors such as environmental, source of samples (institute/ hospital or OPD based laboratory), technical help available and last but not the least the budget analysis. This article would help in primarily verification of the instrument while throwing some light on selection and installation of the instrument. National and International guidelines have been kept in mind while writing the article.
Selection of Instrument
Choosing an instrument appropriate to laboratory functioning is the principal and most imperative task. All available HAs can do Haemoglobin (Hb) estimation, Total leucocyte count (TLC), and platelet count. The other parameters available depend upon the type of instrument: three-part differential cell counter (neutrophils+ lymphocytes + mixed cells), five-part differential cell counter (neutrophils+lymphocytes+monocytes+eosinophils+ basophils), and six-part differential cell counter (neutrophils+lymphocytes+monocytes+eosinophils+basophils cells+immature granulocytes) [1,2].
As per ISO 15189:2012, the end user laboratory should have a documented procedure for selection, purchasing and management of equipment [3,4]. The end user should frame their own suitable policy or standard operating procedure. The selection criteria may include the following [5]:
Environmental factors: space available for the instrument, temperature and humidity conditions, electrical requirements
Technical competency and assessment of the operator
Laboratory throughput
Ease of use of instrument including daily operations and maintenance, availability of reagents
Technical support by the manufacturer
Peer review
Quality assurance
Budget
Installation of Instrument
Once the instrument is selected and bought (or rented) as per selection criteria, the next step is “Installation of instrument”. Before the instrument reaches the laboratory, the manufacturer or its representative shall make a visit and do a preliminary assessment by looking into electrical specifications, space, backup power (online UPS/generator), safety as well as technical capability of the laboratory staff. If the requirements match the manufacturer guidelines, the installation process is initiated which is largely the work of the manufacturer representative but under your supervision. At the time of installation representative performs, documents and provides the following [6]:
Installation Qualification (IQ)
All installation checks have been performed to verify that instrument has been installed with proper connections and utilities [7]. This includes environmental conditions (free from dust, electrical and magnetic interference, temperature, and humidity specification), space, electrical outlets, grounding, UPS connections, stabilizer and other manufacturer conditions.
Operational Qualification (OQ)
By definition, it evaluates the operational features of the instrument for its successful operation in accordance with manufacturer’s instructions [7]. Following features are included in it: Self-test by the representative, calibration, quality control for accuracy, and instrument maintenance. It should be ascertained that these are performed for all possible parameters on the instrument.
Performance Qualification (PQ)
The manufacturer representative using control material(reference)/patient sample verifies the actual functioning or performance of the instrument and will provide a written report of the same [7]. Following parameters shall be included in that report.
Limit of blank or background
Carryover
Imprecision
Linearity
Lower limit of detection
Comparability
Interferences
Following the above, adequate training to the end user laboratory/evaluating laboratory should be provided by the instrument manufacture representative. The training should include principle of measurement, detailed operations with respect to sampling (type and volume including dead volume) maintenance and troubleshooting of the instrument. An instruction manual shall also be provided which covers all these topics in detail. It is essential that training should be documented and records of the same should be maintained [6].
Hence, by the end of installation, following manuals/records must be received from manufacturer:
Purchase order
Operation manual
IQ, OQ, PQ as described above
Safety instruction
Maintenance agreement
Certification of authorization/training by manufacturer representative
Protocols for decontamination and disinfection of the instrument. Specific protocols for disposal of samples processed, waste generated and contamination of spillage should be formed
Material safety data sheet information
Written record of the microbiologic assessment, if applicable
Any other
After this long process, one must not essentially feel relaxed. Giving up the back seat now comes your turn to steer the car.
Verification of Instrument
Before going forward, we will just glance over two confounding terms “Validation” and “Verification”. In simple words, validation is to prove that procedure, process; system, equipment, or method works as per expectations and attains the desired results. Verification on the other hand is defined as abbreviated process to demonstrate that a test performs in substantial compliance to previously established claims by manufacturer [8]. Simplifying, manufacturer will validate and user lab will confirm/verify the claims made by manufacture.
To quench the curiosity, one must understand the need to verify the instrument. Reason is simple, manufacturer performs all the parameters in optimal conditions, in a nonclinical environment, using relatively normal samples [3,4,9]. Hence, to rule out these non-conformities and any other bias, performance characteristics of the analyser must be analysed in an environment where the instrument will be sited and by the routine staff that will be operating it in future. This is dictated by several national and international bodies like CLSI, ICSH and ISO 15189 [3,4,10]. The verification includes checking the same parameters as done by the manufacturer and can be ascribed in three stages: pre-analytical, analytical and post-analytical.
Pre-Analytical Evaluation
This evaluation is of utmost importance as numerous pre-analytical factors may affect the CBC results obtained from analyser. To remove these confounding factors, sample selection criteria must be formed and included in the evaluation process, encompassing the following points [6]:
Blood should be drawn according to the available international guidelines and/or existing local agreements and procedures [3,4]
EDTA samples of adequate volume for which all other laboratory testing is complete and would otherwise have been discarded should be used
One-third to half the total number of samples should be from normal or non-diseased individuals
Sample identity shouldnot be recorded to rule out bias A numerical coding system can be used instead
Processing should be done within 4–8 hours of withdrawal, with the exception of those samples used for the assessment of sample stability to reduce time-dependent alterations (increase in mean corpuscular volume (MCV), mean platelet volume (MPV) [11]
Appropriate sample transport and storage conditions should be there [12]
Samples to be tested should cover the entire clinical reportable range including severely abnormal results (i.e. abnormally high and low TLC, Hb, platelet count)
Samples with possible interfering substances such as lipemia, haemolysis, should be included [6]. Samples with platelet clumps and/or red cell agglutinates detected microscopically should also be included to allow assessment of respective flags. However, samples with visible clots should be excluded.
Analytical Evaluation
Following is a step wise approach to analytical verification. It should be kept in mind that the assessment of performance characteristics discussed below must be done in all sample modes available in the instrument (Figure 1).
Figure 1: Flow Diagram for the process of a new instrument
Accuracy and Comparability
It is closeness of agreement between measurement obtained and true value and represents systematic error [13]. Ideally, it is measured using reference standards/method which is available for only few selected parameters. The alternative approach is that patient samples are run on both the new analyser and an already validated analyser (present in the laboratory or in reference laboratory) [14]. Its assessment can be done by using 40 to 100 samples processed on both instruments on the same day over 8 to 20 days, with specimens reflecting the clinical range. Daily analysis of two to five patient specimens should be followed for at least 8 days if 40 specimens are compared and for 20 days if 100 specimens are compared in replication studies [15]. The comparison between the two analysers is done using linear regression as statistical tool [13]. Further, after verification, Proficiency testing can also provide for a more economical and feasible surrogate for evaluating accuracy. In this multiple samples are sent periodically (usually quarterly) to the enrolled group of laboratories for analysis. The program then compares each laboratory’s results to each other and/or with an assigned value. In India, few of the organizations providing Proficiency testing are ISHTM, CMC Vellore, Biorad, Randox. These programs must also be accredited by national or international bodies.
Precision/Imprecision
Precision is defined as the closeness of agreement between test results when a sample is run repeatedly [13]. It must be established for the full reportable range of each parameter, specifically including samples of medical decision level [6]. It is performed in two ways:
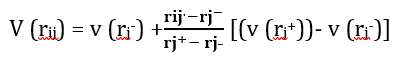
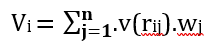
Within-run precision: Three or more samples/controls covering pathological range (including low, high and normal concentration of analyte) are processed ten times consecutively. Standard deviation (SD) and coefficient of variation (CV%) (which actually determine the imprecision) are calculated as follows [6,12]:
(1)
(2)
Between-batch precision: For this, take at least two levels of control pathological range of the analyte. Each level is run in duplicate, with two runs per day for at least five days [5,16]. There should be a minimum of two hours gap between the runs. Then calculate the SD and CV% as described above. As we are verifying the claims of the manufacturer, the resulting imprecision should be compared with what manufacturer has provided in literature
Carry-over
Carry-over is the magnitude to which a measure and value in a sample is likely to be affected by the preceding sample [6,16]. The parameters to be assessed for carry over are Hb, TLC, platelets, reticulocyte and nRBCs. For this, run one sample with high concentration (Sample A: A1, A2, A3) of analyte in triplicate immediately followed by another sample with low analyte concentration (Sample B: B1, B2, B3).
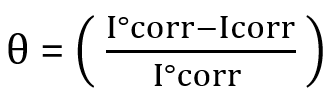
Percentage of the carry-over is calculated by:
(3)
The result is compared with manufacturer’s claims.
Linearity
Although linearity is a basic parameter of validation of HA, this term is not essentially used by international bodies like CLIA. Instead, the term Analytical Measurable Range (AMR) is used. AMRis the range of analyte (for e.g. platelet count) values that is directly measured on a sample without any modification. The manufacturer must provide the AMR and the laboratory needs to verify the claims as described. To assess it, take a sample with high concentration of the analyte. Prepare 10 evenly spaced dilutions (1:1, 1:2, 1:3, 1:4, 1:5, 1:6, 1:7, 1:8, 1:9, 1:10) of a sample having high concentration of analyte, with diluent or AB plasma as instructed by manufacturer. Measure each sample dilution three times. There should be a linear relation between the true analytic concentration and the measured concentration [6,17,18].
Clinically reportable interval (CRI) is the complete range of analyte values which can be measured following modifications such as sample dilution, concentration or any other pre-treatments used to extend the direct analytical measurement range [19].
Background (Limit of Blank, LOB)
It refers to the detectable signal (noise) not originating from the concerned analyte. Any interfering substance, such as blood free reagents or electronic noise may produce background signal. It is estimated by processing a blank sample (sample diluent or as per manufacturer instructions) 10 times and calculating mean and standard deviation [20].
LOB=MeanBlank+1.645(SDBlank )
(4)
Ideally, it should be zero [20].
Lower Limit of Quantitation/Detection (LOD)
It is a measure of the lowest concentration of the analyte that produces a signal which can be reliably distinguished form background signal. It is determined by measuring replicates of a blank sample and sample with known low concentration of analyte (n=20) and calculating mean and standard deviation.
LOD=LOB+1.645(SDlow concentration sample)
(5)
The results are in agreement if they are within 95% agreement to manufacturer’s claimed LOD. Otherwise, the laboratory must establish their own LOD [20].
Reference Range
Reference range for all parameters should be established during instrument evaluation using a minimum of 120 healthy individuals (including both sex, ethnic groups and paediatric population, if possible), taking care of pre-analytical variables. Mean, and SD should be calculated for each group and the reference interval for each parameter is defined from Mean+2SD to Mean-2SD in a normally distributed curve [6,14].
Sample Stability
Various parameters of the CBC show change with time following venesection. To determine these changes, five normal samples and five samples with abnormalities should first be analysed at time zero (or as close as possible to the time of venesection). Following this, samples should be divided into two sets of six aliquots, one set stored at room temperature (recorded) and the other at 4 °C. Further testing should be done after 4, 8, 12, 24, 48 and 72 hours respectively. Hence, the effects of time of storage and temperature are determined by plotting the differences against times of testing [6].
Sensitivity/Specificity of Flagging
Along with determining the efficiency of CBC counts, morphological assessment of the cells should also be done to evaluate the adeptness of flags generated by the analyser. Sensitivity is defined as capability to produce positive results in the presence of abnormality whereas specificity is the ability of the instrument to show negative results when an abnormality is not present. It can be evaluated by performing microscopic 400-cell differential count on random samples. It is suggested that the accuracy of flagging should be gauged for abnormal cells like blast cells, promyelocytes, myelocytes, promonocytes, abnormal / atypical lymphocytes, fragmented red blood cells, platelet clumps, and red blood cell aggregation [6,21].
Specificity:
(6)
Sensitivity:
(7)
Negative Predictive Value:
(8)
Positive Predictive Value:

(9)
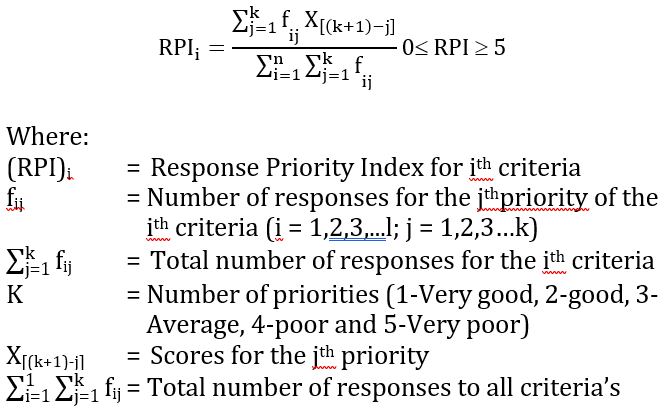
Overall efficiency:

(10)
(TN: True negative, FP: False positive, TP: True positive, FN: False negative)
Post-Analytical Evaluation
Post-analytical evaluation generally includes reporting of the results. For this, the integrity and compatibility of the instrument, including bidirectional interfacing (minimizing typographical errors) and the laboratory/hospital information system must be established and evaluated. The other points that can be evaluated are:
Data storage capacity and speed of retrieval of data
Ease of operations and quality of training provided
Acceptability by the staff
The quality and structure of the report should be thoroughly assessed as it is the mode of communication of the laboratory with the user and reflects on the efficiency and reliability of the laboratory.
Haematology analysers are an integral part of clinical laboratories, used in small, medium and large sized laboratories. Verification of HA is an essential and significant step towards providing best quality of results and reporting. Through this article, an attempt is made by us to provide a simple and practical approach to the process of equipping the laboratory with a HA. Our intention is to help the laboratory professional in this important but arduous task. Flow chart in figure 1 would summarize the requisites explained.
Briggs, C. “Quality counts: new parameters in blood cell counting.” International Journal of Laboratory Hematology, vol. 31, no. 3, 2009, pp. 277–297.
Stephens, L. et al. “Comparison of different small clinical hematology laboratory configurations with focus on remote smear imaging.” Archives of Pathology & Laboratory Medicine, vol. 143, no. 10, 2019, pp. 1234–1245.
International Organization for Standardization. Medical Laboratories – Particular Requirements for Quality and Competence ISO 15189. ISO, 2012.
NABL. NABL 112 – Specific Criteria for Accreditation of Medical Laboratories. ISO 15189. www.nabl-india.org/NABL-112_Issue-3_And-_06.
Chesher, D. “Evaluating assay precision.” Clinical Biochemist Reviews, vol. 29, Suppl. 1, 2008, pp. 23–26.
International Council for Standardization in Haematology Writing Group: C. Briggs et al. “ICSH guidelines for the evaluation of blood cell analysers including those used for differential leucocyte and reticulocyte counting.” International Journal of Laboratory Hematology, vol. 36, no. 6, 2014, pp. 613–627.
Cho, K.H. et al. “Basic principles of the validation for Good Laboratory Practice institutes.” Toxicological Research, vol. 25, no. 1, 2009, pp. 1–8.
World Health Organization. Glossary of Terms for Biological Substances Used for Tests of the Requirements. WHO, 1995.
Verbrugge, S.E. and A. Huisman. “Verification and standardization of blood cell counters for routine clinical laboratory tests.” Clinics in Laboratory Medicine, vol. 35, no. 1, 2015, pp. 183–196.
Rabinovitch, A. et al. Validation, Verification, and Quality Assurance of Automated Hematology Analyzers. H26-A2. Clinical and Laboratory Standards Institute, 2010.
Hedberg, P. and T. Lehto. “Aging stability of complete blood count and white blood cell differential parameters analyzed by Abbott CELL-DYN Sapphire hematology analyzer.” International Journal of Laboratory Hematology, vol. 31, no. 1, 2009, pp. 87–96.
CLSI. Handling, Transport and Storage of Specimens, Quick Guide H18-A3. Clinical and Laboratory Standards Institute, 2007.
Linnet, K. and J.C. Boyd. “Selection and analytical evaluation of methods with statistical techniques.” Tietz Textbook of Clinical Chemistry and Molecular Diagnostics. 7th ed., edited by C.A. Burtis, E.R. Ashwood, and D.E. Bruns, Elsevier Saunders, 2015, p. 12.
Vis, J.Y. and A. Huisman. “Verification of hematology analyzers.” International Journal of Laboratory Hematology, vol. 38, Suppl. 1, 2016, pp. 100–109.
National Committee for Clinical Laboratory Standards. Approved Guideline for Method Comparison and Bias Estimation Using Patient Samples. EP09-A2. NCCLS, 2002.
Broughton, P.M.G. et al. “A revised scheme for the evaluation of automatic instruments for use in clinical chemistry.” Annals of Clinical Biochemistry, vol. 11, nos. 1–6, 1974, pp. 207–218.
Jhang, J.S. et al. “Evaluation of linearity in the clinical laboratory.” Archives of Pathology & Laboratory Medicine, vol. 128, no. 1, 2004, pp. 44–48.
Killeen, A.A. et al. “Verifying performance characteristics of quantitative analytical systems: calibration verification, linearity, and analytical measurement range.” Archives of Pathology & Laboratory Medicine, vol. 138, no. 9, 2014, pp. 1173–1181.
Lo, S.Y. et al. “A roadmap to defining the clinical reportable ranges of chemistry analytes: increasing automation efficiency and decreasing manual dilutions.” Clinica Chimica Acta, vol. 451, 2015, pp. 257–262.
Armbruster, D.A. and T. Pry. “Limit of blank, limit of detection and limit of quantitation.” The Clinical Biochemist Reviews, vol. 29, Suppl. 1, 2008, p. S49.
Koepke, J.A. et al. Reference Leukocyte (WBC) Differential Count (Proportional) and Evaluation of Instrumental Methods. H20-A2. CLSI, 2007.
