
+91 6002993949
submission@iarconsortium.org
Open Access
ISSN (Print) : 2709-9466
ISSN (Online) : 2709-9474
Astroviruses that infect humans are an important cause of gastroenteritis in children. They are classified into 8 classic serotypes named 1 to 8 and some new genotypes that genetically resemble animal viruses more than human viruses. The genome of astroviruses consists of a single strand of RNA of positive polarity; they are non-enveloped viruses, and the viral particle is formed by the viral genome surrounded by a 35 nm icosahedral protein capsid. Different serotypes infect different cell lines with additional efficiency. Susceptibility or resistance to infection may be determined at various levels of the replication cycle, such as attachment to the cell, viral particle internalisation, viral RNA release (uncoating), RNA translation, and genome replication, the assembly and exit of the viral particles to the outside of the cell. In accordance with previous evidence, this work aimed to determine which step or steps of the astrovirus replication cycle determine tropism in different cell lines. It was found that in a population of cells from the Caco-2 cell line infected with astrovirus serotype 8, 95% of the cells in the monolayer can be infected. By cloning subpopulations, we discovered MA104 cell clones with up to ten times lower susceptibility than the parental cell line. Each cell infected with serotypes 1 and 8 produced 143 and 328 infectious viral particles, respectively, in the Caco-2 cell line, while the MA104 cell line produced 34 and 24. The findings of this study suggest that astrovirus tropism is restricted for the MA104 and MDCKII cell lines during entry and in some phases after the release of the viral RNA to the cytosol.
Astroviruses generally have a marked range of hosts and age restrictions. Astrovirus isolates usually cause disease only in the species from which they were obtained, and young animals are more susceptible than adults. Very little information is known about humans' cellular and tissue tropism of astroviruses [1]. However, for the eight classic serotypes, infection is considered limited to the small intestine's enterocytes.
The molecular bases of this tropism are unknown. This is due in part to the fact that genetic studies of HAstV have been limited by the need for an efficient study system [2]. For example, the Caco-2 cell line, despite being considered the best for isolating HAstV from faecal samples and being permissive for different serotypes, has low transferability. In contrast, despite being highly transfectable, BHK-21 cells (newborn Syrian hamster kidney) are barely permissive.
At the cellular level, permissiveness or resistance to infection can be determined at various levels of the replication cycle, such as attachment of the virus to the cell surface, internalization of the viral particle, uncoating of the viral RNA [3], and translation of the genome virus, genome replication and the assembly and release of viral particles.
In vivo, the cellular tropism of viruses is an important determinant in the pathogenesis of viral diseases. Understanding the bases that restrict virus growth in non-permissive cells may help characterize virus replication strategies and host biological functions [4]. This knowledge can be useful in designing prevention and treatment strategies for the disease.
The different human astrovirus serotypes show differences in their ability to infect different cell lines in culture. They generally infect cells derived from humans and apes but not from mammals other than primates. Aguilar-Hernández et al. [5] found that HAstV serotypes 1, 2 and 8 infect Caco-2 cells, with greater efficiency than MA104 and Vero cells, from green monkey kidney epithelium; it also found that dog kidney epithelial cells, MDCKII, are refractory to infection by these three viruses.
In this work, we propose to identify the step(s) of the replication cycle of human astrovirus serotypes 1 and 8 (HAstV-1 and -8) that restricts their tropism in established cell lines and determine the infectivity and production of viral progeny in permissive (Caco-2) and partially permissive (MA104) cells, and select the growth curve of HAstV-8 in Caco-2 and MA104 cells
Cells and Viruses
The Caco-2 cell line (human adenocarcinoma cells), clone C2Bbe1, was grown under a 10% CO2 atmosphere, at 37ºC, in DMEM-HG (Dulbecco's Modified Eagle Medium - High Glucose) medium supplemented with 15% of fetal bovine serum, non-essential amino acids and in a buffer solution [6]. The cell lines MA104 (Thermo Fisher Scientific) and MDCKII (dog kidney epithelial cells) were grown in Advanced DMEM medium (Thermo Scientific) in an environment with 5% CO2 at 37 ºC. The strains of HAstV serotypes 1 and 8 were propagated in Caco-2 cells. The cells were frozen and thawed three times for lysis, and the viral titer was determined in the cell lysate and then stored at -70 °C.
Determination of Viral Titer
The viral titer was determined by an immuno-peroxidase method [7]. Briefly, Caco-2 or MA104 cells were grown in 96-well dishes until a confluent monolayer formed (4-5 x10⁴ cells per well). The monolayer was washed twice with MEM and infected as described for virus propagation, making dilutions of the collected lysate. Cells were fixed with 2.5% formaldehyde solution at room temperature for 20 min and rinsed thrice with PBS after 18 h at 37°C. The cell membrane was then permeabilized for 15 min at room temperature with 0.2% Triton X-100 in PBS. Primary antibodies were generated in rabbits against the virus (α-Yuc8, diluted 1:2,000) or the viral spike (α-spike 1, diluted 1:1,000) and washed the cells were three times with PBS [8]; a secondary antibody (anti-rabbit coupled to peroxidase, 1:3000) was added to detect the primary. The primary antibody was incubated overnight at 4 °C and the secondary antibody for 2 h at 37 °C before three PBS washes. Add the peroxidase substrate (5 mL 0.5 N acetate buffer, 1.5 mL carbazole, 10 µL hydrogen peroxide), wash with water, observe colouration, and count focus-forming units (ugh) on an inverted microscope (Nikon, Japan).
Viral Performance
Multiples of infection (MOI) of 0.002, 0.004, 0.008, 0.016, 0.032, and 0.064 pfu/cell were given to 4-5 x10⁴ Caco-2 and MA104 cells. After 18 hours at 37°C, infected cells were killed by being frozen and thawed three times, and the viral titer was measured.
Immunofluorescence Assay
Confluent MA104 and Caco-2 cells grown on glass coverslips (1.3 x10⁵ cells per coverslip) were infected at different MOIs (0.019, 0.039, 0.078, 0.156, 0.312, 0.625, 1.25, 2.5 and 5 uff/cell). The cells were permeabilized for 15 minutes with 0.5% Triton X-100 (Sigma) in blocking solution (1%), then fixed for 20 minutes at room temperature with 2% paraformaldehyde (Sigma) in PBS. BSA in 50 mM NH4Cl phosphate-buffered saline. Primary antibody dilution in blocking solution was applied to cells for 12 hours at 4°C. Cells were washed three times after 5 minutes in 50 mM PBS-NH4Cl. The cells were then incubated with 1:1000 Alexa 488-conjugated anti-rabbit secondary antibody in a blocking solution for 1 h at room temperature. Final step: 30 nM DAPI (4',6-diamidino-2- phenylindole, Invitrogen, USA) was applied to the monolayer for 30 minutes. Photographing the coverslips on Citifluor AF1 slides with an epifluorescence microscope with a digital camera (Photometrics Cool Snap HQ) was possible.
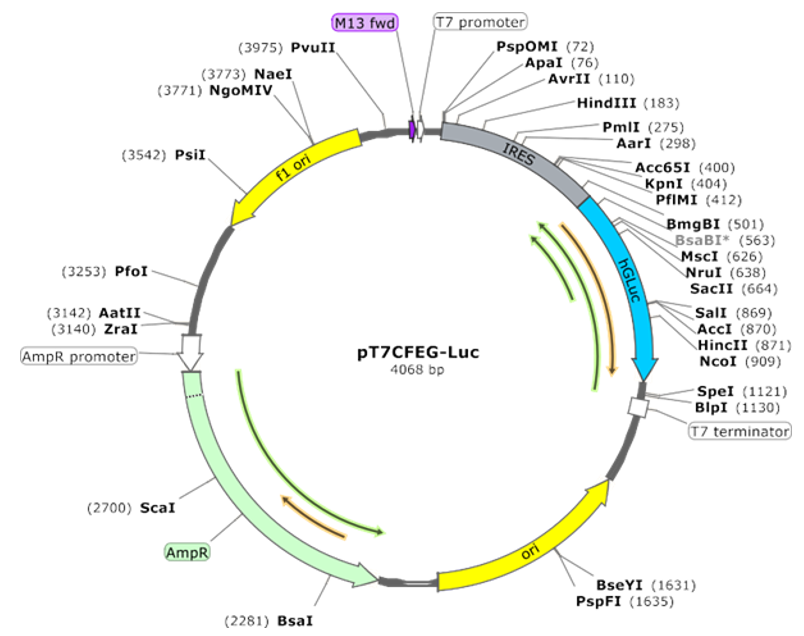
Figure 1: Map of plasmid pT7CFEG-Luc.
Concentration and Purification of Viral Particles
Confluent monolayers of Caco-2 cells, clone C2Bbe1, in 150 cm2 flasks were infected at an MOI of 3 with HAstV-1 and -8 for 18 h, as previously described. The methodology described by Aguilar-Hernández et al. [5] was followed for the purification of the viruses. The pelleted particles were resuspended in 500 µL of TNE buffer (50 mM Tris-HCl, pH 7.4, NaCl 0.1 M, 10 mM EDTA) to obtain concentrated virus (used in immunofluorescence assays and single-cycle growth curves).
Single Cycle Growth Kinetics
A 96-well plate infected it with an MOI of 3 pfu/cell. At different hours post-infection (HPI) (0, 3, 6, 9, 12, 15, 18 and 24 hours), the supernatant was removed and the cells were harvested. The cells and supernatant were frozen and thawed three times; the total lysate was activated with 200 µg/mL trypsin at 37 ºC for 1 h in an environment with 5% CO2 and the viral titer was determined at different times.
Viral RNA Extraction
An MOI of 3 was used to infect a single layer of Caco-2 cells. After 18 hours, the supernatant was thrown away and 300 L of triazole (ThermoFisher) was added for every 105-107 cells. After mixing with a pipette, the cells were put into an Eppendorf tube and left for 5 minutes at room temperature, and then 200 L of chloroform per 1 mL of triazole was added. It was left to sit at room temperature for 2 to 3 minutes and then spun at 12,000 xg for 15 minutes at 4°C. The watery phase was then taken out. At the start of the extraction process, 1 mL of triazole was mixed with 500 L of isopropanol. The sample was then spun for 10 minutes at 12,000 x g at 4 °C. The supernatant was discarded, and the pellet was gently washed with cold 75% ethanol. Once the pellet was dry, it was resuspended in RNase-free water, treated with DNAse (ThermoFisher) according to the manufacturer's directions, and kept at 70 °C.’
In vitro Transcription of Plasmid pT7CFEG-Luc
The plasmid pT7CFEG-Luc (Figure 1) was transcribed according to the manufacturer's instructions using the MEGAscript® kit (Life Technologies) to obtain the mRNA that codes for the luciferase protein.
Transfection
A mixture of lipofectamine 2000 (ThermoFisher) was made in MEM (2 μl oligofectamine per 100 μl MEM) and incubated at 37 °C for 10 min. 800 ng of in vitro transcribed RNAGLuc or viral RNA was added to the mixture, and it was allowed to rest for 20 min at 37 °C. 100 µL of the mixture was added to a monolayer at 60-80% confluency in a 48-well plate (1.3 x10⁵ Caco-2, MA104, MDCKII cells/well) [9]. After 6 h, the medium was changed to DMEM-HG supplemented with 15% fetal bovine serum. Cells transfected with viral RNA were collected 24 hours after transfection, along with the supernatants, to determine the viral titer.
Luciferase Detection
The supernatants containing the luciferase synthesized from the pT7CFEG-Luc plasmid and then excreted into the medium were collected. This was detected according to the manufacturer's instructions using the BioLux® Gaussia Luciferase kit (New England).
Cloning of MA104 Cells
An alternative method to isolate individual clones was using cloning cylinders [10]. The colonies are isolated by removing them with the help of a 3 mm diameter sterile filter paper soaked in 0.025% trypsin. Each isolated colony is transferred to a well of a 24-well plate and allowed to grow under the abovementioned conditions until confluency is reached. Once confluence is observed in the wells, the cloned cells are spread over larger areas for further characterization.
In this work, we set out to identify the step(s) of the replication cycle of human astrovirus serotypes 1 (HAstV-1) and 8 (HAstV-8) that restrict their tropism in established cell lines. One of these lines is MA104, which is partially permissive to infection since it produces a viral titer 3 logs lower than in Caco-2 cells, which represents the gold standard for astrovirus replication. Two possibilities exist for the lower viral yield observed in this cell line. The first is that 100% of the MA104 cell population is being infected, but that the virus yield per cell is lower than in Caco-2 and the second is that only a subpopulation of MA104 cells can be infected.
Permissive Caco-2 cells produce greater amounts of HAstV-1 and HAstV-8 viral progeny than partially permissive MA104 cells. To discern these two possibilities, we first determined whether the amount of infectious viral particles produced in each Caco cell -2 is the same as that obtained in MA104 cells. If this is the case, this would suggest that virus replication is unaffected in MA104 cells compared to Caco-2.
To do this, the Caco-2 and MA104 cell lines were infected at different MOIs (0.002, 0.004, 0.008, 0.016, 0.032, 0.064 PFU/cell). At 18 h post-infection, the cells were lysed by freezing/thawing, and the amount of infectious virus produced was titrated with the procedure indicated above for Caco-2 cells. An infection was carried out at the same time as the MOIs indicated above to ensure that the number of infected cells was correct. At 18 h post-infection, these were stained by the immuno-peroxidase method and the number of cells that were originally infected was counted, this allowed us to relate the number of infectious viral particles produced by each infected cell.
After performing three biological replicates with two technical replicates each (Table 1), it was found that in Caco-2 cells, 143 and 328 viruses are produced per infected cell for serotypes 1 and 8, respectively. A lower yield was obtained for MA104 cells, with only 34 and 24 infectious particles per infected cell for serotypes 1 and 8, respectively. Thus, for HAstV-1, the viral progeny produced in Caco-2 is 4 times greater than in MA104, while in HAstV-8, this difference is 13 times (Figure 2).
Table 1: Infectious HAstV particles produced by different cell lines at 18 HPI
Parameters | Infectious particles per infected cell | Max |
Cell lines | HAstV-1 | HAstV-8 |
Caco-2 | 143±16 | 328 ± 41 |
MA104 | 34 ± 10 | 24 ± 3 |
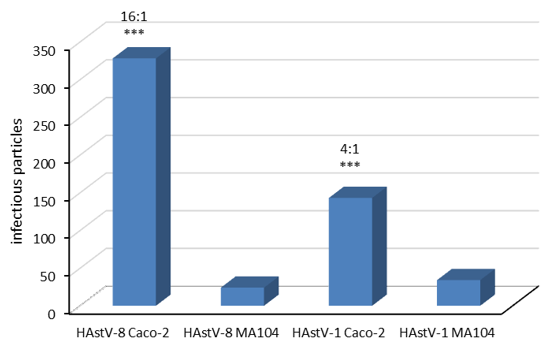
Figure 2: The production of infectious particles is lower in MA104 cells at 18 hpi.
The determination was carried out by immuno-peroxidase assays in which the number of infected cells and the virus produced by these infected cells were determined to relate both values. Data are expressed as infectious particles per infected cell with the standard error of the mean.
These results suggest that the permissiveness of the virus in MA104 cells is limited in some steps of the replication cycle after entry since once it infects the cell, its yield is notably lower in MA104 cells compared to Caco-2 cells.
The determination was carried out by immuno-peroxidase assays in which the number of infected cells and the virus produced by these infected cells were determined to relate both values. Data are expressed as infectious particles per infected cell; bars represent the standard error of the mean of three independent assays (n = 3). The ratio of contagious particles Caco-2 cells: MA104 cells is noted. Data were analysed using GraphPad Prism by a Mann-Whitney test; ***p<0.0001.
Unlike Caco-2 cells, only a fraction of MA104 cells is permissive to infection. As a next aspect in characterizing the cellular tropism of HAstV, it was decided to determine whether 100% of Caco-2 and MA104 cells within a population are infectable. To achieve the above, increasing amounts of virus were added to Caco-2 and MA104 monolayers and the percentage of infected cells was determined by the immunofluorescence method. In these assays (Figure 3), individual cells were identified by staining the cell nuclei with DAPI and infected cells with an antibody that recognizes the structural proteins of the virus (α-spike 1 and α-spike 8). The percentage of infected cells was determined at different increasing MOIs: 0.019, 0.039, 0.078, 0.156, 0.312, 0.625, 1.25, 2.5 and 5 uff/cell.
At each multiplicity evaluated, photographs of 6 random fields were taken, with a 20X objective for both cell lines. The images were processed in the ImageJ program (National Institutes of Health) and from these images, the number of total cells (marked in blue) and infected cells (marked in red) were counted to determine an average percentage value of infected cells to the different MOI evaluated.
By infecting Caco-2 cells with HAstV-1 at increasing MOI (0.002, 0.004, 0.008, 0.016, 0.032, 0.064, 0.128, 0.256, 0.512, 1.024, 2.048, 4.096 pfu/cell), it was observed that as the MOI increased the virus concentration increases the number of infected cells (Figure 3). When comparing serotypes 1 and 8, the same effect was observed; the infected Caco-2 cells increased as a greater amount of virus was added (Figure 4a and b) until there were almost 100% infected cells.
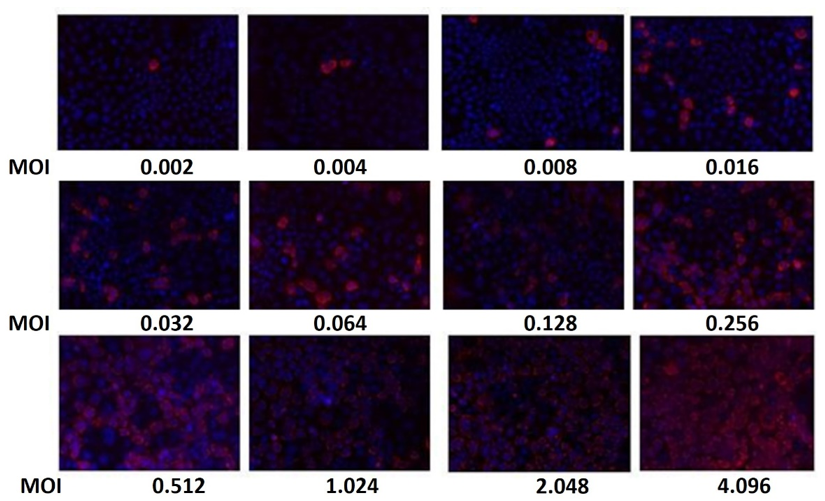
Figure 3: The percentage of infected Caco-2 cells increases as the MOI of HAstV-1 increases at 18 HPI
The percentage of infected Caco-2 cells increases as the MOI of HAstV-1 increases at 18 HPI. Using immunofluorescence assays, the cells were identified by staining the cell nuclei with DAPI, and the infected cells were identified with an antibody that recognizes the structural proteins of the virus (α-HAstV-1), as described in the materials and materials section. methods. MOI values are given in uff/cell. (See Figure 4). Samples were visualized on an epifluorescence microscope (see Materials and Methods) with a 20X objective.
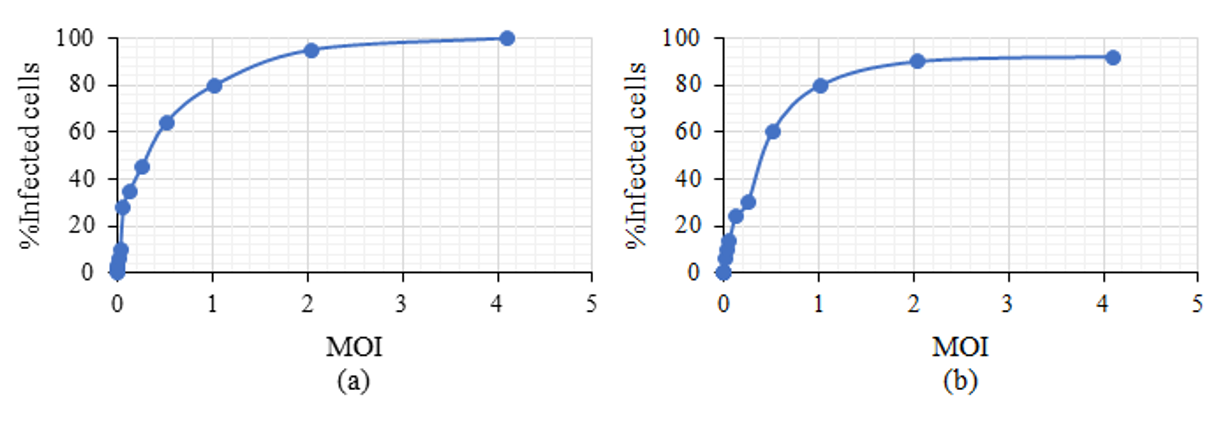
Figure 4: The percentage of infected Caco-2 cells increases proportionally to the MOI in HAstV-1 (a) and HAstV-8 (b) at 18 HPI. 1.3x10⁵ cells were infected on glass coverslips at increasing MOIs
The percentage of infected Caco-2 cells increases proportionally to the MOI in HAstV-1 (a) and HAstV-8 (b) at 18 HPI. 1.3x10⁵ cells were infected on glass coverslips at increasing MOIs. Cells were identified by staining cell nuclei with DAPI and infected cells with an antibody that recognizes the structural proteins of the virus (α-HAstV-1 and α-Yuc8), as described in the materials and methods section. For each MOI, 200-300 cells were counted per field from 6 fields taken at random, with a 20X objective. The images were processed in ImageJ (National Institutes of Health), and the percentage of infected cells was determined. Data are expressed as a percentage of infected cells relative to the MOI of infection, bars represent the standard error of the mean of two independent assays (n = 2).
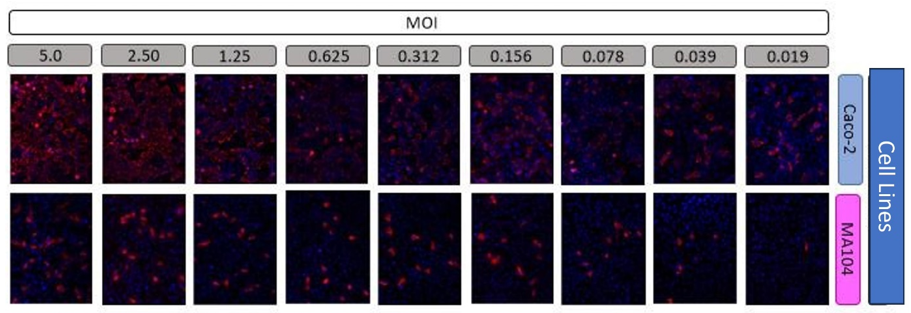
Figure 5: The pattern of infected MA104 cells behaves differently than that of the Caco-2 cell line when infected at increasing MOI with HAstV-8 at 18 HPI
Since the behaviour is similar for both viruses, we observed the behaviour in the MA104 cell line only for serotype 8. As mentioned above, in the Caco-2 cell line clones C2Bbe1, the vast majority of the cells can be infected by HAstV-8 and therefore said line is infected quite homogeneously. In contrast, the MA104 cell line showed quite an unusual infection pattern (Figure 5); at low infection multiplicities, it seems to increase the percentage of infected cells linearly; however, when reaching approximately 10% of infected cells, the increase stops and remains almost constant (Figure 6 and Table 3).
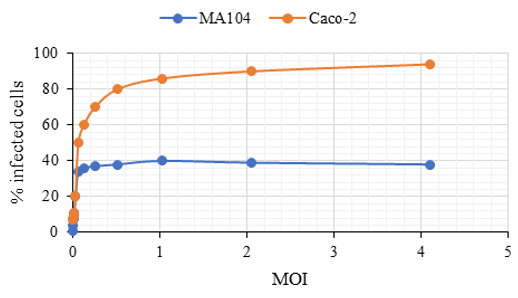
Figure 6: The percentage of MA104 cells infected with HAstV-8 is lower than in Caco-2 cells at 18 hpi.
The pattern of infected MA104 cells behaves differently than that of the Caco-2 cell line when infected at increasing MOI with HAstV-8 at 18 HPI. Using immunofluorescence assays, cells were identified by staining cell nuclei with DAPI and infected cells with an antibody that recognizes the structural proteins of the virus (α-Yuc8), as described in the materials and methods section. MOI values are given in uff/cell. (Figure 5). Samples were visualized on an epifluorescence microscope (see Materials and Methods) with a 20X objective.
The percentage of MA104 cells infected with HAstV-8 is lower than in Caco-2 cells at 18 HPI. 1.3x10⁵ cells were infected on glass coverslips at increasing MOIs (0.019, 0.039, 0.078, 0.156, 0.312, 0.625, 1.25, 2.5 and 5 pfu/cell). Cells were identified by staining cell nuclei with DAPI, and infected cells with an antibody that recognizes the structural proteins of the virus (α-Yuc8). For each MOI, 200-300 cells were counted per field from 6 fields taken at random, with a 20X objective. The images were processed in ImageJ, and the percentage of infected cells was determined. Data are expressed as a percentage of infected cells relative to the MOI of infection; bars represent the standard error of the mean of two independent assays (n = 2).
Only a percentage of MA104 cells are permissive to infection by astrovirus serotypes -1 and -8. The data suggest that the MA104 cell line is heterogeneous to infection (unlike the Caco-2 cell line) since even infecting at an MOI of 5, in which we would expect more than 99% of the cells to be infected, on average, only 13% of the total cell population can be infected with HAstV-8. Only a percentage of MA104 cells are permissive to infection by astrovirus serotypes -1 and -8. When evaluating the results that determine that the MA104 cell line is heterogeneous to infection and that only approximately 13% of the cells can be infected, a possible error was considered when determining the viral titer in the cells mentioned above, calculated based on a single dilution of the virus. Therefore, the HAstV-1 and HAstV-8 (Yuc-8) viruses were concentrated, and the viral titer was determined, including several dilutions. The titer was determined by the immuno-peroxidase method (see Materials and Methods) and the dilution of the virus vs. the viral titer for each dilution (Figure 7).
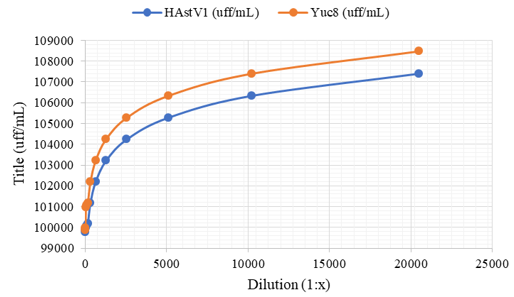
Figure 7: Only a percentage of MA104 cells are permissive to infection by astrovirus serotypes -1 and -8
Figure 7 shows that from the concentrated virus, serial double dilutions 1:x (x = 10, 20, 40, 80, 160, 320, 640, 1280, 2560, 5120, 10240 and 20480) were carried out with which a plate of 96 wells with MA104 cells, and then detect the cells that were infected by the immuno-peroxidase method. The viral titer is changeable when the virus is concentrated, while once it has been diluted several times (after the arrow, dil 1:640), the viral titer remains constant. Titer data are expressed as focus-forming units per millilitre (pfu/mL), and bars represent the standard error of the mean of two independent assays (n = 2).
The experiment showed an unexpected pattern since the viral titer should remain constant throughout the graph, however, as we can see, at high concentrations (less diluted), the viral titer for both viruses increase (it should remain constant since it is of the same virus sample), it is from the 1:640 dilution onwards where the viral titer is conserved as the virus is diluted.
In other words, although the virus is concentrated, a maximum number of MA104 cells infected with both serotypes (HAstV-1 and -8) is observed, for this reason, one must be very cautious when determining the viral titer in these cells. Possible errors in previous experiments could have occurred by not considering this characteristic of the infection of the MA104 cells since the viral titer calculated based on low dilutions gave different titers for each of them incorrectly. Therefore, for both serotypes (HAstV-1 and -8) MA104 cells appear heterogeneous to infection since only a low percentage of them can be infected.
The MA104 cell culture is made up of different subpopulations depending on their permissiveness towards astroviruses. In this work, it was decided to evaluate the possibility of obtaining cloned populations of MA104 cells that had different susceptibility to be infected by HAstV. Cells were cloned with the method described above to analyse whether the other cloned cells present a different susceptibility pattern to astrovirus infection.
The cloned cells were infected at an MOI of 2.5, a multiplicity that allows us to see the “maximum” percentage of infected cells without using a large amount of virus (see Figure 5) and the percentage of infected cells was determined again by the immunofluorescence method (Figure 9) infected cells (Figure 8).
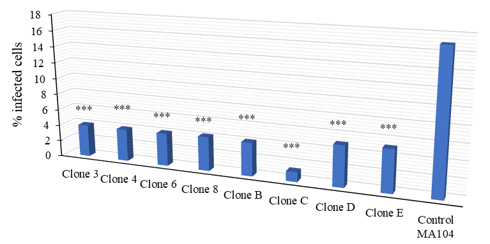
Figure 8: The infection percentage of the MA104 clones is up to 10 times lower than the parental cell line
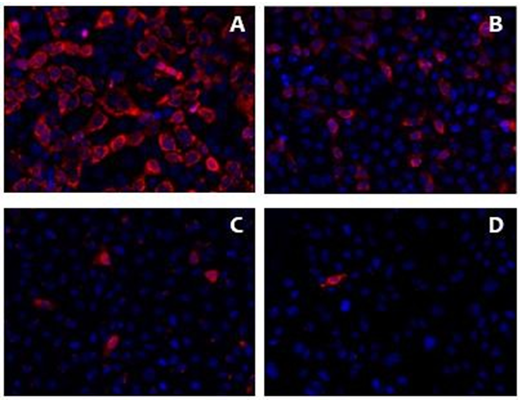
Figure 9: Clones obtained from MA104 infected with HAstV-8 are less infected than Caco-2 cells and the parental MA104 cell line, 18 HPI
The infection percentage of the MA104 clones is up to 10 times lower than the parental cell line. 1.3x10⁵ cells on glass coverslips were infected at MOI of 2.5 pfu/cell of HAstV-8, until 18 HPI. Cells were identified by staining cell nuclei with DAPI, and infected cells were identified with an antibody that recognizes the structural proteins of the virus (α-Yuc8), as described in the materials and methods section. 6 fields were taken at random, with a 20X objective, the images were processed in ImageJ (National Institutes of Health) and the percentage of infected cells was determined. Data are expressed as a percentage of infected cells; bars represent the standard error of the mean of two independent assays (n = 2). They were analysed by an ANOVA test (analysis of variance); ***p<0.0001.
Clones obtained from MA104 infected with HAstV-8 are less infected than Caco-2 cells and the parental MA104 cell line, 18 HPI. The different cell lines were infected at MOI 2.5 uff/cell and the percentage of infected cells was detected by immunofluorescence assays. Cell nuclei are shown in blue, and infected cells (marked by the viral capsid proteins α-Yuc8) are shown in red. A) Caco-2 cell line. B) MA104 cell line. C) Clone 4. D) Clone C. The samples were visualized in an epifluorescence microscope (see Materials and Methods) with a 20X objective.
The results suggest that the MA104 cell line is made up of at least two subpopulations with different susceptibility to HAstV infection. In this work, various clones with low permissiveness could be isolated. However, no clone with high permissiveness could be isolated. The most interesting results are observed in clone C, where the difference in the percentage of infected cells is approximately 10 times. It would be interesting to isolate new clones from clone C and analyse whether a clone of MA104 cells that is completely refractory to astrovirus infection can be obtained.
HAstV-8 single-cycle growth curve is delayed early in the MA104 cell line. To identify if any stage during the astrovirus serotype 8 replication cycle is delayed in the partially permissive cell line, a single cycle growth curve was carried out in the Caco-2 and MA104 cell lines, in the that 5x10⁴ cells were infected with an MOI of 3. Cells and supernatant were collected at different hours post-infection (0, 3, 6, 9, 12, 15, 18 and 24 HPI), frozen and thawed three times to lyse cells and the viral titer was determined at different times.
In the Caco-2 cell line, the graph shows the stages normally established in a growth curve (Figure 10). An eclipse phase lasts 7 h, in which no infectious virus is recovered because the viral particles have released their genetic material to begin their replication and translation. The small amount of infectious virus detected is probably virus adsorbed to the cell surface, whose genetic material has not been stripped (decapitated). Subsequently, the burst phase follows, from 7 to 15 HPI, where the intracellular virus begins to increase, and large quantities of viral particles are produced and released. Finally, in the stationary phase, during this stage, virus production stops from 3 to 24 h (shown as a plateau in the graph). During this period, cells become metabolically and structurally incapable of supporting replication [11].
For the MA104 cell line, these phases could be observed with more difficulty. Infection was carried out at an MOI of three, and the infection was carried out at different times to remove cells and supernatant at 0, 3, 6, 9, 12, 15, 18 and 24 hours post-infection (HPI)(table 2). Once removed, cells and supernatant were lysed and titrated. When comparing both results, it was observed that for the MA104 cell line, there is a delay in the initial stage of the infection cycle of 3 h, probably during virus internalization and RNA release. After this time, the trend of the result is the same for both cell lines (eclipse, explosion and stationary phase), although the beginning of the explosion phase in MA104 cells is also delayed 3 h concerning Caco-2 (12 h in MA104 vs 9 h in Caco-2). This was expected based on the virus internalization/ uncoating delay in MA104. Infection was carried out at an MOI of three and said the disease was carried out at different times, to remove cells and supernatant at 0-, 3-, 6-, 9-, 12-, 15-, 18- and 24-hours post-infection (HPI). Once removed, cells and supernatant were lysed and titrated. The graphs show a similar trend after clearing the initial three-hour delay from the infection cycle in MA104 cells. The data are expressed as focus-forming units per millilitre (pfu/mL), and the bars represent the standard error of the mean of two independent assays (n = 2).
Table 2: Single cycle growth curve of HAstV-8. Average values of viral titers at different hours post-infection (HPI) from two independent trials (n = 2)
HPI | CACO-2 (uff/mL) | MA104 (uff/mL) |
0 | 4.55E+05 | 2.91E+06 |
3 | 2.50E+05 | 3.23E+06 |
6 | 2.06E+05 | 1.38E+06 |
9 | 1.00E+06 | 1.14E+06 |
12 | 1.90E+07 | 2.65E+06 |
15 | 5.95E+07 | 5.52E+06 |
18 | 7.51E+07 | 7.26E+06 |
24 | 1.06E+08 | 6.20E+06 |
Figure 10 depicts the growth curve of HAstV-8 in Caco-2 cells. Infection was carried out at an MOI of three, and the disease was carried out at different times to remove cells and supernatant at 0, 3, 6, 9, 12, 15, 18 and 24 HPI. Once removed, cells and supernatant were lysed and titrated. The graph shows the characteristic stages of a single-cycle growth curve: eclipse period, explosion, and a stationary phase. The data are expressed as focus-forming units per millilitre (uff/mL). Bars represent the standard error of the mean of two independent trials (n = 2) and were analysed.
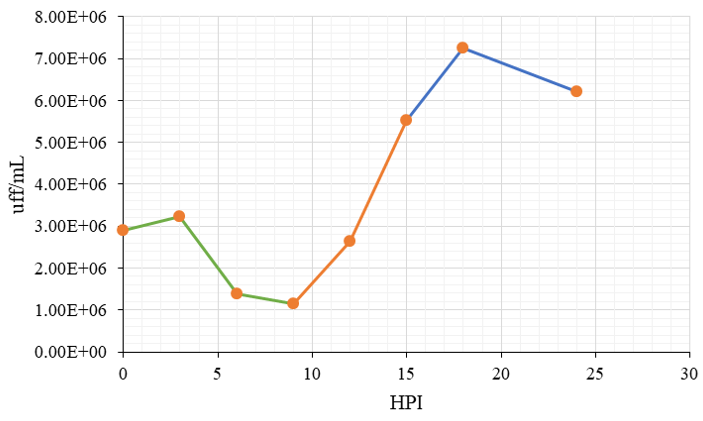
Figure 10: Growth curve of HAstV-8 in Caco-2 cells. Infection was carried out at an MOI of three and the disease was carried out at different times to remove cells and supernatant at 0, 3, 6, 9, 12, 15, 18 and 24 HPI
Finally, it was noted that despite infecting at the same multiplicity of infection (MOI = 3), time zero in the MA104 cell line showed more virus than that of the Caco-2 cells; this is because to achieve this diversity in MA104 cells, a greater amount of virus is required since they are less permissive than the Caco-2 cell line, in which all the lysates obtained are titrated; We now know that only approximately 13% of cells can be infected and it would be enough to infect with an MOI of 0.14 to infect all permissive cells. That is, infecting at an MOI of 3 is a "waste" of the virus since with this MOI more than 95% of the cells should be infected, according to the "Poisson distribution" (see Table 3), and only infects approximately 13%.
In MDCKII and MA104 cells, astrovirus infection is limited both during entry and at a stage after RNA release. In the laboratory, Aguilar-Hernández observed that MDCKII cells (dog kidney epithelial cells) are refractory to infection; they do not become infected. Furthermore, it is known that the astrovirus genome is a single strand of RNA of positive polarity, so it can initiate the virus replication cycle if it is introduced into the cellular cytosol by transfection. In this way, to evaluate whether the factors that determine tropism in MDCKII and MA104 cells are found in the adhesion, entry and/or undressing of the virus and not in a later step during replication, 200 ng of viral RNA obtained were transfected of cells infected with HAstV-8. At 48 h post-transfection, the cells were lysed by freeze-thawing, and the amount of infectious virus produced was titrated with the procedure indicated above for Caco-2 cells. At the same time, an identical transfection was carried out, but at 48 h post-transfection the cells were stained by the immuno-peroxidase method and the number of cells positive for viral antigen was counted.
To normalize the transfection efficiency in the different cell lines, in-vitro transcribed RNA was transfected, encoding a luciferase that is secreted and can be detected in the supernatant. To report this value, the relative light units (RLUs) detected in untransfected cells were subtracted from the RLUs measured 48 h after being transfected with the in-vitro transcribed RNA that codes for luciferase.
More URLs were detected in Caco-2 cells, followed by MDCKII cells and MA104 cells (Table 3). When titrating the viral progeny produced in the three cell lines after transfection of the viral RNA, a difference of one logarithm was observed between the Caco-2 cell line and MA104, the latter with the lowest yield; For the MDCKII cell line, only one or two infectious foci could be counted during the virus titration and a result of only 7 total PFU was obtained (Table 3).
Considering the value of luciferase activity as transfection efficiency, two things are observed: first, that the Caco-2 cells are transfected better than the other two and produce a greater amount of viral progeny, and second, that although the MA104 cells are transfected in a similar way to the MDCKII, in the MA104 cells it was possible to recover a greater number of viruses.
Average values of the relative light units (RLU) detected at 48 h post-transfection to normalize the transfection efficiency; average viral titers of the progeny collected at 48 h post-transfection; the total viral titer of the transfected cells. Infectious particles per transfected cell were determined by relating the viral progeny produced and the number of cells transfected with the HAstV-8 viral RNA detected with the immuno-peroxidase assay.
Detection of the viral capsid protein in MDCKII cells is shown in Figure 11. Three MDCKII cells are shown in which viral antigen was detected after being transfected with 200 ng of HAstV-8 viral RNA at 48 h post-transfection. The samples were visualized in a bright field microscope with a 20X objective.
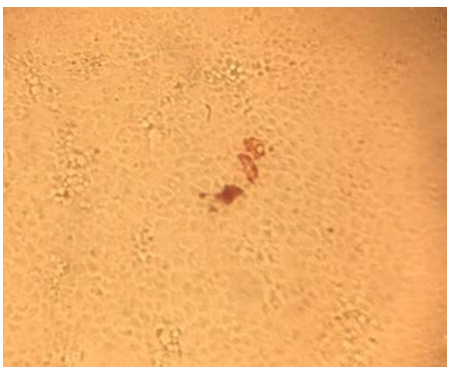
Figure 11: Detection of the viral capsid protein in MDCKII cells. Three MDCKII cells are shown in which viral antigen was detected after being transfected with 200 ng of HAstV-8 viral RNA at 48 h post-transfection. The samples were visualized in a bright field microscope with a 20X objective
The number of transfected cells was related to the viral progeny to obtain the number of infectious particles per transfected cell (Table 3). The maximum number of infectious particles per transfected cell was three for the Caco-2 cell line, one for the MA104 cell line, and zero for the MDCKII cell line.
With the results of the MA104 cell line, the data previously obtained in the experiment of infectious particles per infected cell are corroborated (Table 2), strongly suggesting that in addition to the entry (as observed in the growth curves), the permissiveness of astroviruses in MA104 cells is limited in some step of the replication cycle after this since, in addition to having a lower yield after infecting the cells, there is also a lower yield compared to Caco-2 cells when transfecting viral RNA and evading early stages of infection.
Table 3: Amount of infectious particles when transfecting viral RNA in different cell lines.
Cell | Luc Detection (URL) | Viral Progeny (uff total) | Transfected cells positive for viral antigen (total) | Infectious particles per transfected cell |
Caco-2 | 98100 | 2510 | 956 | 3 |
MA104 | 26300 | 427 | 460 | 1 |
MDCKII | 34000 | 7.33 | 23.3 | 0 |
As mentioned, MDCKII cells are not permissive to astrovirus infection, but by transfecting them with viral RNA (and thus evading entry), a few transfected cells could be observed in which structural proteins were detected with the primary antibody α- Yuc8 (Figure 9). This implies that MDCKII cells can carry out virus replication if the cycle begins by introducing the viral genome to the cytosol. However, the image of the viral RNA occurs in an extremely inefficient manner (only 7 uff were detected in progeny), which would suggest that, in addition to there being a limitation during virus entry, as for the MA104 cell line, in the MDCKII cell line astrovirus tropism is limited in some step of post-entry replication.
In the three cell lines, it was observed that the production of infectious viral particles per transfected cell is very low compared to the yield obtained when infecting the same cells (Table 1, Figure 2); Barreau et al. [12] conclude that when transfecting RNA using liposomes, such a large proportion of “unused” RNA molecules can become toxic to cells or trigger a response that can change metabolism [12]. In our case, RNA isolated from infected cells was transfected; the transfected RNA contained viral and cellular genetic material. This could have affected the production of infectious particles for the reasons mentioned.
Another possible explanation for the reduction of infectious particles per transfected cell is that the RNA, when introduced into the cell through a different route than the one it regularly uses during an infection process, does not allow efficient replication, and few particles are produced infectious. On the other hand, it has been reported that approximately 17% of the total RNA (viral + cellular) obtained from infected cells is sub-genomic [13], a portion that could give rise to a detectable number of structural proteins, without the viral genome is necessarily replicating. In this way, the number of cells replicating viruses could be overestimated; therefore, the viral yield per transfected cell could be very low.
Data The predisposition of a virus to invade and replicate in a particular type of cells is known as tropism. One of the determinants of tropism is the receptors. However, the production of the receptor in a cell type does not ensure that virus reproduction can occur. For its part, the host range of a virus is defined as the ability to infect a particular animal or cell culture [14].
In vivo, astroviruses have a wide host range; the species susceptible to astrovirus infection have expanded to 80 species, including domestic and wild animals, birds and mammals [15]. a group with high genetic variability, and there are more and more reports with evidence of recombination events. These characteristics make them candidates for host species crossing events and, as a consequence, the adaptation of the virus to new hosts. These species crossing events are a possible explanation for the appearance of HAstV-MLB (Melbourne), which is more similar to rat astroviruses than to human ones, and HAstV-VA (Virginia), closely related to ovine and mink astroviruses. In humans, MLB and VA1 astroviruses have been found in the faeces of individuals with diarrhoea, and they have also been associated with causing infections in the central nervous system (CNS) in immunocompromised individuals, which suggests that HAstV could pass from the gastrointestinal tract to other tissues and organs.
On the other hand, the ability of HAstVs to infect different cell lines is different for each serotype. Still, in general, cells derived from humans and apes (Caco-2, T84, HT-29, MA104) show successful propagation, and the different primates are not capable of sustaining infection [16]. The general objective of this work was to characterize the steps in the replication cycle of human astrovirus serotypes 1 and 8 (HAstV-1 and HAstV-8) that determine their tropism in cell lines of different origins.
The cell lines used were Caco-2, from a human colon carcinoma; the C2Bbe1 clone was used, a clone derived from Caco-2 cells selected based on its apical morphological homogeneity, comparable with the human colon. They can form a polarized monolayer with an apical brush border (Bb), grow slowly and are more stable in the long term than other Caco-2 cells [17]; MA104, cells derived from the green monkey kidney epithelium, highly susceptible to Simian rotavirus SA11 and in which Aguilar-Hernández [18], found that they are infected 1000 times less than Caco-2 cells; and MDCKII, isolated from the parental cell line MDCK (NBL-2), from dog kidney, present low TER values and contain Claudin-2 (unlike MDCKI that present high TER values and do not present the tight junction Claudin-2) mentions that they cannot establish an infection.
The Caco-2 cell line comes from the human intestine (the target cell type in the natural environment), so it represents the gold standard for replicating HAstVs. It is not surprising that in this cell line, the HAstVs replicate more efficiently, producing more infectious particles per infected cell than the other two cell lines. MA104 cells have 4 and 13 times less viral progeny for serotypes -1 and -8, respectively, than Caco-2 cells. This indicates that some step after entry is limiting tropism in MA104 cells. This type of publication on the different replication efficiencies of a virus in other cell lines is common; it has been reported for viruses such as dengue, rotavirus, influenza, hepatitis C and Zika. With this type of study, it has been possible to identify host factors that are present (or absent) and that block the production of viral particles. Zika has been marked as the beginning of elucidating why only the Asian strain and not the African strain causes microencephaly and in addition, target antiviral agents have been determined during the entry of the virus [19].
It has been reported that HAstV-1 replication is sensitive to interferon, so factors associated with the innate immune response may interfere with astrovirus infectivity in different cell lines.
This difference may also be due to some characteristics of the cell cycle; it has been observed that different viruses interact with cell cycle components to subvert cellular function and increase replication efficiency. Most studies [20] have been conducted with DNA viruses and retroviruses since their replication occurs in the nucleus. However, it has been shown that in RNA viruses, the cell cycle may also be important, such as in the case of the coxsackie virus. Feuer et al. [21], have shown that cells with the cell cycle in G1 or G1/S produce higher levels of infectious particles and viral polyproteins compared to cells in the G0 phase or blocked cells in the G2/M phase.
Immunofluorescence assays determined the percentage of Caco-2 and MA104 cells that can be infected. In viruses such as dengue, cells of the same lineage, for example, epithelial, can be infected in greater or lesser quantities at the same MOI [22]. For astroviruses, it was observed that in a monolayer of Caco-2 cells infected at MOI 5 with HAstV-8, a maximum of 92% of the cells can be infected, while for the MA104 cell line, on average, approximately 13% of the cells. This means that the MA104 cell line is heterogeneous to infection since only a low percentage of them can be infected. The possible heterogeneity within a population of cells that means that only a subpopulation of them can be infected may be due to various reasons:
First, it may be due to variations in the intrinsic characteristics of the population that make up the cell line. For example, studies have been carried out where cells such as Caco-2 and MDCKII, which show structural and functional variability, exhibit subpopulations with different degrees of permeability, transport and metabolic properties depending on characteristics such as seeding density, passage number, confluence and culture conditions [23]; Some of these differences in the cell population could affect their susceptibility to being productively infected.
Another possible explanation is that some important factor for virus replication is not expressed in the same way in all cells. For example, dengue virus infection is affected by the restricted expression of a C-type lectin receptor present on the cell surface (Dendritic Cell-specific Intercellular Adhesion Molecule 3-grabbing Non-integrin DC-SIGN), which is demonstrated to be a critical factor for the pathogenesis of dengue in the early stages of infection; DC-SIGN molecules allow efficient endocytosis and therefore efficient virus replication [24].
On the other hand, Kim et al. [25] conducted a study with porcine reproductive and respiratory syndrome (PRRS) viruses showed that MA104 cells are heterogeneous concerning the permissiveness of the virus by cloning subpopulations of MA104 cells. In this study, Kim et al. obtained two clones with high and low permissiveness (MARC-145 and L-1, respectively). When comparing the viral yield in the three populations, they observed a 5-log increase in the viral infectivity of the MARC-145 clone and a 1-log decrease in the L-1 clone concerning the parental cell line MA104 [26].
It was decided to evaluate whether, in the case of astrovirus, clones could be obtained with a higher and lower degree of permissiveness as in the case of PRRS since it is the same MA104 cell line and the virus is also positive polarity RNA. 10 clones were obtained, all of them were infected to a lesser degree than the parental cell line, so it would be necessary to continue isolating clones and find one in which the percentage of infection is greater than the parental cell line, to determine that the heterogeneity to Astrovirus infection is due to the presence of clones that are permissive or non-permissive.
To evaluate whether any stage during the astrovirus serotype 8 replication cycle is delayed in the MA104 cell line, a single cycle growth curve was carried out and compared with the same curve but in Caco-2 cells. A delay is observed in the initial stage of infection of approximately 3 h. This phenomenon where the virus does not immediately enter the eclipse phase was observed in rotavirus [27] after infecting two partially permissive cell lines (L and HEp2 cells) and can be explained in two ways: i) the internalized virus cannot escape from the endocytic vesicles, or ii) the release of the genome is inefficient. Therefore, in the MA104 cell line, there is a limiting factor during some early stages of the infection, one of these limitations may be during the attachment of the virus to the cell. Aguilar-Hernández, 2018, showed that HAstV- 8 binds 5 times less in MA104 cells than in Caco-2 cells [28].
Furthermore, it is observed that the burst phase is limited compared to the same phase in Caco-2 cells; this may be because only a subpopulation of MA104 cells is infected and coupled with the fact that the production of infectious particles per infected cell is very low in this cell line, an affectation can be established in some step of the replication cycle after entry; This phenomenon has been observed in viruses such as dengue, hepatitis C and Coxsackievirus B3 [29].
Through the transfection of viral RNA to evade entry, surprisingly, it was found that HAstV-8 can replicate and produce infectious viral progeny, although in an extremely inefficient manner compared to the other two cell lines; this suggests that in addition to the limitation during entry, there is another limitation at a later stage [30]. In the case of PRRS and norovirus, after transfecting viral RNA into non-permissive cells and recovering infectious particles, binding assays were carried out in which they observed that the virus could not bind (or bound very little), which allowed them to conclude that tropism was determined at the level of receptor or membrane factors. For MDCKII cells, it is known that astrovirus can bind similarly to MA104 cells, 5 times less than the binding of the virus to Caco-2 cells [5]. Taken together, this indicates that the cell line expresses the molecules necessary for viral recognition on its surface and presents the intracellular requirements required to carry out the infection, but it is possible that factors that limit its infection are present, or that it does not express or one or more elements necessary for HAstVs to carry out their replicative cycle efficiently.
Thus, in the MA104 and MDCKII cell lines, tropism is limited in the early and subsequent stages of infection. An example of this behaviour is the hepatitis C virus [31], in which a difference in permissiveness towards different lines of hepatoma has been observed. It has been shown that it is partially defined at the level of viral entry by the expression of receptors on its surface, deficiencies in late entry and is also defined in post-entry stages due to the lack of proteins necessary for the efficient production of viral proteins that reduce the encapcidation of the virus and its egress from the cell.
Human-infecting astroviruses differ in their capacity to infect various cell lines in culture, and their tropism may be restricted at one or more stages of their replication cycle. Comparatively, only 13% of MA104 cells can become infected with HAstV-8, compared to 91% of Caco-2 cells in a monolayer. This restriction in HAstV-1 infection of MA104 cells is conserved and can be attributed to the original cell line's presence of a heterogeneous population with at least two subpopulations of variable permissiveness. Although it is possible that by isolating more clones, more permissive cells than the parental line could be obtained, the cloning of subpopulations allowed the identification of clones that displayed a decrease in the percentage of infected cells of up to 1 log less compared to the parental cell line MA104. A 3-h delay in the initial stage of infection of MA104 cells is seen when comparing the single-cycle growth curves of HAstV-8 in Caco-2 and MA104 cells. This establishes a likely restriction during their interaction with the receptor, binding, internalization of the virus, and/or during the viral genome release. The MA104 cell population is also notable for its heterogeneity in terms of susceptibility to being infected by astrovirus. Additionally, a change could be seen in one or more steps of the replication cycle after entry because i) the yield of serotypes -1 and -8 virus infection in MA104 cells is 4 and 13 times lower, respectively, compared to that in Caco-2 cells (Figure 2 and Table 1); ii) the MA104 cell line's single cycle curve's explosion phase is of a lower proportion compared to that of Caco-2 cells and iii) after the trans The production of infectious viral particles as compared to the yield attained after an infection was shown to be substantially damaged, hence it is crucial to emphasize that caution must be exercised while evaluating the results of the astrovirus viral RNA transfection investigations.
Since MDCKII cells are resistant to infection or do not become infected, there is an obvious constraint in these cells' early stages of disease. Since viral progeny was seen (Table 3) after transfecting the HAstV-RNA, the findings show that once the viral RNA is released into the cell, the MDCKII cells' machinery can reproduce the virus. 8; However, compared to the other two cell lines (Caco-2 and MA104), the 7 pfu produced in MDCKII cells are significantly less. Thus, it can be concluded that astrovirus tropism in MDCKII cells is restricted in the early phases of infection and after RNA stripping. Due to the lower viral production after transfection of viral RNA compared to infected cells, caution should be exercised when interpreting these results.
Overall, the research's findings suggest that astrovirus tropism is restricted for the MA104 and MDCKII cell lines during entry and at some point, following the release of the virus' RNA into the cytosol.
Bosch, A. et al. “Human astroviruses.” Clinical Microbiology Reviews, vol. 27, no. 4, October 2014, pp. 1048-1074.
De Benedictis, P. et al. “Astrovirus infections in humans and animals - molecular biology, genetic diversity, and interspecies transmissions.” Infection, Genetics and Evolution, vol. 11, no. 7, October 2011, pp. 1529-1544.
Nordholm, J. et al. “Translational regulation of viral secretory proteins by the 5′ coding regions and a viral RNA-binding protein.” The Journal of Cell Biology, vol. 216, no. 8, 2017, pp. 2283-2293.
Burrell, C.J. et al. “Pathogenesis of virus infections.” Fenner and White’s Medical Virology, 2017, pp. 77-104.
Aguilar-Hernández, N. et al. “Protein disulfide isomerase A4 is involved in genome uncoating during human astrovirus cell entry.” Viruses, vol. 13, no. 1, December 2020, p. 53.
Chary, A. “Culturing human lung adenocarcinoma cells in a serum-free environment.” Methods in Molecular Biology, vol. 2645, 2023, pp. 165-172.
Lambert, F. et al. “Titration of human coronaviruses using an immuno-peroxidase assay.” Journal of Visualized Experiments, no. 14, April 2008, p. 751. https://doi.org/10.3791/751.
Espinosa, R. et al. “Isolation of neutralizing monoclonal antibodies to human astrovirus and characterization of virus variants that escape neutralization.” Journal of Virology, vol. 93, no. 2, 2018, pp. 1-12.
Avci-Adali, M. et al. “Optimized conditions for successful transfection of human endothelial cells with in vitro synthesized and modified mRNA for induction of protein expression.” Journal of Biological Engineering, vol. 8, no. 1, March 2014, p. 8.
Domann, R., and J. Martinez. “Alternative to cloning cylinders for isolation of adherent cell clones.” BioTechniques, vol. 18, 1995, pp. 592-594.
Charman, M. et al. “Viral and cellular interactions during adenovirus DNA replication.” FEBS Letters, vol. 593, no. 24, December 2019, pp. 3531-3550. https://doi.org/10.1002/1873-3468.13695.
Barreau, C. et al. “Liposome-mediated RNA transfection should be used with caution.” RNA, vol. 12, no. 10, 2006, pp. 1790-1793.
Guix, S. et al. “Human astrovirus C-terminal nsP1a protein is involved in RNA replication.” Virology, vol. 333, no. 1, 2005, pp. 124-131.
Flint, J. et al. Principles of Virology. 4th ed., American Society for Microbiology Press, 2015.
Mendenhall, I.H., G.J.D. Smith, and D. Vijaykrishna. “Ecological drivers of virus evolution: astrovirus as a case study.” Journal of Virology, vol. 89, no. 14, 2015, pp. 6978-6981.
DePolo, N.J. et al. “The resistance of retroviral vectors produced from human cells to serum inactivation in vivo and in vitro is primate species dependent.” Journal of Virology, vol. 73, no. 8, August 1999, pp. 6708-6714.
Masuda, K. et al. “Establishment and evaluation of an in vitro M cell model using C2BBe1 cells and Raji cells.” Bioscience of Microbiota, Food and Health, vol. 30, no. 2, 2011, pp. 37-44.
Aguilar-Hernández, N. et al. “Minimal capsid composition of infectious human astrovirus.” Virology, vol. 521, 2018, pp. 58-61.
Sheridan, M.A. et al. “African and Asian strains of Zika virus differ in their ability to infect and lyse primitive human placental trophoblast.” PLoS One, vol. 13, no. 7, July 2018, e0200086.
Pellett, P.E. et al. “Basics of virology.” Handbook of Clinical Neurology, vol. 123, 2014, pp. 45-66.
Feuer, R. et al. “Cell cycle status affects coxsackievirus replication, persistence, and reactivation in vitro.” Journal of Virology, vol. 76, 2002, pp. 4430-4440.
Ciarlet, M. et al. “Differential infection of polarized epithelial cell lines by sialic acid-dependent and sialic acid-independent rotavirus strains.” Journal of Virology, vol. 75, no. 23, December 2001, pp. 11834-11850.
Volpe, Donna. “Variability in Caco-2 and MDCK cell-based intestinal permeability assays.” Journal of Pharmaceutical Sciences, vol. 97, 2008, pp. 712-725. https://doi.org/10.1002/jps.21010.
Lozach, P.Y. et al. “Dendritic cell-specific intercellular adhesion molecule 3-grabbing non-integrin (DC-SIGN)-mediated enhancement of dengue virus infection is independent of DC-SIGN internalization signals.” Journal of Biological Chemistry, vol. 280, no. 25, June 2005, pp. 23698-23708.
Kim, H.S. et al. “Enhanced replication of porcine reproductive and respiratory syndrome virus in a homogeneous subpopulation of MA-104 cell line.” Archives of Virology, vol. 133, nos. 3-4, 1993, pp. 477-483.
Provost, C. et al. “Identification of a new cell line permissive to porcine reproductive and respiratory syndrome virus infection and replication which is phenotypically distinct from MARC-145 cell line.” Virology Journal, vol. 9, November 2012, p. 267.
Brunet, J.P. et al. “Rotavirus infection induces an increase in intracellular calcium concentration in human intestinal epithelial cells: role in microvillar actin alteration.” Journal of Virology, vol. 74, no. 5, March 2000, pp. 2323-2332.
Baez-Navarro, C. et al. “The association of human astrovirus with extracellular vesicles facilitates cell infection and protects the virus from neutralizing antibodies.” Journal of Virology, vol. 96, no. 14, July 2022, e0084822.
Liang, P.C. et al. “Viral interference between dengue virus and hepatitis C virus infections.” Open Forum Infectious Diseases, vol. 7, no. 8, July 2020, ofaa272.
Méndez, E. et al. “Characterization of human astrovirus cell entry.” Journal of Virology, vol. 88, no. 5, March 2014, pp. 2452-2460.
Ding, Q., M. von Schaewen, and A. Ploss. “The impact of hepatitis C virus entry on viral tropism.” Cell Host & Microbe, vol. 16, no. 5, November 2014, pp. 562-568.
