
+91 6002993949
submission@iarconsortium.org
Open Access
ISSN (Print) : 2788-9459
ISSN (Online) : 2788-9467
Aim: To determine the factors that effect on pain assessment for critically-ill patients. Background: there are many factors that effect on pan assessment among critically ill patients such as patients consciousness level, patients conditions, mechanical ventilation and sedation administration. Design: Descriptive-correlational design. Methods: The data collection started from January 18thto April 7th, 2022. Observational method for data collection and sample of 135 subjects who had met the study's inclusion criteria were targeted. Results: many factors can effect on pain assessment including patients medical diagnosis and patients classification its statistically significant associated with pain severity. Recommendations: Further studies with a larger sample size that specifically target patients to determine the factors that effect on pain assessment in critical care settings are mandatory. Use of evidence-based practice (EBP) in pain assessment and management. It is important to use the EBP when providing intensive care unit patients' care and effectively manage patients pain according to clinical health status can improve patient's outcomes.
Pain is an uncomfortable experience that has perceptual, emotional, cognition, and sociological aspects and is related to presenting or potential tissue damage [1]. Surgeries, traumas, invasive devices, extended immobilization, acute diseases, and nursing interventions can cause pain in ICU hospitalized patients. Endotracheal suctioning has been recognized as the most painful procedure in mechanically ventilated patients. Pain produces damaging physical effects. [2]. The difficulty of non-communicative mechanical ventilated patients describing their pain is a fundamental challenge to pain assessment and management for critically ill patients in the ICU. As a result, these patients are more likely to get ineffective pain-relieving therapy, such as a decrease in or increase in medication use and dose [3].
There are many factors that effect on pain assessment in the ICU such as critically ill or unconscious patients; elderly people with severe dementia; and patients nearing the end of life, and sedated patients [4]. According to cognitive, developmental, or physiologic difficulties, including medically induced disorders, each of these groups may be unable to self-report pain. The difficulty of self-reporting pain is a significant barrier to accurate pain evaluation, leaving the patient exposed to under-or over-treatment of pain. Nurses play a critical role in ensuring that the most vulnerable people receive effective pain assessment and treatment [5-6].
Communication issues, cognitive issues, and level of consciousness can influence all patient-related characteristics such as responsiveness, pain perception, and self-reporting abilities. To be successful, healthcare environments need validated pain measurement instruments, procedures, or standards, and prioritizing of pain assessment [7-8].
Patient in the intensive care unit are often subjected to multiple painful and invasive procedure, and because it's difficult to assessing and controlling pain, it is often neglected; this has a negative impact on the duration and recovery of patients in the ICU [9].
The main study question what are the patient's related factors that effect on pain assessment in the intensive care unit
The Study Aims
To determine the factors that effect on pain assessment for critically ill patients. And to find the relationship between pain severity and patients demographic characteristics. As well as to find the relationship between pain severity and patients clinical data.
Study Design
Descriptive-correlational design.
Participants and Study Design
The purposive non-probability sampling method was used for the current study method which is selected depending on population characteristics, eligibility criteria and the study's aims. The exclusion criteria of this study included patients who were <18 years old. Patients who have had neuropathic conditions such as Myasthenia Gravis and Guillain-Barre Syndrome (GBS), patients with upper limb neuropathy were excluded because these conditions may interfere with behavioral responsivity when using the BPS. Patients who can report pain were excluded because the research tool was designed for patients who are unable to report the presence and intensity of pain, as well as patients with upper limb fractures. Those on a heavy anesthetic regimen were also excluded because they may be unable to show any behavioral response which may interfere with the research tool usability and measurement accuracy and study purposes.
Table 1 The Sample consisted of 135 patients the sample size was calculated according to A-priori sample sizes for student t-tests.
Table 1: Minimum Sample Size Determination
Parameter of calculating the minimum sample size | Selected Values | |
Anticipated effect size (Cohen's d): | 0.5 | |
Desired statistical power level: | 0.8 | |
Probability level: | 0.05 |
Settings
The study was conducted by using observational methods, targeting hospitalized adult patients in the ICUs in Baghdad teaching hospitals; Martyr Ghazy Al-Hariri Hospital for Surgical Specialties; and the Private Nursing Home Hospital of the Medical City Directorate; Al-Hussein Teaching Hospital of Al-Muthanah Health Directorate.
Study Instrument
The Behavioral Pain Scale (BPS) was used in this study after obtaining official permission from the primary author Dr. Jean F Payen. The BPS is both reliable and valid for use in assessing pain for mechanically ventilated-sedated patients who are hospitalized in the ICUs and the patients who are unable to communicate and expressing their distress. Cronbach’s alpha coefficients of the scale was highly reliable; the reliability coefficient for the BPS was 0.79 [10]. The BPS contain three main domain Facial expression, compliance with mechanical ventilation and upper limb movement. Within each domain, behavioral responses are scored from 1 that indicate no pain to 4, which is the worst score that indicates the presence of pain. The health care professional uses BPS to assess the presence and severity of the pain and decide what the best behavioral response will be within each domain. Patients' responses are to be scored from 1 to 4 in each domain, with a total score of 12 that indicates maximum pain [10].
Data Collection Method
The data was collected through observational methods from January 18th, 2022, to April 7th, 2022. The severity of pain were measured objectively through observation of the patient's response using BPS and vital signs measured from patient’s monitoring machine. The study sample include 135 patients selected purposively among critically ill patients with a diminished level of consciousness. The pain, vital signs and spo2 were determined through the patients monitoring machine. The mean arterial pressure, was measured and categorized according to the following formula: (MAP = (2 × diastolic+systolic)/3). According to [11].
Data Analysis Procedures
Data were analyzed using IBM-Statistical Package for Social Sciences (SPSS) version 24, which included descriptive and inferential statistical measures. Descriptive statistics are used to describe the demographic data and health-related variables. Chi-square and exact fisher test which was used to determine the relationship between pain levels and clients’ demographic information and health-related variables.
Ethical Considerations and Official Agreements
With the submission of the study protocol, ethical approval was sought from the Scientific Committee of the Nursing Faculty, University of Baghdad. The reference number is 34, dated 5/12/2021. The researcher submitted a detailed description of the study, including problem statement, objectives, and questionnaire, to the Ministry of Planning (Central Statistical Organization) and to the Medical City Directorate, and Al-Muthanah Health Directorate, in order to obtain official permission to carry out the study.
The results represent Table 2 the highest percentages and the dominant percentage of gender distribution for the targeted sample was males, representing more the half 58.5% of the study sample and the age groups included (18– <32 years old), more than one quarter with percentage 28.9 %.had a normal heart rate 60-100 beats/min. Additionally.
Table 2: Descriptive Statistics of Sociodemographic Data
Age Groups | f | % |
18 - <32 Years Old | 39 | 28.9 |
32.0 - <45.0 Years Old | 23 | 17.0 |
45.0 - <58.0 Years Old | 26 | 19.3 |
58.0 - <71.0 Years Old | 36 | 26.7 |
≥71 Years Old | 11 | 8.1 |
Total | 135 | 100.0 |
Gender | f | % |
Male | 79 | 58.5 |
Female | 56 | 41.5 |
Total | 135 | 100.0 |
The underlined numbers in Table 3 reresent the highest percentages of the selected variables. In which the majority of the collected samples were as follow: patients’ length of staying days, more than half 55.6% of the subjects were hospitalized for 3 to 5 days. Additionally, more than half 61.5% of the participants were medically classified as non-traumatic patients. Also the study represents 23% of patients had CVA. Moreover, the consciousness level for the patients according to GCS was (5-8), representing more than half 58.5% of the study subjects. Of equal importance, the collected samples had no medical history, representing more than one quarter 28.9% of the study sample. Finally, narcotics was approximately used by about two-fifths 42.2% of study subject.
Table 3: Descriptive Statistics for Health Related Variables
Length of stay, days | f | % |
5 days or less | 75 | 55.6 |
6 - 10 days | 60 | 44.4 |
Total | 135 | 100.0 |
Medical Diagnosis | f | % |
Road Traffic Accident (RTA) | 24 | 17.8 |
Post-operative (Post-Op) | 29 | 21.5 |
Lung Fibrosis | 20 | 14.8 |
Diabetic Keto-Acidosis (DKA) | 23 | 17.0 |
Cerebrovascular Accident (CVA) | 31 | 23.0 |
Renal Failure | 8 | 5.9 |
Total | 135 | 100.0 |
Diagnoses classification | f | % |
Non-traumatic | 83 | 61.5 |
Traumatic | 52 | 38.5 |
Total | 135 | 100.0 |
Assessment by Glasgow Coma Scale (GCS) | f | % |
Severe condition (5-8) | 79 | 58.5 |
Moderate condition (9-13) | 56 | 41.5 |
Total | 135 | 100.0 |
Medical History | f | % |
None | 39 | 28.9 |
Hypertension | 15 | 11.1 |
Diabetes Mellitus | 11 | 8.1 |
Malignancies | 11 | 8.1 |
End-Stage Renal Disease (ESRD) | 4 | 3.0 |
Chronic Obstructive Pulmonary Disease (COPD) | 4 | 3.0 |
More than one disease (Hypertension and Diabetes) | 35 | 25.9 |
Coronavirus disease (COVID-19) | 12 | 8.9 |
Asthma | 4 | 3.0 |
Total | 135 | 100.0 |
Pain Medication | f | % |
No Medication | 28 | 20.7 |
Non-Narcotics | 10 | 7.4 |
Narcotics | 57 | 42.2 |
Both (Narcotics & Non-narcotics) | 40 | 29.6 |
Total | 135 | 100.0 |
Table 4 The descriptive statistics for pain intensity demonstrate the overall pain intensity was presented, which showed that more than two thirds of patients 71.1% had a severe unacceptable pain level.
Table 4: Descriptive Statistics of Pain Levels Using Behavioural Pain Scale
Overall pain Levels | Pain level categories | Total | ||||||||
No Pain 3 | Mild pain 4-5 | Severe unacceptable pain6-11 | Maximum pain12 | |||||||
f | % | f | % | f | % | f | % | F | % | |
0 | 0 | 39 | 28.9 | 96 | 71.1 | 0 | 0 | 13 | 100% | |
Regarding the respiratory rate Table 5, more than half 52.6% of patients had eupnoea (12-20 breaths/min). Approximately more than half 57.8% of study participantsless than two thirds 65.2% of patients had normal mean arterial pressure 93-99 mmHg. Of equal importance, the vast majority 93.3% of collected study samples had a normal body temperature 36.5–37.5Co. Furthermore, more than three-quarters 79.3% of patients had a normal SpO2% level of 95%–100%
The Chi-Square test represents in Table 6 there is no statistically significant association between pain intensity and a patient's gender x2 = 0.704, Exact Sig = 0.401. And about the age group there is no statistically significant association between pain intensity and a patient's age x2 = 4.456a Exact Sig = 0.348.
Table 6: Statistical Relationship between Overall Pain and Demographic Characteristics
Variables | Overall Pain Scale |
Mean | Chi-Square | ||
Gender | Mild Pain4-5 | Severe Unacceptable Amount of pain 6-11 | Value | Sign | |
Male | 25 | 54 | 5.4895 |
0.704a
|
0.401
|
Female | 14 | 42 | 5.5997 | ||
Total | 39 | 96 |
| ||
Age |
|
|
|
|
|
18-31Years old | 7 | 32 | 5.7286 | 4.456a | 0.348 |
32.0-44.0 Years Old | 6 | 17 | 5.6594 |
|
|
45.0-57.0 Years Old | 8 | 18 | 5.4776 |
|
|
58.0-70.0 Years Old | 14 | 22 | 5.3819 |
|
|
≥71 Years Old | 4 | 7 | 5.2273 |
|
|
Total | 39 | 96 |
|
|
|
Regarding the medical diagnosis Table 8, the Fisher test indicates that there is a strong statistically significant relationship between the patients' pain level and the medical diagnosis of road traffic accident and pain severity X2 = 14.665, exact sign = 0.009. The fisher test for medical history indicates that there is a statistically significant relationship between overall pain level and patients medical history X2 = 15.060, exact sign = 0.038.
The majority of the study participants' age group (18–<32 years old) was more than one quarter(28.9%) of the study sample as shown in (Table 1).
This result was not surprised the researcher since most ICU patients having RTA and this is supported by a cross-sectional study aimed to evaluate the present evaluation and treatment of pain in critically ill patients [12].
Regarding the patients' gender, findings indicated that more than half of the study sample were males (58.5%). These results were not surprising to the researcher because male patients are more at risk for cerebrovascular accidents and road traffic accidents Hinksman et al. [13]. This result was confirmed by an observational study Kemp et al. [14]. indicated that the highest percentage (54.9%) of study respondents were males.
Table 7: Statistical Relationship between Overall Pain and Health Related Variables
Variables | Overall Pain Scale | Mean | Chi-Square | ||
Diagnosis Classification | Mild Pain 4-5 | Sever Unacceptable Amount of pain 6-11 | Value | Sign | |
Non-traumatic | 31 | 52 | 5.3424 | 7.508a
| 0.006
|
Traumatic | 8 | 44 | 5.8429 | ||
Total | 39 | 96 | |||
Length of stay | |||||
5 days and less | 20 | 55 | 5.5444 | 0.406a
| 0.524
|
6 - 10 days | 19 | 41 | 5.5236 | ||
Total | 39 | 96 |
| ||
Severe condition (5-8) | 26 | 53 | 5.5274 | 1.500a
| 0.221
|
Moderate (9-13) | 13 | 43 | 5.5461 | ||
Total | 39 | 96 |
| ||
Pain Medication | |||||
No Medication | 12 | 16 | 5.3601 | 3.479a
| 0.323
|
Non-Narcotics | 3 | 7 | 5.6417 | ||
Narcotics | 14 | 43 | 5.5117 | ||
Both (Narcotics & Non-narcotics | 10 | 30 | 5.6646 | ||
Total | 39 | 96 |
| ||
The length of stay showed surprisingly that the majority of patients' length of stay was more than half (55.6%) of the subjects hospitalized for 3 to 5 days. This result is supported by Moitra et al. [15].With the majority of patients (88.9%) a retrospective cohort study Additionally, more than half (61.5%) of the participants were medically classified as non-traumatic patients. Oliveira et al. [16] reported in a cross-sectional study that represent more than two thirds (73.1%) of patients were classified as having clinical non-traumatic conditions. Also, the study showed that 23% of patients had CVA. These results were not surprising to the researcher since most patients who had cerebrovascular accidents were hospitalized in intensive care units [17].
The majority (58.5%) of the patient's consciousness level was (5-8), according to the Glasgow coma scale. These results were not surprising to the researcher since the patients were hospitalized in intensive care units. This was validated in a descriptive-correlational retrospective study [18]. Which found that most patients had altered consciousness levels (54.5%).
Moreover, the pain medication classification, the results appeared in this way: the majority of the patients' were under mild regimen of narcotics medications was approximately used by about two-fifths (42.2%) of the study subjects. This result was not surprising to the researcher since the patients are hospitalized in ICU, frequently treated with mild, moderate, and even heavy sedative regimens [10]. The study results are supported by a prospective cohort study which represented percentage (41%) [19].
Table 8: Statistical Relationship between Overall Pain and Health Related Variables
Variables | Overall Pain Scale | Mean | Fisher test | ||
Mild Pain 4-5 | Sever Unacceptable Amount of pain 6-11 | Value | Sign | ||
Medical Diagnoses | |||||
RTA | 2 | 22 | 6.0521 | 14.665
| 0.009
|
Post-Op | 6 | 23 | 5.6667 | ||
Lung Fibrosis | 6 | 14 | 5.3167 | ||
DKA | 8 | 15 | 5.3370 | ||
CVA | 16 | 15 | 5.2742 | ||
Renal Failure | 1 | 7 | 5.6354 | ||
Total | 39 | 96 |
| ||
Medical History | |||||
None | 5 | 34 | 5.8697 |
15.060
|
0.038
|
Hypertension | 4 | 11 | 5.4889 | ||
Diabetes Mellitus | 5 | 6 | 5.1515 | ||
Malignancies | 3 | 8 | 5.4924 | ||
End stage renal disease ESRD | 1 | 3 | 5.7500 | ||
Chronic obstructive pulmonary disease COPD | 3 | 1 | 4.9792 | ||
Hypertension & Diabetes | 15 | 20 | 5.3929 | ||
COVID-19 | 3 | 9 | 5.3819 | ||
Asthma | 0 | 4 | 5.6667 | ||
Total | 39 | 96 |
| ||
Many patients have a history of chronic diseases such as hypertension and diabetes mellitus, but surprisingly, the study results showed that the highest percent of patients included in the study sample did not have any history of medical disease, representing approximately more than one quarter (28.9%) of the study sample. This may be due to most patients admitted to the ICU with road traffic accidents having no past history of chronic disease Al- Sutari et al. [20].
Based on the overall level of pain, more than two-thirds of patients (71.1%) showed an unacceptable level of pain this result is not surprised the researcher since patients in ICU are silently suffered pain and discomfort. This represents more than half (61.5%) of the total collected samples. The presented result is supported by Darmanto et al. [21].
Regarding the association of gender and overall pain level show that there is no statistically significant relationship between pain intensity and gender. These result surprised the researcher because the studies reported that females were significantly more sensitive to pain than males [22-23]. Concerning the patients' age and its association with pain severity, there is no statistically significant association. This result surprised the researcher because the pain threshold was significantly different among the elderly and younger age groups according to Petrini et al. [24] who reported that the pain severity was significantly lower in elderly patients than in young patients.
In the (Table 6), it indicates that there is a strong statistically significant relationship between the patients' overall pain level and the diagnosis classification of traumatized patients. This is an expected outcome since traumatic patients suffer more pain than medical conditions. This results were agreed upon by the Robleda et al. [25].
Concerning patients' classification shown, results indicate that there is a strong statistically significant relationship between the patients' medical diagnosis and pain severity. This result is supported by the Gélinas and Arbour, a descriptive-correlational design observational study which reported that there was a significant correlation between patients' medical diagnosis and pain level.
While the length of stay indicates that there is no statistically significant association between pain intensity and a patient's hospitalization days. Likewise, Damico et al. [26]. Concerning consciousness level, that shown in (Table 5-8) indicates that there is no statistically significant association between overall pain intensity and a patient's Glasgow Coma Score Rijkenberg et al. [27].
Regarding patients' medical history indicates that there is a statistically significant relationship between the patients' pain and patients' medical history. This result was not surprised the researcher and confirmed by the prospective descriptive study [28].
The results of the chi-square test shown that there is no statistically significant relationship between pain intensity and narcotic or non-narcotic medication. This result was supported by Verma et al. [29].
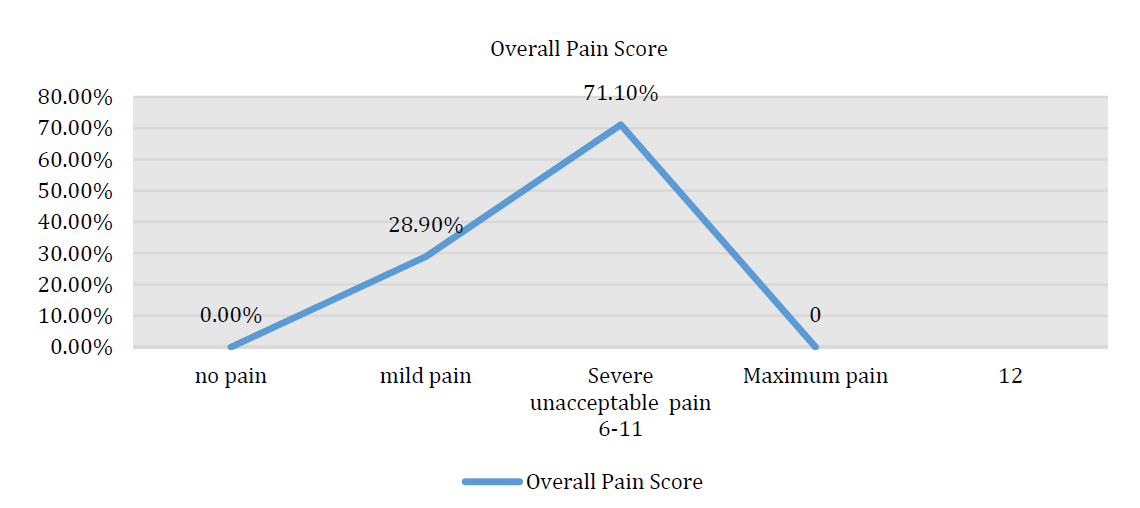
Figure 1: The Mean Plot Demonstrates the Higher Percentage of Patients Having Severe Unacceptable Pain as an Expected Outcome to Silently Suffering Patients
The critically ill, mechanically ventilated patients who were recruited in this study, were silently suffering from a relatively high level of pain during their hospitalization period in the Intensive Care Unit. Also there are many factors related patients that effect on pain assessment some of these factors consciousness level, patient's conditions and medication use in the intensive care unit.
Limitations
The main limitations are the relatively small sample size and the timeframe for the study and data collection. The more relevant method to classify the patient's consciousness and sedation level in the ICUs is the Richmond Agitation Sedation Scale (RASS), which is not used in the current study since it is not applicable in the health situations and the health care providers and the informed consent to use the RASS was not obtained from the primary author.
Recommendations
Further studies with a larger sample size that specifically target patients to determine the factors that effect on pain assessment in critical care settings are mandatory. Use of evidence-based practice (EBP) in pain assessment and management. It is important to use the EBP when providing intensive care unit patients' care and effectively manage patients pain according to clinical health status can improve patient's outcomes.
Funding Information
The budget of this research work was not support by any governmental or non‐governmental organization. The author of this manuscript covered all the research work‐related expenses.
Conflicts of Interest
None.
Williams A.C.D.C. and K.D. Craig. “Updating the definition of pain.” Pain, vol. 157, no. 11, 2016, pp. 2420–2423. https://doi:10.1097/j.pain.0000000000000613.
Aktaş Y.Y. and N. Karabulut. “Relief of procedural pain in critically ill patients by music therapy: A randomized controlled trial.” Complementary Medicine Research, vol. 26, no. 3, 2019, pp. 156–165. https://doi.org/10.1159/00 0495301.
Kirshner D. et al. “Validity and reliability of the behavioral pain scale (BPS) for assessing pain in non-communicative chronically ventilated patients.” HSOA Journal of Gerontology & Geriatric Medicine, vol. 6, 2020, article 046. https://doi:10.24966/GGM-8662/100046.
Kadhim H. “Evaluation of nurses’ practices toward the control of patients’ complications at the respiratory care unit in Baghdad teaching hospitals.” Iraqi National Journal of Nursing Specialties, vol. 1, no. 27, 2014, pp. 47–58.
Herr K. et al. “Pain assessment in the patient unable to self-report: Clinical practice recommendations in support of the ASPMN 2019 position statement.” Pain Management Nursing, vol. 20, no. 5, 2019, pp. 404–417. https://doi.org /10.1016/j.pmn.2019.07.005.
Arrar A. and S. Mohammed. “Evaluation of nurses’ knowledge and practices concerning nursing care guide in the intensive care unit in Misan governorate hospitals.” Kufa Journal for Nursing Sciences, vol. 10, no. 1, 2020, pp. 12–22. https://doi:10.36321/kjns/2020/100102.
Teo S.P. “Acute pain assessment practice among healthcare professionals from medical and surgical wards in Brunei hospitals.” Aging Medicine and Healthcare, 2020. https://doi:10.33879/AMH.XXX.2020.03007.
Na’el K.A. and W.K. Mohammed. “Nurses’ knowledge toward care of unconscious adult patients at teaching hospitals in Al-Hilla City.” Iraqi National Journal of Nursing Specialties, vol. 32, no. 1, 2019.
Pinheiro A.R.P.D.Q. and R.M.D. Marques. “Behavioral pain scale and critical-care pain observation tool for pain evaluation in orotracheally tubed critical patients: A systematic review of the literature.” Revista Brasileira de Terapia Intensiva, vol. 31, 2020, pp. 571–581. https://doi.org/10.5935/0103-507X.20190070.
Payen J.F. et al. “Assessing pain in critically ill sedated patients by using a behavioral pain scale.” Critical Care Medicine, vol. 29, no. 12, 2001, pp. 2258–2263. https://doi:10.1097/00003246-200112000-00004.
Kundu R.N. et al. “Mean arterial pressure classification: A better tool for statistical interpretation of blood pressure-related risk covariates.” Cardiology and Angiology: An International Journal, vol. 6, no. 1, 2017, pp. 1–7. https://doi:10.9734/CA/2017/30255.
Alikiaie B. et al. “Evaluation of pain assessment and management in critically ill intubated patients in a referral university hospital in Iran.” Journal of Research in Pharmacy Practice, vol. 8, no. 3, 2019, pp. 137. https://doi: 10.41 03/jrpp.JRPP_18_81.
Hinksman C.A. et al. “Cerebrovascular disease mortality after occupational radiation exposure among the UK National Registry for Radiation Workers cohort.” Radiation Research, vol. 197, no. 5, 2022, pp. 459–470. https://doi.org/10.1667/RADE-20-00204.1.
Kemp H.I. et al. “Pain assessment in intensive care (PAINT): An observational study of physician-documented pain assessment in 45 intensive care units in the United Kingdom.” Anaesthesia, vol. 72, no. 6, 2017, pp. 737–748. https://doi.org/10.1111/anae.13786.
Moitra V.K. et al. “Relationship between ICU length of stay and long-term mortality for elderly ICU survivors.” Critical Care Medicine, vol. 44, no. 4, 2016, pp. 655. https://doi:10.1097/CCM.0000000000001480.
Oliveira L.S. et al. “Pain assessment in critical patients using the behavioral pain scale.” Brazilian Journal of Pain, vol. 2, 2019, pp. 112–116. https://doi.org/10.5935/2595-0118.20190021.
Jo S. et al. “Newly developed stroke in patients admitted to non-neurological intensive care units.” Journal of Neurology, vol. 267, no. 10, 2020, pp. 2961–2970. https: //doi.org/10.1007/s00415-020-09955-5.
Morris J.L. et al. “Determinants of pain assessment documentation in intensive care units.” Canadian Journal of Anesthesia, vol. 68, no. 8, 2021, pp. 1176–1184. https://doi.org/10.1007/s12630-021-02022-1.
Klein C. et al. “Validation of two pain assessment tools using a standardized nociceptive stimulation in critically ill adults.” Journal of Pain and Symptom Management, vol. 56, no. 4, 2018, pp. 594–601. https://doi.org/10.1016/j.j painsymman.2018.06.014.
Al Sutari M.M. et al. “Pain among mechanically ventilated patients in critical care units.” Journal of Research in Medical Sciences, vol. 19, no. 8, 2014, pp. 726.
Darmanto D. et al. “Suitability of CPOT and BPS to assess pain response in intubated Mohammad Hoesin Hospital intensive care patients.” Journal of Anesthesiology and Clinical Research, vol. 1, no. 2, 2020, pp. 85–94. https://doi.org/10.37275/jacr.v1i2.140.
Templeton K.J. “Sex and gender issues in pain management.” Journal of Bone & Joint Surgery, vol. 102, suppl. 1, 2020, pp. 32–35. https://doi:10.2106/JBJS.20.00237.
García-Esquinas E. et al. “Gender differences in pain risk in old age: Magnitude and contributors.” Mayo Clinic Proceedings, vol. 94, no. 9, 2019, pp. 1707–1717. https://doi.org/10.1016/j.mayocp.2019.03.034.
Petrini L. et al. “The effect of age and gender on pressure pain thresholds and suprathreshold stimuli.” Perception, vol. 44, no. 5, 2015, pp. 587–596. https://doi.or g/10.1068/p7847.
Robleda G. et al. “Influence of preoperative emotional state on postoperative pain following orthopedic and trauma surgery.” Revista Latino-Americana de Enfermagem, vol. 22, 2014, pp. 785–791. https://doi:10.1590/0104-1169.0118.2481.
Damico V. et al. “Incidence of pain at rest and during nursing procedures in ICU patients: A longitudinal observational study.” Annali di Igiene, vol. 32, no. 4, 2020, pp. 407–418. https://doi:10.7416/ai.2020.2364.
Rijkenberg S. et al. “Pain measurement in mechanically ventilated critically ill patients: Behavioral pain scale versus critical-care pain observation tool.” Journal of Critical Care, vol. 30, no. 1, 2015, pp. 167–172. https://doi:10.1016/j.jcrc.2014.09.007.
Ayasrah S. “Care-related pain in critically ill mechanically ventilated patients.” Anesthesia and Intensive Care, vol. 44, no. 4, 2016, pp. 458–465. https://doi.org/10.1177/03 10057X1604400412.
Verma R. et al. “Discomforts in critically ill patients: Our experience in intensive care unit of a tertiary care hospital in India.” Journal of Clinical and Diagnostic Research, vol. 15, no. 2, 2021. https://doi:10.7860/JCDR/20 21/46882.14586.
