
+91 6002993949
submission@iarconsortium.org
Open Access
ISSN (Print) : 2788-9394
ISSN (Online) : 2788-9408
The main objective of this paper is to use Google Earth Engine (GEE) as a cloud computing platform to analyze the water and climate big data of Africa from January 1958 to December 2021. The TerraClimate dataset of monthly climate and water balance for African terrestrial surfaces from 1958-2022 with 1/24° spatial resolution (about 4 km) is targeted to be analyzed. Both primary Climate Variables, i.e., Maximum temperature (Tx), minimum temperature (Tm), vapor pressure (vap), precipitation accumulation (pr), downward surface shortwave radiation (srad) and wind speed (vs) and Derived Variables, i.e., reference evapotranspiration (pet), runoff (ro), actual evapotranspiration (aet), climate water deficit (def), soil moisture (soil), snow water equivalent (swe), Palmer Drought Severity Index (pdsi) and vapor pressure deficit (vpd). TerraClimate uses climatically assisted interpolation to produce a monthly dataset. TerraClimate also generates surface water balance information every month based on pet, pr, Tx, Tm and estimated plant extractable soil water capacity. An annual Tx, Tm, pr and pet were used to confirm TerraClimate's spatiotemporal features. Compared to coarser resolution gridded datasets, TerraClimate datasets have lower overall mean absolute error and higher spatial fidelity. The GEE platform was used to analyze the TerraClimate dataset parameters. All parameters have been analyzed except swe; Africa is the highest continent in temperature and solar radiation; after all, snow areas in Africa are not expected. The entire dataset's minimum, maximum and mean analyses are processed and maps for all mentioned parameters are produced to represent the African continent's lack, potential and standard conditions, respectively.
Africa continent; About 20% of Earth's land area (30.3 million km2); is the world's second-most populated continent after Asia; 16% of the world's population with a global median age of 30.4 years, Africa has the youngest population [1]. The climate ranges from equatorial to subtropical highland. The only areas with moderate climates are high mountains and continental boundaries. Compared to the year-round high temperatures, rainfall in Africa is unpredictable. The subtropical ridge and hot, dry air masses make Africa's deserts the sunniest and driest. Africa has the warmest climate, hottest summers and longest days.
Africa's climates vary owing to its equatorial and subtropical latitudes. The humidity is considerable because the continent is intertropical, between Cancer and Capricorn. This damp land is heated. Africa's northernmost desert area is hot and humid. Northern and southern Europe has a Mediterranean climate. Africa is the world's most tropical continent, while Cancer and Capricorn are the world's most tropical constellations.
Extensive data analysis is the practice of finding patterns and connections in massive datasets to guide choices. Using modern instruments, these approaches employ statistical analysis techniques like grouping and regression to larger datasets. For decades, remote sensing technologies began gathering large datasets that cannot be managed or analyzed using standard software or desktop resources. Google has built a cloud computing platform called Google Earth Engine (GEE) concerning extensive data processing. This platform enables large-scale analysis of massive spatial data and long-term environmental tracking. Despite its 2010 introduction and significant promise for many applications, this platform has recently been adequately examined and employed for RS. Its datasets, functions, advantages/ limitations and applications are explored in-depth. Between January 2010 and May 2020, 450 journal papers were evaluated in 150 publications. Amani et al. [2] found that GEE users heavily rely on Landsat and Sentinel data. More and more picture categorization jobs used supervised machine learning methods like Random Forest. Some of GEE's applications are geography, hydrology, urban planning, disaster analysis, climate analysis and image processing. More and more users from various areas are likely to employ GEE to tackle their considerable data processing difficulties, as witnessed in recent years [2].
Vast volumes of unstructured data have been a buzzword since the early 2000s. Sensors, networks, transactions, smart devices, online usage and other complicated data sources continue to evolve on this subject. These methodologies are increasingly being applied with new technologies like machine learning to find and scale complex discoveries. Extensive data analysis is the process of gathering, processing, cleaning and analyzing enormous datasets to assist companies in making sense of their large amounts of data.
Earth's monthly climate and climatic water balance statistics from 1958 to date. Inputs for global ecological and hydrological investigations require high spatial resolution and time-varying data. All data are monthly and 4 km (1/24th degree) spatially resolved. Climate-driven global environmental concerns require geographically and temporally reliable datasets. A growing collection of historical climate datasets interpolating data from surface observations, reanalysis and combinations. Each has benefits in terms of variables, temporal and geographical resolution, geographic coverage and period. Increasing interest in using climate data to solve transdisciplinary challenges has led to increasingly significant geographical scales [3-7]. Despite the existence of time-varying (monthly data spanning multiple decades) and high spatial resolution (4 km) climate datasets at national and continental scales and high-spatial resolution climate typical for the globe. In addition to covering all global land surfaces, high-resolution climate data covering many of the critical surface climatic variables is unknown [8-13]. The gap between known climate data and the scale at which organisms sense their environment is becoming increasingly apparent [14]. Much work has been done on downscaling gridded climatic fields for application in ecological and global change studies, with variable results [15]. It is frequently required to simulate environmental and hydrological systems [16]. To construct high spatial resolution temperature, precipitation, wind speed, vapor pressure and downward shortwave flux climatic surfaces, WorldClim employed station data and topography covariates [17]. A temporal study may be required to relate climatic variability with climate consequences in ecological, agricultural and hydrological systems. Aside from temperature and precipitation, climatic metrics relating to ecosystem production and water resources have garnered attention. Water balance models use climatic and biophysical variables to account for water and energy. Some of the most common uses of water balance models estimate runoff and ecosystem productivity [18-20]. While specific global water balance statistics are available from basic water balance models or more advanced land-surface hydrologic models, these models often provide output at coarse geographical scales (>50 km) or lack significant time series components, respectively [21-24]. Water balance databases at the national and continental scales have been developed but no global time-varying datasets exist [25].
This work describes the analysis of the TerraClimate dataset of Africa, a monthly high-resolution climate dataset spanning 1958 to 2021 that contains variables for computing energy-based reference potential evapotranspiration and a water balance model.
Study Area Description
Africa's climate varies along the continent from tropical to subarctic. The northern half is primarily dry, while the central and southern parties are covered in savannas and lush jungles. In between, Sahel and steppe vegetation prevail. Africa is considered the warmest continent on Earth, with 60% deserts and drylands (Figure 1). The 1922 Libyan record of 58°C [26].
Water is an essential subject in Africa, including its origins, distribution and commercial uses. Africa contains 9% of the world's freshwater resources and 16% of the world's population [27,28]. Lake Victoria and the Nile are among their waterways. Densely populated, Africa is the world's second driest continent [29].
Uneven distribution, population increase and poor resource management are responsible for these shortages. Much water means fewer people. For example, the Congo Basin holds 30% of Africa's water but only 10% of its inhabitants [29].
The pattern of rainfall varies significantly across locations and times of the year. In some areas of the region, high evaporation rates decrease precipitation percentages [29]. While some places have enough water, Sub-Saharan Africa has several water-related difficulties that stifle economic progress and risk people's livelihoods due to high inter-and intra-annual fluctuation [28]. Fewer than 10% of cultivated land is irrigated in Africa and rain-fed agriculture dominates [27]. Therefore, climate change and fluctuation have a significant influence [28]. This is a substantial contributor to the existing installed energy capacity. Hence the decade of continual investment, increasing electricity output [28].
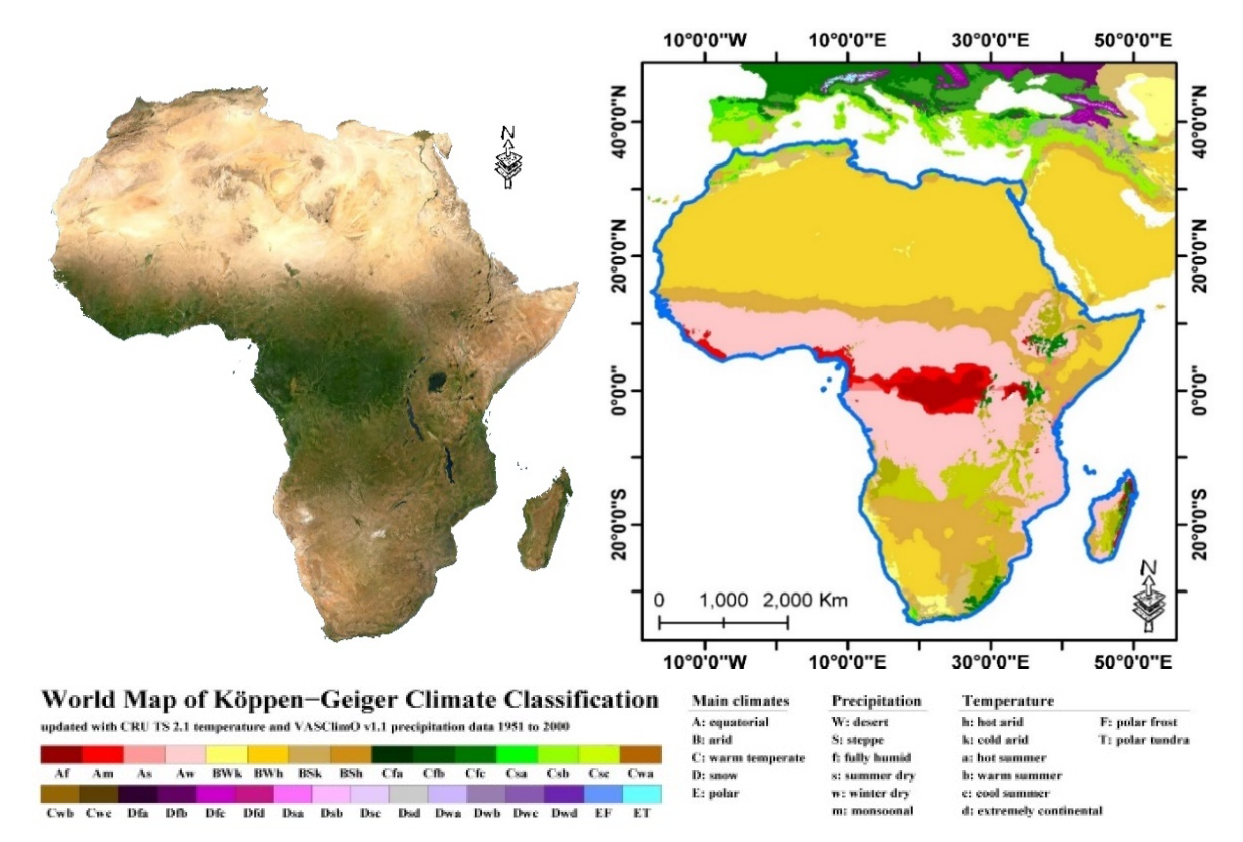
Figure 1: Satellite Data Representing the Study Area Location and Surface Characteristics Besides its Climate Classification Based on Updated Köppen-Geiger Climate Classification
TerraClimate Dataset
TerraClimate uses WorldClim's high-resolution climatological regular anregularr climate data sources to reanalyze coarse-resolution but time-varying data. The method interpolates time-varying anomalies to generate a dataset with a longer temporal record.
A 55-year reanalysis of Japanese climate data was used to compile these results. These statistics cover the period 1958-2021 and cover the whole land surface of Africa.
In comparison to temperature-based assessments, ETo is thought to give a more accurate estimation of potential evapotranspiration. Although actual vegetation water use may vary, the ETo model assumes a homogeneous grass surface in space. The ETo was adjusted to account for decreased surface water flow during snow cover or before the growing season using an empirical temperature-temperature relationship [4,30].
Most global terrestrial surfaces have an inherent temperature, precipitation and vapor pressure. There are no climate stations in these areas (including all of Antarctica and parts of Africa, South America and scattered islands). The number of stations used by TerraClimate is shown for temperature, vapor pressure, wind, solar and precipitation. This is in addition to interpolated plant extractable soil water capacity and reference evapotranspiration generated by TerraClimate.
TerraClimate was significantly validated using ground station-based data. A more realistic geographical representation in TerraClimate produced better validation statistics. Also, TerraClimate's annual reference evapotranspiration fields matched FLUXNET station-based reference evapotranspiration fields. TerraClimate's interannual runoff model reached observed streamflow in numerous basins worldwide.
Water Balance Parameters Analysis
The Water Balance parameters include reference evapotranspiration (pet), runoff (ro), actual evapotranspiration (aet), climate water deficit (def), soil moisture (soil) and Palmer Drought Severity Index (pdsi). The mean, maximum and minimum statistical analyses were applied to the water balance parameters of the TerraClimate dataset from January 1958 to December 2021 to indicate the lack, potential and standard conditions of the African continent, respectively.
Climate Parameters Analysis
The Climate parameters include Maximum temperature (Tx), minimum temperature (Tm), vapor pressure (vap), precipitation accumulation (pr), downward surface shortwave radiation (srad), wind speed (vs) and vapor pressure deficit (vpd). The mean, maximum and minimum statistical analyses were applied to the climate parameters of the TerraClimate dataset from January 1958 to December 2021 to indicate the African continent's lack, potential and standard conditions, respectively.
Google Earth Engine (GEE)
Google earth engine is a robust spatial data analysis depending on the solid google cloud computing platform. The statistical analysis of the mean, maximum and minimum values were applied to the TerraClimate dataset from January 1958 to December 2021 to determine the absence of potential and standard conditions on the African continent, respectively, during the study period (Figure 2).
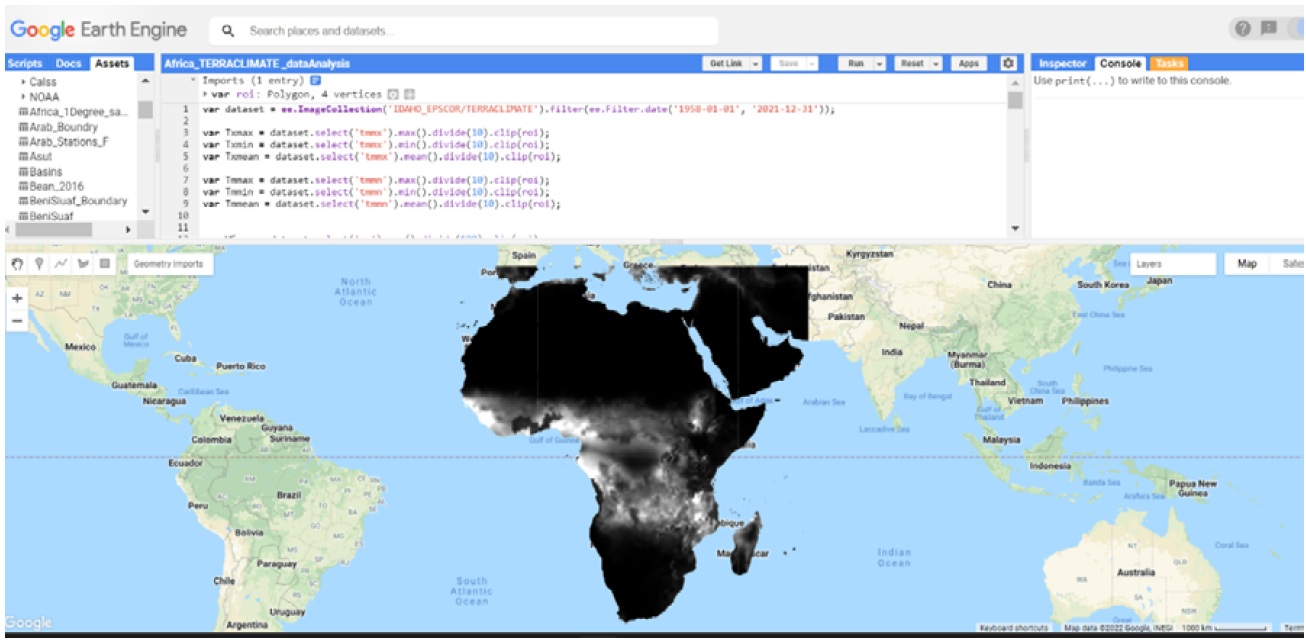
Figure 2: Google Earth Engine Platform
Water Balance Parameters Mapping
It is made up of many elements, including reference evapotranspiration (pet), runoff (ro), actual evapotranspiration (aet), climatic water deficit (def), soil moisture (soil) and the Palmer Drought Severity Index (pdsi). When applied to the water balance parameters of the TerraClimate dataset from January 1958 to December 2021, the statistical analysis of the mean, maximum and lowest values revealed that the African continent lacked, had potential and was operating under normal circumstances, respectively.
The aet parameter changed depending on the maximum, mean and minimum analyses. The aet values changed in response to changes in place and time. Aside from differences in water availability in the topsoil layer and plant cover density, water consumption in dry and hot spots differs from that in wet and cold areas.
The max value represents the highest value from Jan 1958 to Dec 2021 for every pixel over the African continent. The max values ranged from 0 to 314 mm/month. The northern part of Africa is inferior in aet, which reflects a lack of precipitation, soil water content and vegetation cover.
The mean value is the average value for every pixel on the continent of Africa throughout the period from January 1958 to December 2021, calculated for every pixel on the continent of Africa. The mean values varied from 0 millimeters per month to 124 millimeters per month. The northern section of Africa is still relatively deficient in aet and the problem has become worse as it has moved south, alongside Somalia and the southwest half of the continent, which represents a lack of precipitation, soil water content and plant cover for the most of the time.
For every pixel on the continent of Africa over the period from January 1958 to December 2021, the min value is the value that is the lowest of all possible values determined for every pixel on the continent of Africa. It was found that the minimum values ranged from 0 millimeters per month to 68 millimeters per month in length. The majority of the continent had shallow asset values, indicating an absence of precipitation, soil water content and plant cover for a significant portion of the year. The rest zones with high values suggested that water use persisted over the period from January 1958 to December 2021 (Figure 3).
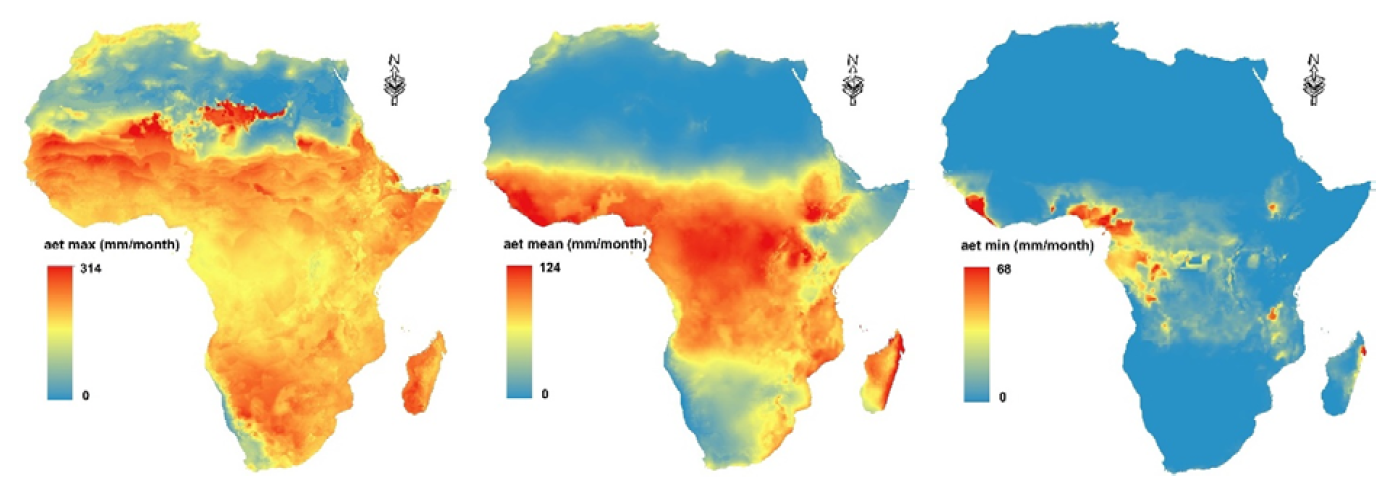
Figure 3: The Max, Mean and Min aet (mm/month) Derived from Africa's TerraClimate Dataset from Jan 1958 to Dec 2021
When the maximum, mean and minimum analyses were performed on the data, the pet parameter changed. The pet's worth is altered due to changes in location and timeframe. Aside from the variations in climatic characteristics, the climate in dry and hot areas differs from the environment in wet and cold places.
The maximum value indicates the most outstanding value recorded for every pixel on the African continent from January 1958 to December 2021. The maximum values varied from 90 millimeters per month to 466 millimeters per month. The northern section of Africa has very high pet values, reflecting the severe climatic conditions in the region.
The mean value is the average value for every pixel on the continent of Africa over the period from January 1958 to December 2021, calculated for every pixel on the continent of Africa. The mean value is the average value for every pixel on the continent of Africa over the period from January 1958 to December 2021. Depending on the season, the typical readings ranged from 42 millimeters per month to 256 millimeters per month. The northern area of Africa, which includes Somalia and the south-western half of the continent, which has a severe environment for most of the year, continues to have a relatively high concentration of pets.
The min value is the value that is the lowest of all possible values calculated for every pixel on the continent of Africa over the period from January 1958 to December 2021. Researchers discovered that the weakest values varied from 0 millimeters per month in length to 150 millimeters per month in size in terms of length. The typical pet values were associated with cold seasons and constituted the lowest limit of the pet range of values (Figure 4).
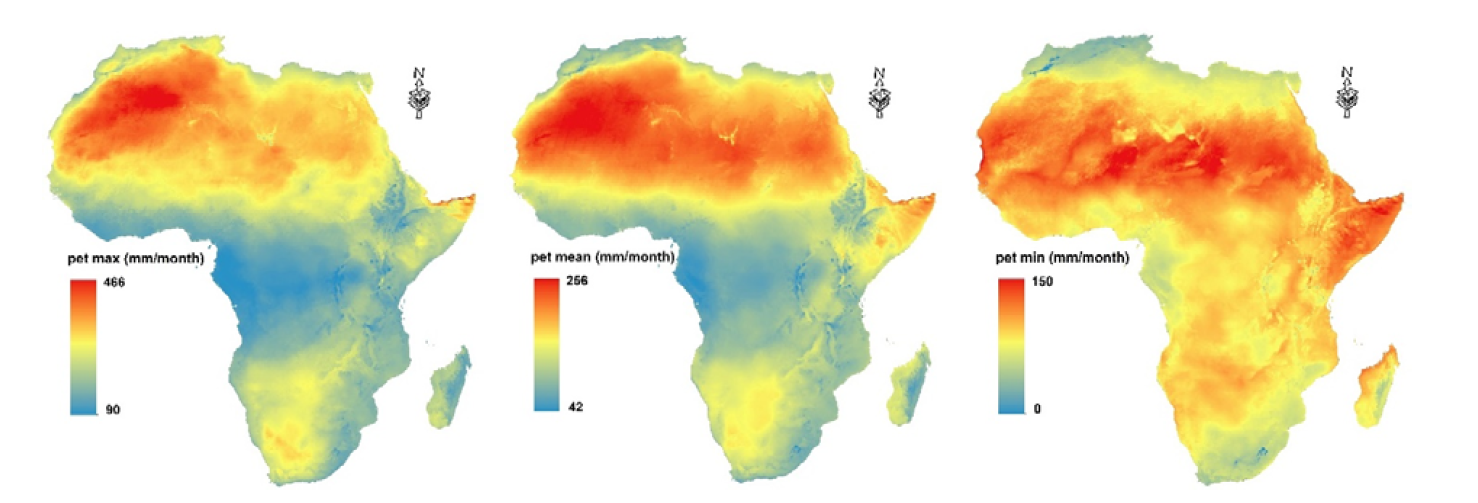
Figure 4: The Max, Mean and Min pet (mm/month) Derived from Africa's TerraClimate Dataset from Jan 1958 to Dec 2021
The value of the pr parameter fluctuated depending on whether the maximum, mean or min analyses were performed. Depending on where you were and when you were there, the pr values fluctuated. The maximum value indicates the most outstanding value recorded for every pixel on the African continent from January 1958 to December 2021. The maximum monthly rainfall amounts varied from 882 to 6918 mm/month. Compared to the middle region of Africa, the northern and southern sections of the continent had comparatively low values.
The mean value is the average value for every pixel on the continent of Africa over the period from January 1958 to December 2021, calculated for every pixel on the continent of Africa. The mean value is the average value for every pixel on the continent of Africa over the period from January 1958 to December 2021. It was found that the mean values ranged between 0 millimeters per month to 392 millimeters per month. Precipitation, soil water content and plant cover are all in short supply in the northern section of Africa. The situation has gotten worse as the continent has moved south, particularly in Somalia and the southwest half of the continent, where there is a lack of precipitation, soil water content and plant cover for most of the time.
The min value is the value that is the lowest of all possible values calculated for every pixel on the continent of Africa over the period from January 1958 to December 2021. Researchers discovered that the weakest values varied from 0 millimeters per month in length to 37 millimeters per month in size in terms of length. Precipitation, soil water content and plant cover were all low throughout the bulk of the continent, indicating a lack of these factors for a significant year period. The presence of high values in the rest zones revealed that pr had remained over the whole time from January 1958 to December 2021 (Figure 5).
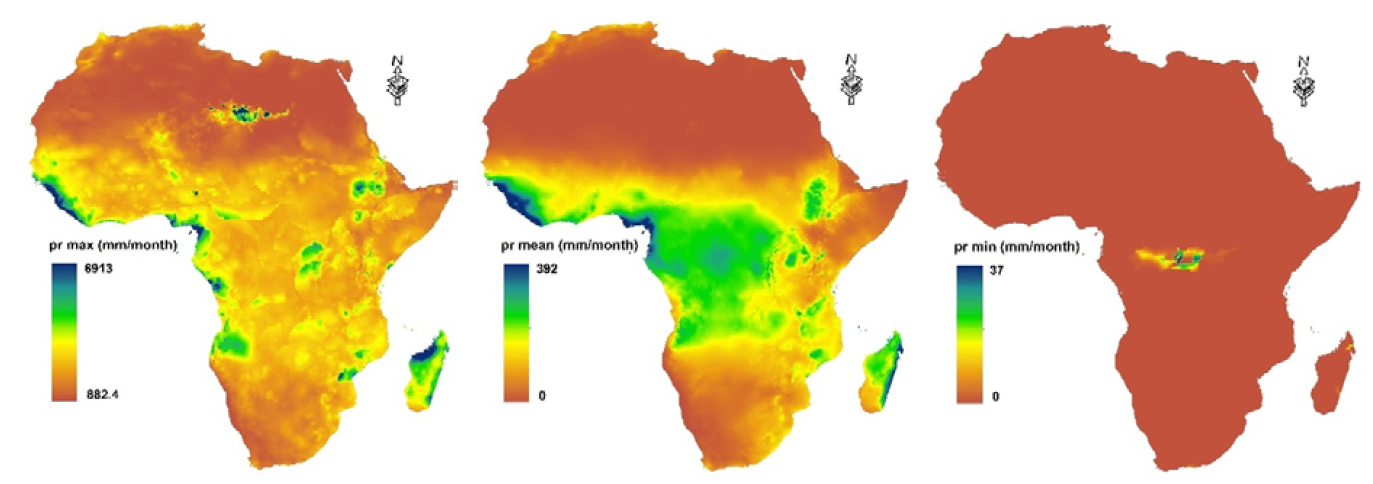
Figure 5: The Max, Mean and Min pr (mm/month) Derived from Africa's TerraClimate Dataset from Jan 1958 to Dec 2021
The ro parameter was altered based on whether the maximum, mean or minimum analyses were performed. As the location and time of the experiment varied, so did the ro values. Except for the changes in water availability in the topsoil layer and plant cover density, the elevation and slope of dry regions vary from those of wet areas, among other things.
The maximum value indicates the most outstanding value recorded for every pixel on the African continent from January 1958 to December 2021. The maximum values varied from 0 millimeters per month to 6633 millimeters per month. The northern section of Africa has very low productivity, which may be attributed to a lack of precipitation, poor topsoil structure, elevation and slope.
The mean value is the average value for every pixel on the continent of Africa over the period from January 1958 to December 2021, calculated for every pixel on the continent of Africa. The mean value is the average value for every pixel on the continent of Africa over the period from January 1958 to December 2021. It was found that the mean values ranged between 0 millimeters per month and 292 millimeters per month. The northern section of Africa is still significantly deficient inro. The problem has gotten worse as it has moved south, along with Somalia and the south-western half of the continent, where there is a lack of precipitation for the majority of the time, poor topsoil structure, elevation and slope, among other factors.
The min value is the value that is the lowest of all possible values calculated for every pixel on the continent of Africa over the period from January 1958 to December 2021. Using this method, it was discovered that the minimum values varied from 0 millimeters per month in length to 2 millimeters per month in length size. The bulk of the continent had shallow or values, which suggests that precipitation was scarce for a considerable part of the year and poor topsoil structure, elevation and slope, among other things. According to the data, the rest zones with greater values indicated that I had lasted for the whole time from January 1958 to December 2021 (Figure 6).
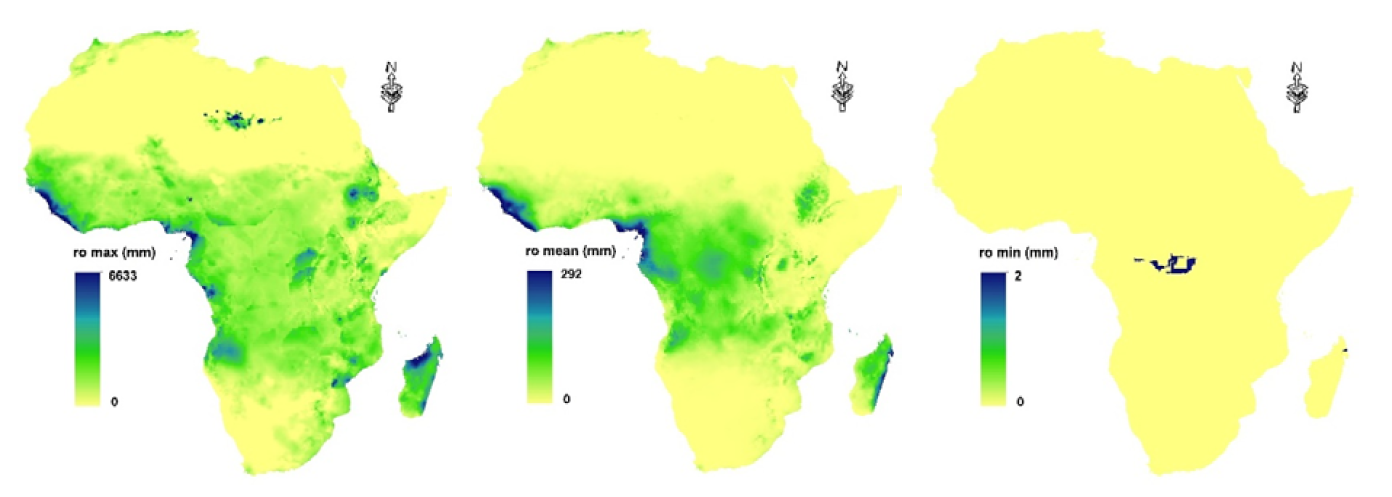
Figure 6: The Max, Mean and Min To (mm/month) Derived from the TerraClimate Dataset from Jan 1958 to Dec 2021 for Africa
The soil parameter was altered based on the analyses. Changes in location and time influenced soil properties. Aside from variations in soil moisture and plant cover density, dry and hot climates need more water than wet and cold climates.
The max value reflects the maximum value for every pixel in Africa from January 1958 to December 2021. The maximum values were 0 to 615 mm/month. Northern Africa has low soil due to a lack of rainfall, soil water content and plant cover.
The mean value is the average value for every pixel in the African continent from January 1958 to December 2021. The mean readings ranged from 0 to 443 millimeters each month. However, the situation has worsened as the problem has gone south, affecting Somalia and the continent’s southwest, lacking precipitation, soil water content and plant cover.
From January 1958 to December 2021, the min value is the lowest of all possible values obtained for every pixel across the continent of Africa. The weakest readings varied from 0 to 195.3 millimeters each month. The bulk of the continent has poor soil values, indicating little precipitation, soil water content and plant cover for most of the year. It was concluded that high values in the rest zones lasted from January 1958 to December 2021 (Figure 7).
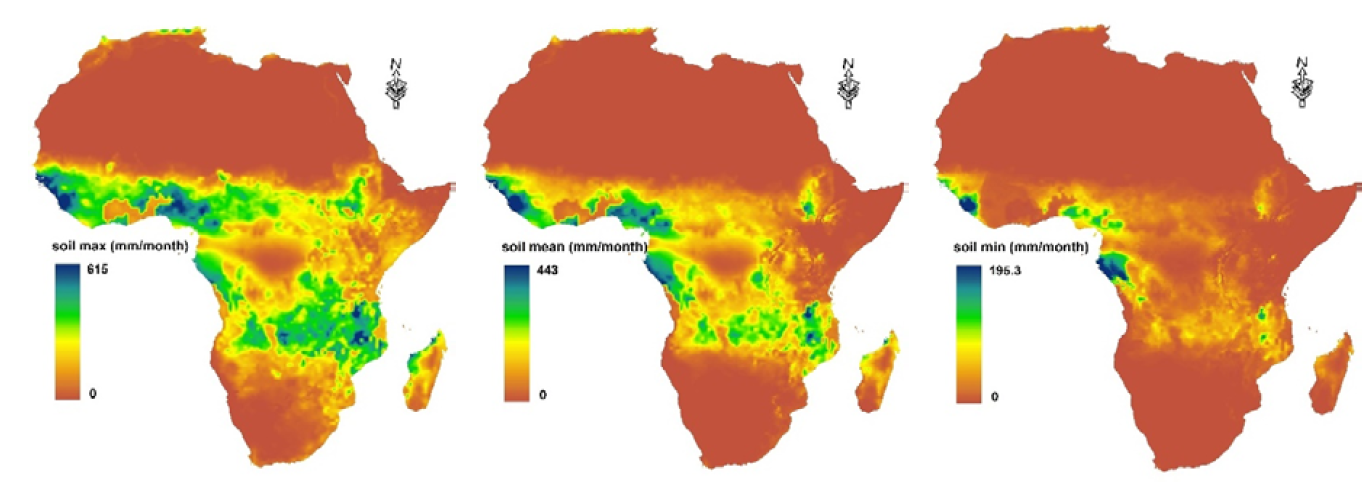
Figure 7: The Max, Mean and Min Soil (mm/month) Derived from Africa's TerraClimate Dataset from Jan 1958 to Dec 2021
The def parameter shifted based on the analysis. Place and time modified the def values. Aside from variations in soil moisture and plant cover density, dry and hot climates need more water than wet and cold climates.
The max value reflects the maximum value for every pixel in Africa from January 1958 to December 2021. There were 33.3 to 466.4 mm/month peak values. Northern Africa has low aet because of lack of precipitation, soil water content, plant cover and a severe environment.
The mean value is the average value for every pixel in the African continent from January 1958 to December 2021. The mean values ranged from 0.9 to 255.6 mm/month. Apart from the challenging environment, the lack of precipitation, soil water content and plant cover is a significant issue in the northern part of Africa.
From January 1958 to December 2021, the min value is the lowest of all possible values obtained for every pixel across the continent of Africa. The minimum values varied from 0 to 143.8 millimeters each month. The bulk of the continent has low def values, indicating enough precipitation, soil water content and plant cover for most of the year. The high-value rest zones showed a brutal climate from January 1958 to December 2021 (Figure 8).
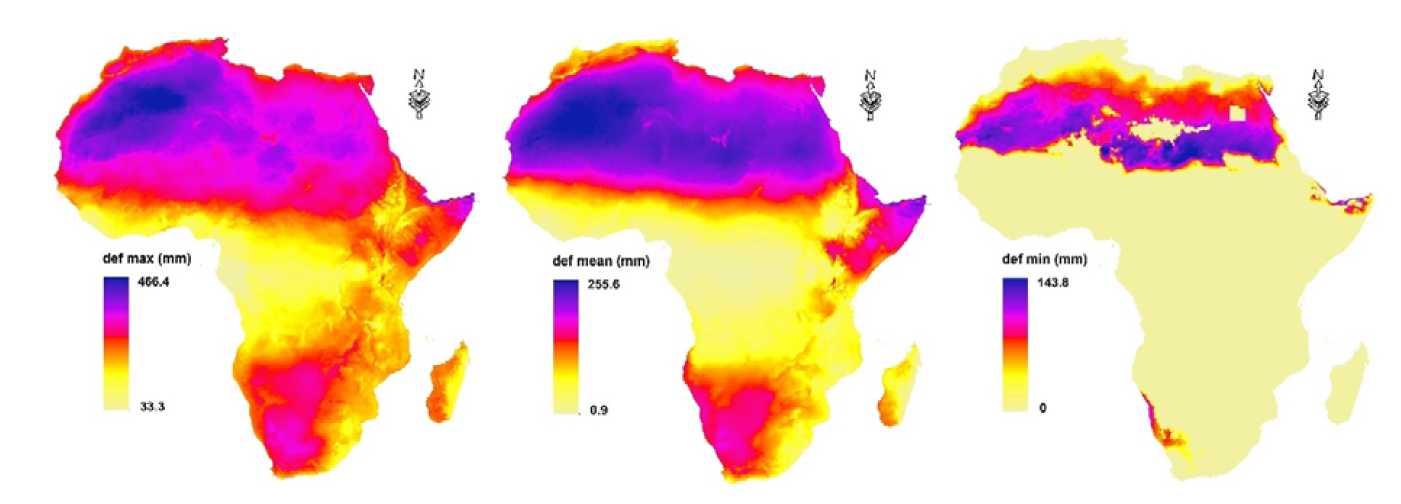
Figure 8: The Max, Mean and Min def (mm/month) Derived from Africa's TerraClimate Dataset from Jan 1958 to Dec 2021
The pdsi max value indicates the highest value for every pixel across the African continent from January 1958 to December 2021, as measured by the pdsi maximum value. The highest possible values varied from 1.2 to 36.6. Whereas the mean value is the average value for every pixel on the continent of Africa from January 1958 to December 2021, determined for every pixel on the continent of Africa. The median value is the mean of the two values. The mean values ranged from -3 to 3.2 points on the scale.
The min value is the value that is the lowest of all possible values calculated for every pixel on the continent of Africa over the period from January 1958 to December 2021. It was discovered that the weakest values had a length ranging from -28.5 to -0.23 in the range (Figure 9).
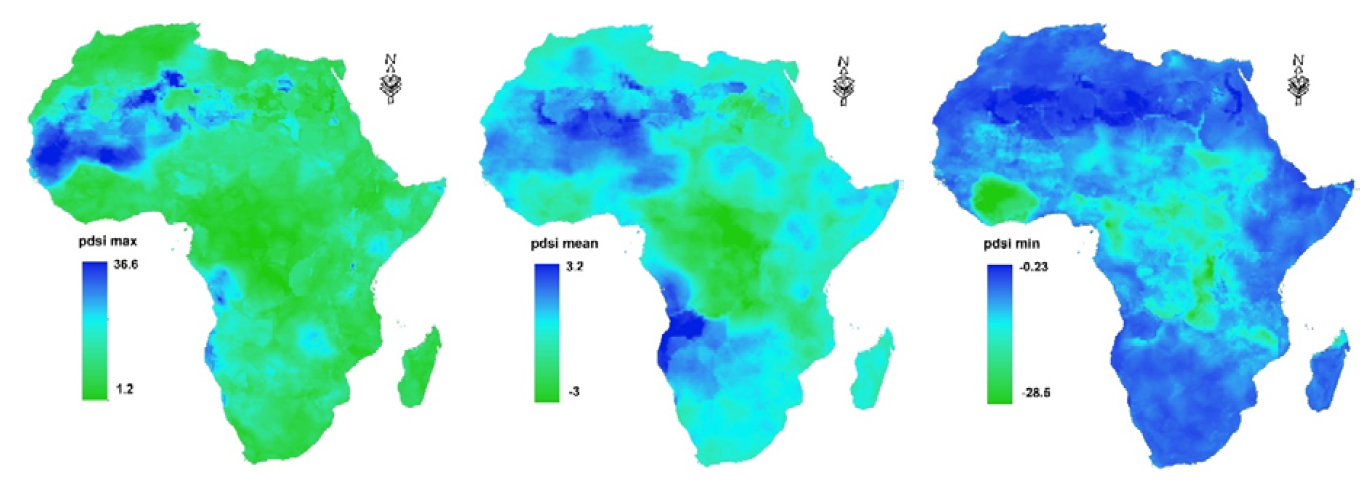
Figure 9: The Max, Mean and Min pdsi Derived from the TerraClimate Dataset from Jan 1958 to Dec 2021 for Africa
Climate Parameters Mapping
Included in the climate parameters are the maximum temperature (Tx) and the minimum temperature (Tm), as well as vapor pressure (vap), precipitation accumulation (pr) and downward surface shortwave radiation (srad). Also included are wind speed and vapor pressure deficit (vpd). The statistical analysis of the mean, maximum and minimum values of the climatic parameters in the TerraClimate dataset from January 1958 to December 2021 determined the absence of potential and standard conditions on the African continent, respectively, from January 1958 to December 2021.
The srad parameter was altered based on whether or not the maximum, mean or lowest analyses were performed. When the location and time of the experiment varied, so did the srad values. The maximum value indicates the most outstanding value recorded for every pixel on the African continent from January 1958 to December 2021. The maximum values varied from 201 watts per square meter to 375 watts per square meter. The northern and southern regions of Africa have greater levels of srad, which implies a hotter environment.
The mean value is the average value for every pixel on the continent of Africa over the period from January 1958 to December 2021, calculated for every pixel on the continent of Africa. The mean value is the average value for every pixel on the continent of Africa over the period from January 1958 to December 2021. The mean values ranged from 133 watts per square meter to 272 watts per square meter. Even if srad levels in the northern area of Africa remain high, the issue has become worse as the region has migrated south, alongside Somalia and the southern part of Africa, which experiences severe weather for most of the year.
The min value is the value that is the lowest of all possible values calculated for every pixel on the continent of Africa over the period from January 1958 to December 2021. It was discovered that the weakest values varied from 35 to 211 w/m2 in length, with the maximum values being 211 w/m2. The low srad levels imply that it is wintertime (Figure 10).
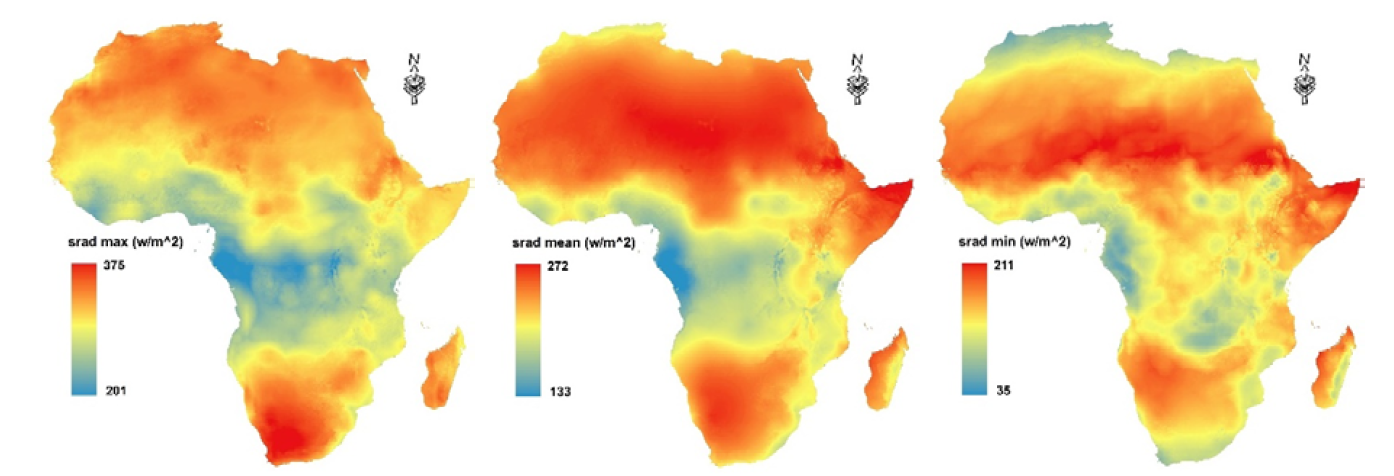
Figure 10: The Max, Mean and Min srad (w/m2) Derived from Africa's TerraClimate Dataset from Jan 1958 to Dec 2021
The Tx parameter was altered based on the maximum, mean and minimum assessments, among other things. The Tx values changed as a result of changes in location and timing. Aside from changes in water availability due to variances in solar radiation, topsoil layer and plant cover density, Tx in hot and cold climates vary.
The maximum value reflects the most excellent value for every pixel across the African continent from January 1958 to December 2021. The maximum temperatures varied from 12.5 degrees Celsius to 51.9 degrees Celsius. The northern section of the mainland (Sub-Saharan Africa) has a higher high Tx value, reflecting the severe environment.
The mean value is the average value for every pixel on the continent of Africa throughout the period from January 1958 to December 2021, determined for every pixel on the continent of Africa. The mean value is calculated for every pixel on the continent of Africa. The average temperatures ranged from 4.2 degrees Celsius to 40.8 degrees Celsius. The northern region of Africa is still suffering from high Tx. The situation has become worse as the continent has pushed south, along with Somalia, which has a severe environment for most of the year.
The min value is the value that is the lowest of all possible values computed for every pixel on the continent of Africa for the period from January 1958 to December 2021. It was discovered that the weakest temperatures varied in length from -15 to 36.6°C. Most of the continent had high Tx values, indicating that it experienced severe weather for a significant period of the year. The temperature in the rest zones is relatively low (Figure 11).
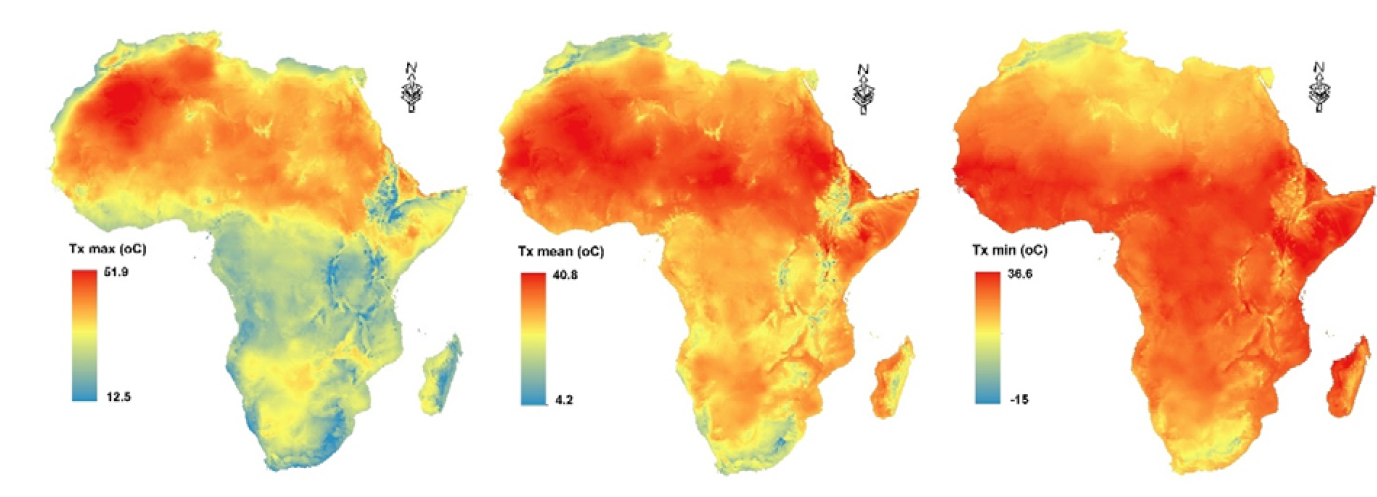
Figure 11: The Max, Mean and Min Tx (°C) Derived from Africa's TerraClimate Dataset from Jan 1958 to Dec 2021
The Tm parameter changed due to the outcomes of the maximum, mean and minimum evaluations, among other factors. The Tm values changed due to the changes in location and timing. Aside from variations in water availability due to solar radiation, topsoil layer and plant cover density, Tx varies in hot and cold regions.
The maximum value is the highest possible value for every pixel in the African continent from January 1958 to December 2021. The lowest temperatures ranged from 2.9 degrees Celsius to 36.1 degrees Celsius. The northern region of the mainland (Sub-Saharan Africa) has an unusually high Tm value, which reflects the harsh climate there.
The mean value is the average value for every pixel on the continent of Africa throughout the period from January 1958 to December 2021, as calculated for every pixel on the continent of Africa. Every pixel in the continent of Africa is subjected to a mean value calculation. The average temperatures varied from -8.6 to 28.5 degrees Celsius. The northern area of Africa is still suffering from high Tm and the issue has become worse as the continent has moved southward, including Somalia, which has a harsh climate for most of the year. Only high-elevation locations have lower Tm.
The min value is the value that is the lowest of all possible values calculated for every pixel on the continent of Africa over the period from January 1958 to December 2021. It was determined that the weakest temperatures ranged in length from -25.8 to 23.8 degrees Celsius. The majority of the continent had high Tm values, suggesting that it was subjected to severe weather for a significant portion of the year. The temperature in the rest zones is relatively low, especially in high-elevation places (Figure 12).
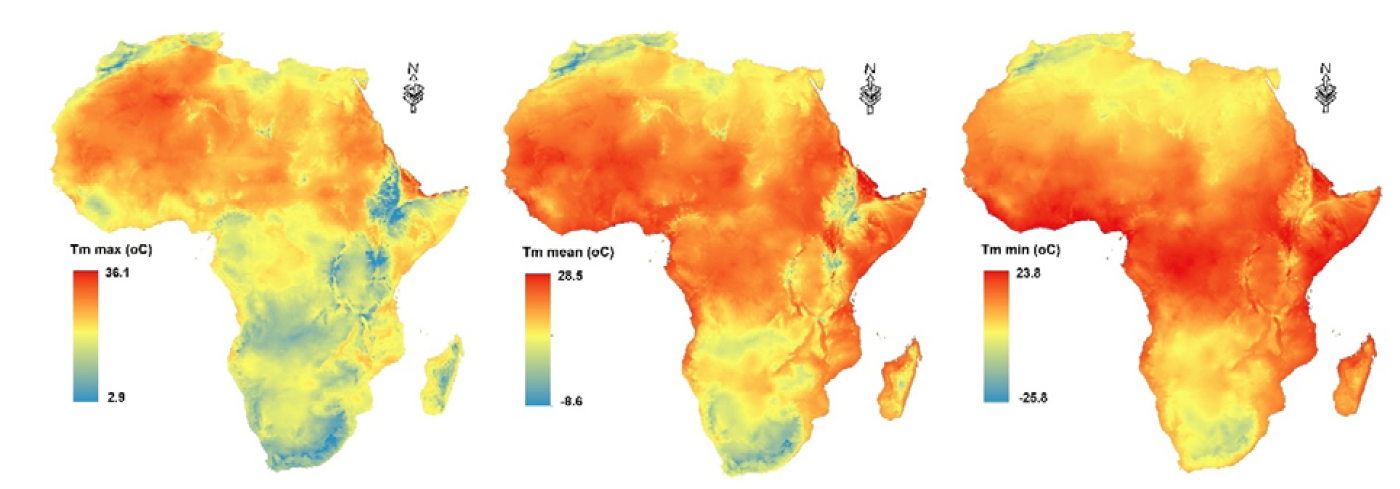
Figure 12: The Max, Mean and Min Tm (°C) Derived from Africa's TerraClimate Dataset from Jan 1958 to Dec 2021
The vpd parameter shifted based on the analysis. The valid values fluctuated with location and time. Aside from variations in soil moisture and plant cover density, dry and hot climates need more water than wet and cold climates.
The max value reflects the maximum value for every pixel in Africa from January 1958 to December 2021. Its maximum value was 8.3 kpa. Northern Africa has a greater vpd due to less precipitation, soil water content and plant cover.
The mean value is the average value for every pixel in the African continent from January 1958 to December 2021. The range was 0 to 4.2 kpa.
From January 1958 to December 2021, the min value is the lowest of all possible values obtained for every pixel across the continent of Africa. The lowest values were determined to be -0.6 to 2.1 kpa. There was high precipitation, soil water content and plant cover throughout much of the continent for most of the year. The high-value rest zones indicated continuous water consumption from January 1958 to December 2021 (Figure 13).
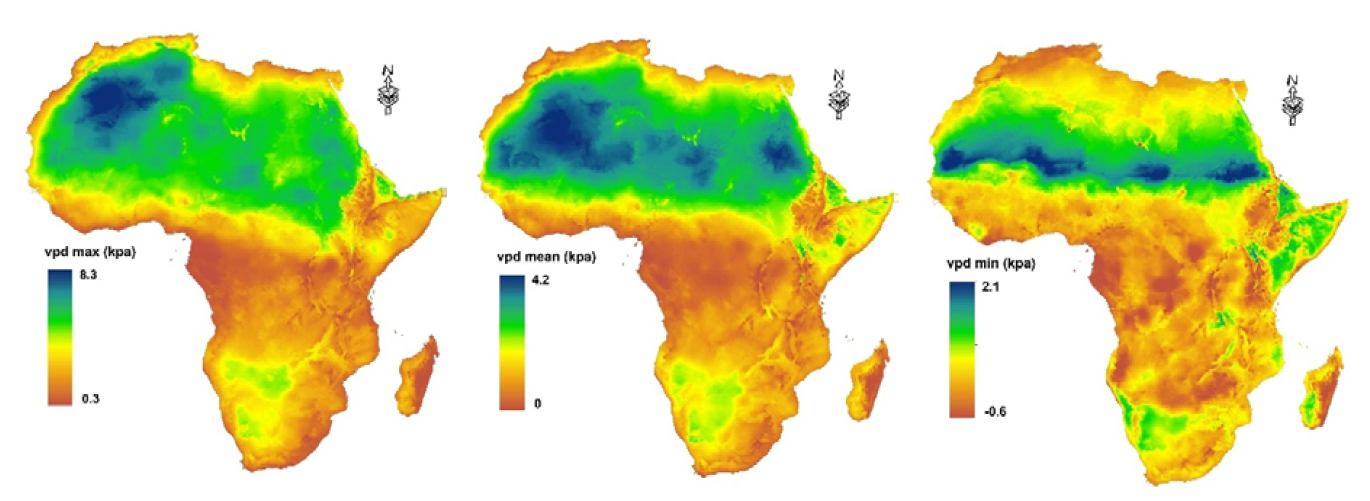
Figure 13: The Max, Mean and Min vpd (kPa) Derived from the TerraClimate Dataset from Jan 1958 to Dec 2021 for Africa
The vap parameter was altered based on whether or not the maximum, mean or minimum analyses were performed. As the location and time of the experiment varied, so did the vap values. According to the International Water Association, aside from changes in water availability in the topsoil layer and plant cover density, water consumption in dry and hot climates varies from that in wet and cold temperatures.
The maximum value corresponds to the highest possible value for every pixel in Africa between January 1958 and December 2021. It reached a maximum pressure of 4.8 kpa. As a result of the lower precipitation, soil water content and plant cover in Northern Africa, the vpd is higher.
From January 1958 to December 2021, the mean value was calculated as the average value for every pixel in the African continent. The pressure ranged from 0.3 to 3.1 kpa.
From January 1958 to December 2021, the min value is the lowest of all possible values acquired for every pixel across the continent of Africa during that period. The most downward pressures were between 0 and 2.7 kpa on the scale. Throughout most of the continent, there was abundant precipitation, high soil water content and dense plant cover for the majority of the year. The high-value rest zones showed constant water usage from January 1958 to December 2021, which was used continuously (Figure 14).
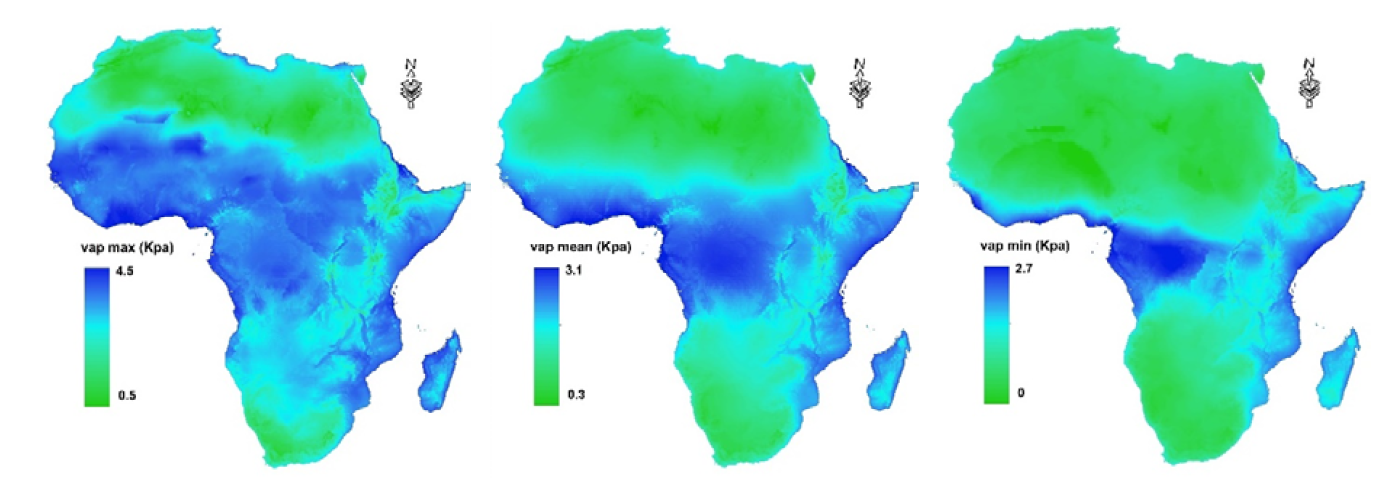
Figure 14: The Max, Mean and Min vap (kPa) Derived from Africa's TerraClimate Dataset from Jan 1958 to Dec 2021
The vs. max value represents the highest value during the period from Jan 1958 to Dec 2021 for every pixel over the African continent. The max values ranged from 1.34 to 12.5 m/s. The northwest part of Africa and Somalia is higher than other parties.
The mean value is the average value for every pixel on the continent of Africa throughout the period from January 1958 to December 2021, calculated for every pixel on the continent of Africa. The mean values varied from 0.5 to 7.9 m/s. The northern section of Africa and Somalia are still relatively high vs. most of the time.
For every pixel on the continent of Africa over the period from January 1958 to December 2021, the min value is the value that is the lowest of all possible values determined for every pixel on the continent of Africa. It was found that the minimum values ranged from 0 to 4.55 m/s in length. The majority of the continent had very low vs. values (Figure 15).
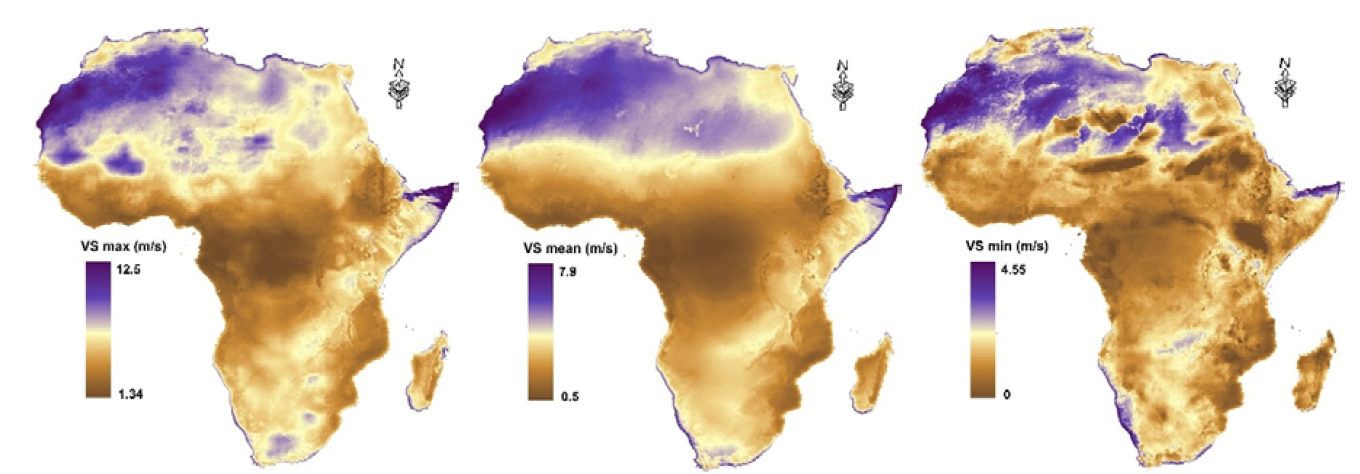
Figure 15: The Max, Mean and Min vs. (m/s) Derived from Africa's TerraClimate Dataset from Jan 1958 to Dec 2021
Since its inception, the cloud computing idea has evolved dramatically. It allows for speedier, more cost-effective corporate operations in today's highly competitive image analysis and remote sensing sector. Cloud computing can thereby speed up the development of new services. Geospatial analysis platform Google Earth Engine allows users to examine and study satellite images of our world. Earth Engine is used for remote sensing research, disease outbreak prediction and natural resource management. Your kids may use this resource to join the conversation and become data scientists. The GEE platform has many datasets for climate, water, Agriculture and environmental studies. Minimum, maximum and mean analyses are performed on the TerraClimate parameters for the entire dataset and the results are used to map the African continent's lack of resources, potential and standard conditions, in that sequence. There are some considerations for using TerraClimate, i.e., weather patterns such as temperature and precipitation are inherited from parent records. In the absence of these underlying datasets, TerraClimate should not be used to predict trends independently. When used with more acceptable resolutions than their source datasets, TerraClimate cannot capture the temporal variability in orographic precipitation ratios and inversions. The water balance model is oversimplified and it makes use of a static reference landcover, which ignores the unpredictability of plant growth.
Janneh, A. and J. Ping. Africa as a Pole of Global Growth. Economic Commission for Africa and African Union Commission, 2012.
Amani, M. et al. “Google Earth Engine Cloud Computing Platform for Remote Sensing Big Data Applications: A Comprehensive Review.” IEEE Journal of Selected Topics in Applied Earth Observations and Remote Sensing, vol. 13, 2020, pp. 5326-5350.
Sheffield, J. et al. “Development of a 50-Year High-Resolution Global Dataset of Meteorological Forcings for Land Surface Modeling.” Journal of Climate, vol. 19, 2006, pp. 3088-3111.
Abatzoglou, J.T. “Development of Gridded Surface Meteorological Data for Ecological Applications and Modeling.” International Journal of Climatology, vol. 33, 2013, pp. 121-131.
Harris, I. et al. “Updated High-Resolution Grids of Monthly Climatic Observations-The CRU TS3.10 Dataset.” International Journal of Climatology, vol. 34, 2014, pp. 623-642.
Kobayashi, S. et al. “The JRA-55 Reanalysis: General Specifications and Essential Characteristics.” Journal of the Meteorological Society of Japan, ser. II, vol. 93, 2015, pp. 5-48.
Beck, H.E. et al. “MSWEP: 3-Hourly 0.25° Global Gridded Precipitation (1979-2015) by Merging Gauge, Satellite and Reanalysis Data.” Hydrology and Earth System Sciences, vol. 21, 2017, pp. 589-615.
Thornton, P.E. et al. “Generating Surfaces of Daily Meteorological Variables over Large Regions of Complex Terrain.” Journal of Hydrology, vol. 190, 1997, pp. 214-251.
Hijmans, R.J. et al. “Very High Resolution Interpolated Climate Surfaces for Global Land Areas.” International Journal of Climatology, vol. 25, 2005, pp. 1965-1978.
Daly, C. et al. “Physiographically Sensitive Mapping of Climatological Temperature and Precipitation across the Conterminous United States.” International Journal of Climatology, vol. 28, 2008, pp. 2031-2064.
Ficklin, D.L. et al.“The Influence of Climate Model Biases on Projections of Aridity and Drought.” Journal of Climate, vol. 29, 2015, pp. 1269-1285.
Wang, T. et al. “Locally Downscaled and Spatially Customizable Climate Data for Historical and Future Periods for North America.” PLOS ONE, vol. 11, 2016.
Karger, D.N. et al.“Climatologies at High Resolution for the Earth’s Land Surface Areas.” Scientific Data, vol. 4, 2017.
Potter, K.A. et al.“Microclimatic Challenges in Global Change Biology.” Global Change Biology, vol. 19, 2013, pp. 2932-2939.
Root, T.L. and S.H. Schneider. “Strategic, Cyclical Scaling: Bridging Five Orders of Magnitude Scale Gaps in Climatic and Ecological Studies.” Integrated Assessment, vol. 3, 2002, pp. 188-200.
Franklin, J. et al. “Modeling Plant Species Distributions under Future Climates: How Fine Scale Do Climate Projections Need to Be?” Global Change Biology, vol. 19, 2013, pp. 473-483.
Fick, S.E. and R.J. Hijmans. “WorldClim 2: New 1-km Spatial Resolution Climate Surfaces for Global Land Areas.” International Journal of Climatology, vol. 37, 2017, pp. 4302-4315.
Schimel, D.S. et al. “Equilibration of the Terrestrial Water, Nitrogen and Carbon Cycles.” Proceedings of the National Academy of Sciences of the United States of America, vol. 94, 1997, pp. 8280-8283.
Wolock, D.M. and G.J. McCabe. “Explaining Spatial Variability in Mean Annual Runoff in the Conterminous United States.” Climate Research, vol. 11, 1999, pp. 149-159.
Abatzoglou, J.T. et al. “Tracking Interannual Streamflow Variability with Drought Indices in the U.S. Pacific Northwest.” Journal of Hydrometeorology, vol. 15, 2014, pp. 1900-1912.
Willmott, C.J. et al. “Climatology of the Terrestrial Seasonal Water Cycle.” Journal of Climatology, vol. 5, 1985, pp. 589-606.
Adam, J.C. et al. “Implications of Global Climate Change for Snowmelt Hydrology in the Twenty-First Century.” Hydrological Processes, vol. 23, 2009, pp. 962-972.
Haddeland, I. et al. “Multimodel Estimate of the Global Terrestrial Water Balance: Setup and First Results.” Journal of Hydrometeorology, vol. 12, 2011, pp. 869-884.
McCabe, G.J. and D.M. Wolock. “Temporal and Spatial Variability of the Global Water Balance.” Climatic Change, vol. 120, 2013, pp. 375-387.
Williams, A.P. et al. “Temperature as a Potent Driver of Regional Forest Drought Stress and Tree Mortality.” Nature Climate Change, vol. 3, 2013, pp. 292-297.
El Fadli, K.I. et al. “World Meteorological Organization Assessment of the Purported World Record 58°C Temperature Extreme at El Azizia, Libya (13 September 1922).” Bulletin of the American Meteorological Society, vol. 94, no. 2, 2013, pp. 199-204.
Wilson, A.F. Cooperation in International Waters in Africa: Annual Report FY2017. World Bank, 2017.
Shah, E. et al. “The UN World Water Development Report 2016, Water and Jobs: A Critical Review.” Development and Change, vol. 49, no. 2, 2018, pp. 678-691.
Gachanja, A. et al. Africa’s Water Quality: A Chemical Science Perspective. Royal Society of Chemistry, 2010.
Dai, A. “Temperature and Pressure Dependence of the Rain-Snow Phase Transition over Land and Ocean.” Geophysical Research Letters, vol. 35, 2008.
