
+91 6002993949
submission@iarconsortium.org
Open Access
ISSN (Print) : 2788-9394
ISSN (Online) : 2788-9408
This study involved the preparation of a New Complexes Schiff bases (L): 2-((3-ethoxy-4-hydroxybenzylidene) amino) benzoic acid, made using the identical precursor for the electron acceptor (A): The molar ratio of the reaction between 3-ethoxy-4-hydroxy benzaldehyde and electron donors (Ds) anthranilic acid was 1:1. The Schiff base ligands were used to react the salts of the Co(II), Ni(II), Cu(II), Zn(II) and Cd(II) complexes. The complexes Measurements of molar conductivity are not electrolytic. CHN analysis of the elements, FTIR spectra, mass spectra, 1HNMR and 13CNMR were used to characterize the Schiff base ligand (L) and the same complexes samples in order to corroborate the molecular structures. The molecular structures determine the optical and biological activity. The tetrahedral geometry surrounding both of the metals and the curved planar geometry around Cu (II).
The azomethine imine functioning group (-HC=N) is present in Schiff bases organic substances and is created when a carbonyl compound reacts with primary amines and ligating metals through lone pair in the N atom [1]. The group (C=N) is regarded as a significant class of ligands, having been thoroughly investigated in coordination research and possessing numerous industrial and biological uses [2]. The percentage of donating atoms contained within the ligand determines the mono/polydentate bridging. Schiff compounds are extensively used in many technological domains and their biological activity is contingent upon their molecular structure [3,4]. When electrons (es)- acceptors (A) and electrons (es)-donors (D) interact following a partial or total transfer of electron (e) density from D to A, a Charge-Transfer Complex (CTC) or molecules compound known as a schiff base is created. The stability attained a high electron affinity of A and a low desorption potential for the person who donated [5]. Because they can function as enzymes in the conversion to hydrogen of olefins, schiff bases are useful for antibacterial, antifungal and anti-tumor drugs [6-8]. In this work, we synthesized the Schiff bases complexes from anthranilic acid and 3-ethoxy-4-hydoxy benzaldehyde.
Experimental
Materials and Methods
All predecessors and reactants that are bought from reputable and certified businesses are pure chemical substances that are utilized just as supplied, requiring no additional purifying.
Schiff base ligand preparation and characterisation [9]
L: Scheme 1 ethanolic solution Anthranilic acid (0.495 gm, 0.00361 mol) added slowly dropwise to the ethanolic solution 3-ethoxy-4-hydroxy benzaldehyde (0.6 gm, 0.00361 mol) in 100 mL flat bottom flask with the addition of glacial acetic acid by drops. The solution refluxed at 75°C for 10 h. The color changes and then it is cooled. A precipitate is formed after leaving it for a day with a dark yellow color. It is filtered, washed with ethanol and dried., m.p. 166-168°C
Metal Complex Synthesis
After dissolving a solution of 0.00105 mol the Schiff base ligand in 15 ml of hot 100% ethanol, a solution of 0.00105 mol corresponding metal chlorides was added. The reaction was finished after the solution was refluxed on a mantle with a water condenser for around 4 hours. Following chilling, filtering and washing with ethanol and diethyl ether, respectively, the final product (Scheme 2) was taken out as a precipitate once the concentration had dropped to half of its original volume.
All the formed Compund conducted at the Central Laboratory of Chemistry Department of the College of Sciences, the University of Kirkuk-Kirkuk-Iraq and the photon center Bagdad-Iraq with the use of electronic, CHN elemental measurements, molar permeability, FTIR IR and 1H/13CNMR spectroscopies, Scanning Electron Microscopy (SEM) and powder XR diffraction (p-XRD) in both the solid and liquid states. Melting temperature: SMP30 melting temperature FTIR spectra: FTIR-ALFA Burker-27 Infrared Spectrophotometer in wavenumber range (400-4000 cm-1); mass spectra: Agilent 5975C; apparatus: Stuart Co.; (CHN) element analyses: Thermo Fisher, Eager300.1H-NMR and 13C-NMR: Bruker AVANCE (400 MHz) spectrometer, Surface analysis by TESCAN MIRA3.
The Schiff base ligand and complexes used the well agar diffusion experiment to check for their antibacterial properties against specific bacterial strains. In order to inoculate the test strains, sterilized medium was put onto 25 mL glass Petri dishes that had been sterilized and hardened at room temperature. microbial suspension made in sterile saline that is 1.5*105 CFU mL‒1 or McFarland 0.5 by standard solution. A sterile cotton swab bathed in the modified solution was splashed onto the dried agar surface and allowed to dry for 15 minutes after the turbidity of the added inoculum suspension had been adjusted for 15 minutes with the lid closed. Using a sterile borer, create a 6-mm-diameter well in cemented medium sample diluted in DMSO (20 mg/mL) (control). Each well received 100 μL of the sample, which was then incubated for 24 and 48 hours at 37°C. Measured in triplicate, the inhibition zone (mm) [10,11].
Scheme 1: Preparation outline scheme of ligand (L)
Scheme 2: Prepartion outline scheme of Complexes
Using a PGT92+ UV-Visible spectrophotomer constructed using Beer's lambert law, the optical activity in DMSO solutions at wavelengths between 190 and 900 nm was measured in a 1.0 cm quartze cell [12]. The entire wavelength curves of the electronic spectra were captured.
The produced ligand and complex's chemical and physical characteristics are compiled in Table 1. The ligands for Schiff bases (L) and metals complexes' physicochemical characteristics are shown in Table 1.
A molecular framework of the compound ligand (L) and metal confirmed by hydrogen bonding (H.B) In addition to metal, interactions between nearby moieties increased the m.p. of (L) [13]. The stoichiometry associated with the compound's production reaction was validated by the quantitative micro component CHN analysis, which revealed agreement between the calculated and observed values [14]. It is suggested that the Schiff chemical ligands in sunscreen lotions must dissolve in the appropriate solvent in order to influence the antibacterial activity and the spectral shift of the band position [15].
Various solvents tested for the solubility of (L) and complexes as shown in Table 2.
Characterization Schiff Base Ligand and Metal Complex
FTIR spectra of L and complexes showed in the Figure 1-5.
Table 3 collected the functional groups in each ligand and complexes based by the vibrational bands of bonds as molecule diatomic simple harmonic oscillator.
Figure 3-4 showed 1HNMR spectra confirmed types of protons of ligands in DMSO solvent.
1HNMR spectra of ligand (L). triple 1.392 ppm CH3; quadrat 4.108 ppm OCH2; doublets, triplets (8.078, 7.909, 8.059, 7.775 ppm) aromatic protons of (1), (7.417, 7.367, 6.736 ppm): aromatic protons, multiple (6.88, 7.26 ppm: 8.487 ppm (N=C-H); singlet 9.971ppm, singlet 10.207 ppm OH carboxylic (Figure 5).
1HNMR spectra of ligand (L). triple 1.325 ppm CH3; quadrat 4.059 ppm OCH2; doublets, triplets (8.306, 7.396, 8.261, 7.691 ppm) aromatic protons of (1), (7.671, 7.274, 6.726 ppm): aromatic protons of (2); 8.462 ppm (N=C-H); singlet 9.733ppm, singlet 10.190 ppm OH carboxylic (Figure 3).
Table 4 and 5 collected chemical shifts ligand (L) and M5 Complex to the numbers and the types of protons the assignments [17].
Figure 7-9 showed 13CNMR spectra confirmed numbers and types of carbon atoms in the Ligand (L) and complexes in DMSO solvent [18].
13CNMR spectra of ligand(L): Signal at 40.36 ppm: DMSO, 15.13ppm 1CH3, 64.40ppm O2CH2, (147.51, 134.69, 129.16, 124.05, 116.79, 115.91, 112.26, 110.05 ppm), aromatic carbon(C3-C11), 149.38 ppm phenolic13C-OH, 147.75 ppm 12C-OCH2, 170.09 ppm N=15C-H. 153.67 ppm C-N, 191.45 ppm HO-16C=O (Figure 4).
13CNMR spectra of M5: Signal δ 40.36 ppm: DMSO, 15.02ppm 1CH3, 64.30 ppm O2CH2, (147.51, 134.12, 129.12, 126.31, 116.79, 115.01, 112.26, 110.35 ppm), aromatic carbon (C3-C11), 151.82 ppm phenolic 13C-OH, 147.70 ppm 12C-OCH2, 170.38 ppm N=15C-H. 153.61 ppm C-N, 191.51 ppm HO-16C=O (Figure 5).
Table 5 collected the chemical shift δ (ppm) for the NO. and types of carbon atoms assigned for ligand and M5 complex [18,19].
The molecular weight (Mw.) confirmed from mass spectra, represented in the Figure 6. The observed M.wt. 287.3 gmol‒1 was agreement is good with cal. M.wt. 285.29 gmol‒1. The fragmentation patterns at ration of (m/z) ratio 269.6 loss H2O, 241.4 fragmentation from OCH2CH3 and 119.8 bond breaking at one side benzene ring [20].
Figure 7 shows the molecular size (M.wt.) of [Zn(L)Cl2], which was verified by mass spectra. Cal and the measured Mw of 424.2 gmol‒1 agreed well. 423.3 gmol‒1 M.wt. The decomposition patterns at the mass/charge ratio of (m/z) are as follows: fragmentation from the benzene ring 77.6; loss of Zn, 287.4 and mass/charge ratio 359.1 [20].
The particle size and morphology of (L) and M1, M3 obtained from SEM micrographs, Figure 8-10.
Table 1: The produced ligand and complex's chemical and physical characteristics are compiled
| Compound | Molecular formula | Mw. | m.p. | µeff (B.M) | Color | Yield (%) | CHN elemental analysis observed, calculated | ||
C% | H% | N% | |||||||
L | C16H15NO4 | 285.2 | 166-167 | - | Dark yellow | 89 | 67.36 (66.79) | 5.3 (5.11) | 4.91 (4.52) |
M1 | C16H18ClNCoO6 | 414.6 | 251 | 4.03 | Olive green | 89 | 46.34 | 4.38 | 3.38 |
M2 | C16H15Cl2NCuO5 | 419.3 | 187 | 1.86 | Dark brown | 81 | 45.83 | 4.33 | 3.34 |
M3 | C16H18 ClNNiO6 | 414.4 | 291 | 3.65 | Light brown | 91 | 48.47 (48.11) | 4.07 (3.68) | 8.94 (8.51) |
M4 | C16H15Cl2NZnO4 | 422.3 | 236 | Zero | Brown | 83 | 45.58 | 3.59 | 3.32 |
M5 | C16H15Cl2NCdO4 | 468.7 | 284 | Zero | Yellow brown | 71 | 41.01 | 3.23 | 2.99 |
M1: [Co(L)Cl2], M2: [Cu(L)Cl2], M3: [Ni(L)Cl2], M4: [Zn(L)Cl2], M5: [Cd(L)Cl2]
Table 2: Solubility data of prepared vehicles
Cyclohexane | DMSO | DMF | CHCl3 | Acetone | Hot ethanol | Ethanol | Ligand |
+ | + | + | + | - | + | - | L |
+ | + | + | ÷ | ÷ | + | ÷ | M1 |
÷ | + | ÷ | ÷ | - | ÷ | - | M2 |
÷ | + | + | ÷ | ÷ | ÷ | ÷ | M3 |
- | + | + | - | - | + | ÷ | M4 |
÷ | + | + | ÷ | - | ÷ | - | M5 |
N.B. +, ÷, - (soluble, partially soluble and insoluble respectively)
Figure 1: FTIR spectra of L
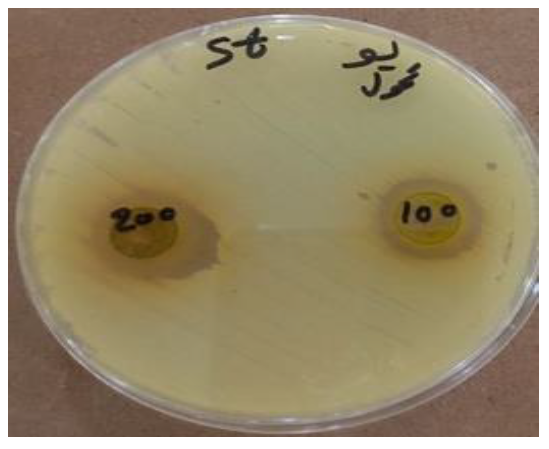
Figure 2: FTIR spectra M2 and M5
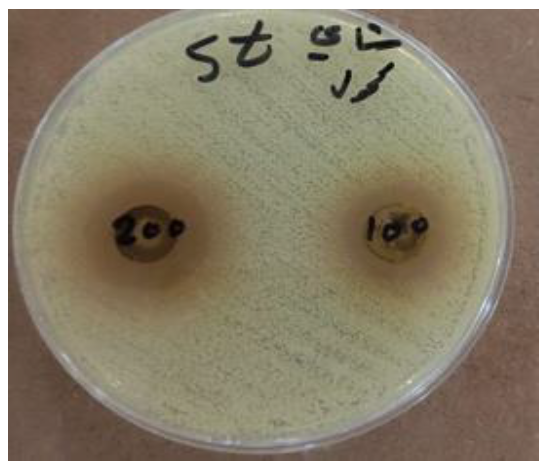
Figure 3: 1HNMR Spectra of (L)
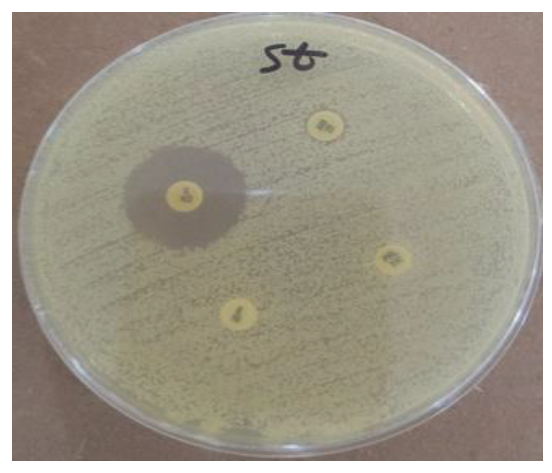
Figure 4: 1HNMR Spectra of (M5)
Figure 5: 1H NMR spectrum of ligand (L)
Figure 6: Mass spectra of ligand (L)
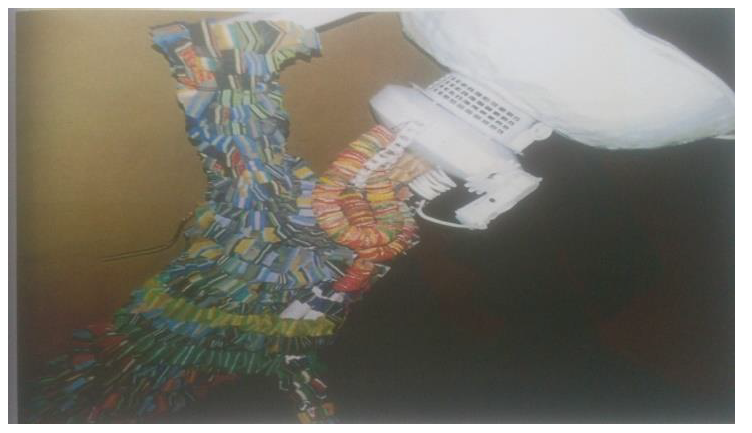
Figure 7: Mass spectra of M5
Table 3: FTIR Assigned vibrational bands [16]
ῡ(M-N) | ῡ(M-O) | ῡ(C=C) | ῡ(C=O) | ῡ(C=N) | ῡ((NH2) Sym & asy | ῡ(OH) | Ligand |
- | - | 1522 | 1620 | 1577 | - | - | L |
578 | 464 | 1513 | 1657 | 1584 | - | 3418 | M1 |
577 | 497 | 1517 | 1647 | 1574 | - | 3307 | M2 |
459 | 585 | 1516 | 1673 | 1580 | - | 3302 | M3 |
490 | 566 | 1558 | 1618 | 1596 | - | 3375 | M4 |
460 | 575 | 1576 | 1651 | 1590 | - | 3467 | M5 |
Table 4: Assigned 1HNMR of Schiff base ligands (L) and M5
δ (ppm) M5 | δ (ppm) L | Assignments |
7.671, 7.274, 6.726 (1H),s (2) 8.306, 7.396(1H),t, 8.261,7.691(1H),d (1) | 7.417, 7.367, 6.736 (1H), s (2) 8.078, 7.909(1H),t, 8.059,7.775(1H),d (1) | Ar-CH |
1.325 (3H), t | 1.392 (3H), t | CH3 |
4.059 (2H), q | 4.108 (2H), q | OCH2 |
8.462 ( 1H), s | 8.487 ( 1H), s | -CH=N |
9.733 (1H), s | 9.971 (1H), s | OH Phenolic |
10.190 (1H), s | 10.207 (1H), s | OH arboxylic |
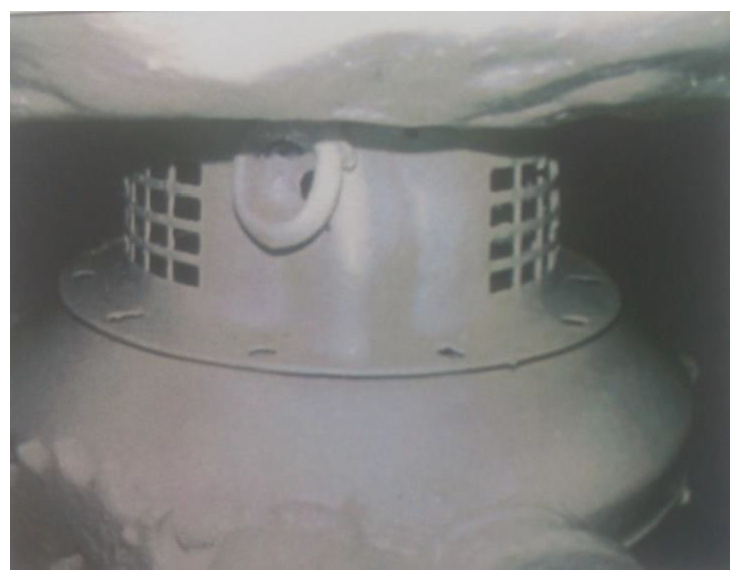
Figure 8: SEM micrograph of ligand (L)
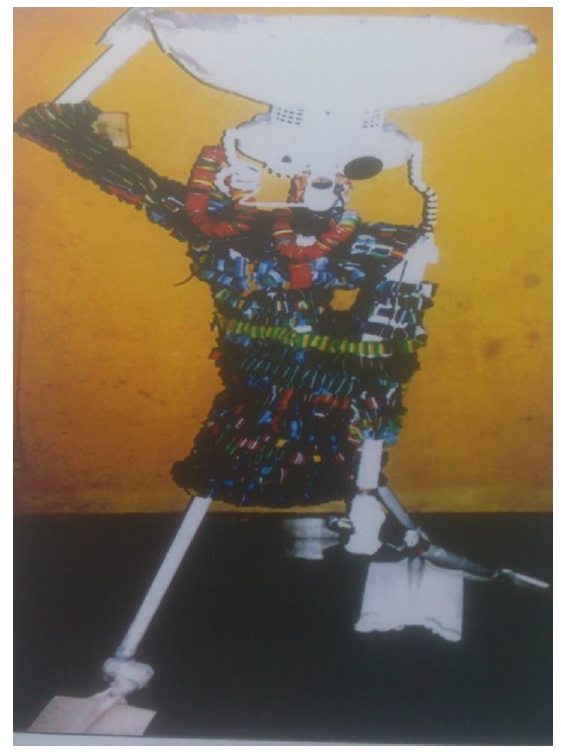
Figure 9: SEM micrograph of M3
Figure 10: SEM micrograph of M1
Table 5: Assigned 13CNMR of Schiff base ligands (L) and M5
δ (ppm) M5 | δ (ppm) L | Assignments |
15.13 | 15.02 | CH3 |
64.40 | 64.30 | OCH2 |
112-147.51 | 110.35-134.12 | Ar-CH |
170.09 | 170.38 | -CH=N |
149.38 | 151.82 | C-OH |
147.75 | 147.70 | C-O-CH2 |
153.67 | 153.61 | C-N |
191.45 | 191.51 | HO-C=O |
Samples measured by a Scanning Electron Microscope (SEM) appear to be in the form of variously shaped plates and confirmed the Nano scale particle size (nm). The importance of this structure lies in its potential applications. The layered structure also provides a high surface area - to-volume ratio and large area surface, enabling it to enhance interactions between molecules and other materials. These properties are useful in a variety of applications, such as catalysis, sensing and energy storage [5].
Figure 11: PXRD pattern of ligand (L)
Figure 12: PXRD pattern of M2
Figure 13: PXRD pattern of M3
Table 6: X'Pert High Score Plus Version 3.0.5
Pos. [°2Th.] | Height [cts] | FWHM [°2Th.] | d-spacing [Å] | Rel. Int. [%] | Tip width [°2Th.] | Partical Size [nm] |
L | ||||||
9.6027 | 1661.42 | 0.2880 | 9.20295 | 9.97 | 0.3456 | 27.69472 |
11.5648 | 2415.12 | 0.2880 | 7.64563 | 14.49 | 0.3456 | 27.73867 |
13.8398 | 1625.69 | 0.2400 | 6.39348 | 9.75 | 0.2880 | 33.36005 |
16.8289 | 4832.79 | 0.2880 | 5.26403 | 28.99 | 0.3456 | 27.89784 |
17.7697 | 4705.66 | 0.3360 | 4.98740 | 28.23 | 0.4032 | 23.94232 |
18.9023 | 1259.08 | 0.3360 | 4.69103 | 7.55 | 0.4032 | 23.98054 |
19.5551 | 1989.51 | 0.2880 | 4.53587 | 11.93 | 0.3456 | 28.00431 |
21.3552 | 1231.41 | 0.2880 | 4.15744 | 7.39 | 0.3456 | 28.08379 |
24.2656 | 1691.14 | 0.2400 | 3.66498 | 10.14 | 0.2880 | 33.87367 |
24.7645 | 3062.41 | 0.2880 | 3.59227 | 18.37 | 0.3456 | 28.25477 |
27.0687 | 16670.16 | 0.2880 | 3.29148 | 100.00 | 0.3456 | 28.38581 |
27.6655 | 2543.00 | 0.1920 | 3.22181 | 15.25 | 0.2304 | 42.63274 |
46.6538 | 274.57 | 0.4800 | 1.94531 | 1.65 | 0.5760 | 18.03248 |
M3 | ||||||
10.1062 | 384.17 | 0.1920 | 8.74552 | 16.67 | 0.2304 | 41.55781 |
12.4097 | 1862.93 | 0.1440 | 7.12687 | 80.83 | 0.1728 | 55.52031 |
15.3861 | 514.06 | 0.1440 | 5.75426 | 22.30 | 0.1728 | 55.69636 |
16.4786 | 614.31 | 0.1440 | 5.37513 | 26.65 | 0.1728 | 55.77072 |
17.7229 | 556.26 | 0.1920 | 5.00045 | 24.14 | 0.2304 | 41.89638 |
19.6364 | 1458.12 | 0.1920 | 4.51729 | 63.27 | 0.2304 | 42.01161 |
20.5210 | 1268.41 | 0.1920 | 4.32452 | 55.04 | 0.2304 | 42.06906 |
21.1082 | 2186.88 | 0.1440 | 4.20552 | 94.89 | 0.1728 | 56.1449 |
26.2623 | 2304.69 | 0.2400 | 3.39068 | 100.00 | 0.2880 | 34.00621 |
30.9097 | 1390.86 | 0.1920 | 2.89065 | 60.35 | 0.2304 | 42.94931 |
35.7505 | 419.98 | 0.1920 | 2.50956 | 18.22 | 0.2304 | 43.49598 |
38.7963 | 436.01 | 0.1920 | 2.31927 | 18.92 | 0.2304 | 43.88765 |
42.7001 | 1914.70 | 0.1920 | 2.11583 | 83.08 | 0.2304 | 44.4465 |
45.7146 | 475.95 | 0.1440 | 1.98307 | 20.65 | 0.1728 | 59.89859 |
49.4167 | 607.77 | 0.2880 | 1.84282 | 26.37 | 0.3456 | 30.37879 |
52.3143 | 447.02 | 0.2400 | 1.74736 | 19.40 | 0.2880 | 36.89558 |
55.5860 | 406.73 | 0.1920 | 1.65201 | 17.65 | 0.2304 | 46.79462 |
64.1187 | 263.85 | 0.1440 | 1.45121 | 11.45 | 0.1728 | 65.12702 |
M2 | ||||||
10.6333 | 226.33 | 0.2400 | 8.31321 | 24.82 | 0.2880 | 33.26013 |
16.4662 | 645.82 | 0.2400 | 5.37917 | 70.82 | 0.2880 | 33.46191 |
18.9509 | 123.09 | 0.1440 | 4.67912 | 13.50 | 0.1728 | 55.95855 |
20.2257 | 128.24 | 0.1440 | 4.38698 | 14.06 | 0.1728 | 56.06612 |
23.2971 | 174.18 | 0.1440 | 3.81510 | 19.10 | 0.1728 | 56.35574 |
26.9846 | 911.98 | 0.2400 | 3.30155 | 100.00 | 0.2880 | 34.05697 |
33.4547 | 598.64 | 0.2400 | 2.67634 | 65.64 | 0.2880 | 34.5803 |
38.2609 | 291.83 | 0.2880 | 2.35048 | 32.00 | 0.3456 | 29.2107 |
42.6491 | 291.05 | 0.1920 | 2.11824 | 31.91 | 0.2304 | 44.43878 |
51.9240 | 102.07 | 0.1440 | 1.75958 | 11.19 | 0.1728 | 61.39029 |
58.3656 | 139.39 | 0.2880 | 1.57978 | 15.28 | 0.3456 | 31.60981 |
The sharp and well-defined Bragg Peaks at specific 2theta(θ) angles identified from the powder X-ray diffraction patterns, Figure 11-13 confirmed Nano scale particle size and obeyed Bragg equation [21]:
n λ = 2dsin(θ)
(1)
p-XRD patterns corroborated the crisp, well-defined Bragg reflection at particular 2theta angles. The data in p-XRD patterns were fitted using X'Pert High Score Plus Version 3.0.5 as well as the resultant results given in Table 6.
According to the Sherrar equation, the average particle sizes of the ligand (L) 28.54 and M2, M5 are 46.53 nm and 42.71 nm, respectively [21].
The inhibition zone diameters of the ligands and complex's antibacterial activity against different bacterial strains are displayed in Figure 14 and Table 7.
The ligand and M1, M5 complex showed middle antibacterial properties against the majority of investigated for the bacterial lineage, as did the chemical that was assessed for antibacterial activity against different bacterial stains. Because of the differing cellular wall structures, the G+ effect is stronger than the G-effect [22].
Figure 15-18 show the electrical spectra in DMSO at ambient temperature. displays the UV-visible spectra of the ligand (L) at varying concentrations. The presence of chromophores C=C and C=N is responsible for the significant broad absorption band at 356 nm and at 461 nm, which is caused by n-π* and ππ* occurring in succession. These can also be seen in the complexes' spectra and their shift to lower intensities verifies that the ligand and metal ions are coordinated. Because of charge transfer, the compound M1's electronic spectra displayed absorption bands at 462 nm. The higher charge transfer metal to ligand transitions most likely happened from the n-π* Schiff base orbitals to the d-orbitals of metals; this is true even if M2 and M3 don't show, all complexe M1, M2 and M3 showed absorption bands at range 595-631 nm due to the 4A2(F)![]() 4T1(P) transition for M1, M3 and 2B1g
4T1(P) transition for M1, M3 and 2B1g![]() 2A1g such as sugesst the tetrahedral and square planar.
2A1g such as sugesst the tetrahedral and square planar.
Figure 14: The inhibition zone (mm) of Schiff base (L) and Complex M1, M5
Figure 15: UV-Vis. spectra of ligand 1
Figure 16: UV-Visble. spectra of M1
Table 7: Inhibition zone of (L) and complexes towards with different Gram positive and by Gram negative bacteria
Inhibition zone (mm) | ||||||||
Staph (G‒) | E. coli (G+) | |||||||
D | C | B | A | D | C | B | A | Sample |
- | - | - | - | 4 | 6 | 6 | 8 | L |
- | - | 4 | 6 | - | 4 | 8 | 10 | M1 |
- | - | - | - | - | - | - | - | M2 |
- | - | - | - | - | - | - | - | M3 |
- | 4 | 6 | 8 | 8 | 10 | 10 | 12 | M5 |
- | - | - | - | - | - | - | - | DMSO |
24 | Amoxicillin (10 mg/mL) | |||||||
22 | Ampicillin (10 mg/mL) | |||||||
*(A, B, C, D) are 0.1 M, 0.01 M, 0.001 M and 0.0001 M, respectively, ‒: Not active with bacteria, Amoxicillin and Ampicillin standard antibiotics
Figure 17: UV-Visble. spectra of M2
Figure 18: UV-Visble. spectra of M3
Table 8: The Transitions with suggested form and hybridization of the (L) and complexes
Type of hybridization | Suggest geometry | Type of transfer | Wave length (cm) | Wave length (nm) | Compound |
- | - |
| 28089 | 356 | L |
| 21691 | 461 | |||
Sp3 | T.d |
| 31948 | 313 | M1 |
4A2(F) | 16891 | 592 | |||
dsp2 | Sq.P |
| 32894 | 304 | M2 |
2B1g | 15847 | 631 | |||
Sp3 | T.d |
| 31847 | 314 | M3 |
C.T (L | 21645 | 462 | |||
3T1(P)3T1(F) | 15923 | 628 |
We have done spectra measurement for the complexes Co(II), Cu(II) and Ni(II) complexes but we did not do it for the complexes Zn(II)and Cd(II) because they do not have an empty orbital. Table 8 showed all The mentioned values[2,4,523].
New Complexes from Schiff bases ligand(L) :2-((3-ethoxy-4-hydroxybenzylidene) amino) benzoic acid, prepared from benzaldehyde: 3-ethoxy-4-hydroxy benzaldehyde reacted with Anthranilic acid in the molar ratio: 1:1. And prepared metal complexes with Co(II), Ni(II) Cu(II), Zn(II) and Cd(II). The lage area surface of this nm scale compound by p-XRD and the SEM measurement improved the interaction with the bacteria cell and shifted the absorption wavelength.Because of their nano-sized size, they can be used as drug carriers and can also be used in chemical catalytic reactions, in addition to energy storage materials such as batteries used in solar energy. The Lewis's base es-donor molecule's chemical structure determines the physiochemical characteristics of the Schiff basis ligand L). The novel optical characteristics and characterisation of the synthesized Schiff base compounds were provided by the intermolecular and intramolecular hydrogen bonds that were created in the solid state. Therefore, this affects molecular structure and affected the electronic absorption bands. Magnetic measurements, FT-IR and NMR showed a change in the composition of the prepared compounds, which indicates coordination with metals.
Abdullah, M.M. et al. “Synthesis and Characterization of Some Copper (II) Complexes with New Schiff Bases Ligands.” Kirkuk Journal of Science, vol. 16, no. 1, 2021.
Ahmed, A.G. et al. “Facile and Rapid Synthesis of a New Series of Schiff Bases: Characterization and Evaluation of the Physicochemical Properties and Biological Activities.” New Journal of Chemistry, vol. 49, no. 31, 2025, pp. 13357–13368.
Mohammed, H.A. et al. “Synthesis, Characterization, Biological Activity and Scanning Electron Microscopy Studies of Schiff Base Binuclear Complexes Co (II), Cu (II), Cd (II) and Pt (II) Derivative from Tolidine with Salicylaldehyde.” Chemical Methodologies, vol. 7, no. 8, 2023, pp. 594-604.
Saleh, G.I. et al. “Synthesis, Characterization, Antibacterial Activity Study of Vanillin Schiff Base Complexes.” Kirkuk Univ. Journal-Scientific Studies, vol. 16, no. 4, 2021, pp. 13-20.
Ahmed, S.H. and H.A. Mohammed. “Metal (II) Complexes Derived from Proline Dithiocarbamate and Ligand Adducts Phenathroline: Synthesis, Characterization, Biological Activity and SEM Study.” AIP Conference Proceedings, vol. 3097, no. 1, May 2024, AIP Publishing.
Al-Obaidi, F.N. et al. “Potentiometric Study of the Dissociation Constants of Some Schiff Bases from Ortho-Hydroxynaphthaldehyde and 2,4-Substituted Aniline and Stability Constants of Their Cu (II) Complexes in Mixed Solvents.” Russian Journal of General Chemistry, vol. 93, suppl. 4, 2023, pp. S858-S867.
Thakur, S. and A. Bhalla. “Sustainable Synthetic Endeavors of Pharmaceutically Active Schiff Bases and Their Metal Complexes: A Review on Recent Reports.” Tetrahedron, vol. 153, 2024, p. 133836.
El Batouti, M. et al. “Synthesis, Characterization and Evaluation of New Anti-inflammatory Iron Charge Transfer Complexes.” Heliyon, vol. 10, no. 12, 2024.
Mounika, K. et al. “Synthesis, Characterization and Biological Activity of a Schiff Base Derived from 3-Ethoxy Salicylaldehyde and 2-Amino Benzoic Acid and Its Transition Metal Complexes.” Journal of Scientific Research, vol. 2, no. 3, 2010, pp. 513-513.
Hashem, H.E. et al. “Synthesis, Antimicrobial Activity and Molecular Docking of Novel Thiourea Derivatives Tagged with Thiadiazole, Imidazole and Triazine Moieties as Potential DNA Gyrase and Topoisomerase IV Inhibitors.” Molecules, vol. 25, no. 12, 2020, p. 2766.
Omar, A.M.M. and O.M. Aboulwafa. “Synthesis and in Vitro Antimicrobial and Antifungal Properties of Some Novel 1,3,4‐Thiadiazole and s‐Triazolo [3,4‐b][1,3,4] Thiadiazole Derivatives.” Journal of Heterocyclic Chemistry, vol. 23, no. 5, 1986, pp. 1339-1341.
Vogt, C. et al. “Ultraviolet-Visible (UV-Vis) Spectroscopy.” Springer Handbook of Advanced Catalyst Characterization, Springer International Publishing, 2023, pp. 237-264.
Wang, J.H. et al. “Effects of Hydrogen Bond on the Melting Point of Azole Explosives.” Journal of Molecular Structure, vol. 1163, 2018, pp. 54-60.
Fetouh, H.A. et al. “Synthesis, Characterization and Evaluation of Optically Active Polar Semi-Organic Glycine-Cobalt Chloride Crystals.” Alexandria Journal of Science and Technology, vol. 2, no. 2, 2024, pp. 193-201.
Rasheed, A. et al. “Formulation, Characterization and in Vitro Evaluation of Herbal Sunscreen Lotion.” Oriental Pharmacy and Experimental Medicine, vol. 12, 2012, pp. 241-246.
Berthomieu, C. and R. Hienerwadel. “Fourier Transform Infrared (FTIR) Spectroscopy.” Photosynthesis Research, vol. 101, 2009, pp. 157-170.
Silva, M.S. “Recent Advances in Multinuclear NMR Spectroscopy for Chiral Recognition of Organic Compounds.” Molecules, vol. 22, no. 2, 2017, p. 247.
Balci, M. Basic 1H- and 13C-NMR Spectroscopy. Elsevier, 2005.
Sjödin, M. et al. “Kinetic Effects of Hydrogen Bonds on Proton-Coupled Electron Transfer from Phenols.” Journal of the American Chemical Society, vol. 128, no. 40, 2006, pp. 13076-13083.
Al-Adilee, K.J. et al. “Synthesis of Some Transition Metal Complexes with New Heterocyclic Thiazolyl Azo Dye and Their Uses as Sensitizers in Photo Reactions.” Journal of Molecular Structure, vol. 1108, 2016, pp. 378-397.
Radamson, H.H. “X-ray Techniques.” Analytical Methods and Instruments for Micro- and Nanomaterials, Springer International Publishing, 2023, pp. 3-53.
Rohde, M. “The Gram-Positive Bacterial Cell Wall.” Microbiology Spectrum, vol. 7, no. 3, 2019, pp. 10-1128.
Perkampus, H.H. UV-Vis Spectroscopy and Its Applications. Springer Science & Business Media, 2013.
Vavoulas, A. et al. “A Survey on Ultraviolet C-Band (UV-C) Communications.” IEEE Communications Surveys & Tutorials, vol. 21, no. 3, 2019, pp. 2111-2133.
