+91 6002993949
submission@iarconsortium.org
Open Access
ISSN (Print) : 2788-9378
ISSN (Online) : 2788-9386
This study was conducted in the Hereditary Blood Diseases Center in Dhi Qar Governorate from the beginning of the third month of the year 2023 to the end of the third month of the same year. This study aims to find out the incidence of genetic thalassemia disease, which has become widespread in a wide range, by detecting it through several tests, including (CBC, C.R.P, LIVER FUNCTION TEST, RENAL FUNCTION TEST). The study included approximately 25 individuals infected with this disease, and each patient had all the required laboratory analyzes performed for him. The ages were different, ranging from the age of 2 years to the age of 33 years, as well as the gender difference, Females and males in equal numbers. The results of this study showed that the serum ferritin level increased significantly at (p<0.05) in all subjects The age groups of thalassemia patients compared with similar age groups in the control groups when Comparing the age groups of patients with each other, it is noted that there are no statistically significant differences at (p<0.05). Regarding blood parameters, the results of the current study showed that the rates of RBCs, Hb, HCT, MCV and MCH are significantly lower (p<0.05) in all thalassemia patients compared with the control group control. Also, higher WBCs and significantly higher lymphocyte counts were observed in the patients compared to the control group. Control group. The study also showed that the rate of infection with hepatitis C virus (HCV) Very high ar with age, but with regard to the hepatitis B virus and that the chances of the patient getting m increase. There is no infection for all patients.
Thalassemia is the most common form of inherited anemia worldwide which is characterized by the decreased or abolished production of either the alpha-like (alpha-thalassemia) or the beta-like (beta- thalassemia) globin chains that are produced to form hemoglobin tetramers (alpha2gamma2, HbF: alpha2- beta2, HbA; alpha2delta2, HbA2) during the fetal and postnatal life [1].
In 1925, thalassemia was first recognized in its severe (named Cooley’s anemia) and milder (named La Malattia di Rietti-Greppi-Micheli) forms inde- pendently in the US and Italy, which are today known as thalassemia major (TM) and thalassemia.
Intermedia (TI) [2-3]. Over the next 20 years, it became clear that thalassemia had been described for homo- zygous or compound heterozygous states for a recessively inherited microcytic mild anemia terms as thalassemia minor [4]. Subsequently, it has been recognized that thalassemia resulting from defects in the production of alpha- and beta-globin chains of hemoglobin, lead to the most common monogenic disease in humans not confined to the Mediterranean, but widespread throughout the Africa, Middle East, Southeast Asia, and Western Pacific region [5]. thalassemia and HbH disease every year [6]. The extensive studies strongly indicated that the carrier status for either alpha- or beta-thalassemia offers protection against the Falciparum malaria, which explains high carrier frequency in areas where malaria has been endemic [7].
Long established screening programs for detecting carriers in the population with genetic counseling and the option of prenatal diagnosis at risk pregnancies have resulted in a marked reduction in the rate of affected birth in Mediterranean countries. Systematic carrier screening has recently been established in parts of Middle East and Asia countries.6 Following identification of both disease-causing alleles, prenatal diagnosis can be performed by analysis of DNA extracted from fetal cells obtained by either amnio- centesis or chorionic villus sampling (at 15–18 weeks and 10–12 weeks of gestation respectively). Preim- plantation genetic diagnosis would also be an option for getting pregnant to an unaffected child. It is expected that the analysis of circulating fetal DNA in maternal blood will play an increasingly important role in the future practice of prenatal diagnosis [8].
Aim of Study
To identify the relationship between adult patients with beta thalassemia and its relationship to iron overload
Literature Review
History of Thalassemia: The first clinical description of thalassemia syndrome is attributed to the Detroit pediatricians Thomas B. Cooley and Pearl Lee. The actual term thalassemia was invented by George Whipple [9]. The term “thalassemia” is derived from the Greek words (Thalassa) meaning sea and (Heam) meaning blood, and refers to disorders associated with defective synthesis of α-globin or β-globin subunit of hemoglobin [10]. Thalassemia is among the most common genetic disorders worldwide. Occurring more frequently in the Mediterranean region of Southeast Asia, and West Africa, the Indian subcontinent [11]. Through the years the population migration to new countries caused the prevalence of thalassemia to the world [12].
Thalassemia is a public hematological disease in Iraq, especially in the north region of Iraq because these regions border with Turkey and Iran which are considered as highly endemic of thalassemia and the nature of their population have mixed ethnic, in addition to consanguineous marriages. In Iraq until end of 2015, β-thalassemia reported 8246 patients in 16 thalassemia centers throughout the country that prevalence was 27.4 per 100,000 of Iraqi population, it is considered high value may be due to lack of thalassemia prevention program and consanguineous marriage [13].
Geographical Distribution
The thalassemia has a high incidence in a broad area extending from the Mediterranean basin and parts of Africa, throughout the Middle East, the Indian subcontinent, Southeast Asia, and Melanesia into the Pacific Islands [14].
The carrier frequencies for β-thalassemia in these areas range from 1 to 20%, and rarely may be higher. The frequencies for the milder forms of β-thalassemia are much greater, varying from 10 to 20% in parts of sub- Saharan Africa, to 40% or more in some Middle Eastern and Indian populations. Globally, it is estimated that there are 270 million carriers with abnormal hemoglobin and thalassemia, of which 80 million are carriers of β-thalassemia. Recent surveys suggest that between 300,000 and 400,000 babies are born with a serious hemoglobin disorder each year, 23,000 with β-thalassemia major [15].
Types of Thalassemia
Thalassemia is an inherited disorder caused by impaired synthesis of one or more globin chains. This type of hereditary anemia is caused by decreased or absent production of one type of globin chains either α or β globin chain. They are divided according to which globin chains are produced in reduced amounts into the:
First Reduced or Absent α-globin Chain: α-thalassemia
Second Reduced or Absent β-globin Chain: β-thalassemia
All types of thalassemia are considered quantitative hemoglobin disease. Only the α and β thalassemia are sufficiently common to be of importance[11,15].
Alpha-Thalassemia
Alpha-thalassemia is usually produced by one or more deletions of the alpha globin chains. It is generally presented as a milder form of the disease. This is due to the fact that there are four α-globin genes requiring multiple mutations to result in a clinical impact [16]. The clinical syndromes resulting from α-thalassemia are first recognized in the mid-1950 and early 1960 as hypochromic microcytic anemia in the absence of iron deficiency [17-18].
Beta Thalassemia
Beta thalassemia is the result of a defective or absent synthesis of beta globin chains of the globin [19]. It is the most important type amongst the thalassemia syndrome and has become a worldwide clinical problem due to an increasing immigrant population [20].
Hypochromia and microcytosis characterize all forms of beta-thalassemia. The beta-thalassemia can be divided into several varieties. In β° thalassemia there is a total absence of β-chain production. In β+ thalassemia, there is a partial deficiency of beta-chain production [18].
The clinical severity of beta- thalassemia is related to the extent of imbalance between the alpha-globin and beta-globin chains [21].
Classification of Beta Thalassemia
Clinically β-thalassemia can be classified into three major groups:
Beta Thalassemia Major
Thalassemia major, also known as Cooley’s anemia and the Mediterranean anemia is the most severe form of β-thalassemia since both mutations of both β-globin alleles result in severely impaired β-globin chain production [22].
Three of the general allele combinations are responsible for thalassemia phenotype - βo/βo, βo/β+, and sometimes β+/β+ [23]. In thalassemia major the excess unpaired alpha- globin chain aggregate to form inclusion bodies.
These inclusion bodies damage RBC membranes, leading to intravascular hemolysis [24].
In addition, there is damage and premature destruction of RBC precursors, causing ineffective erythropoiesis. Anemia is severe and oxygen transport is compromised [25].
In some patients, death would result without chronic blood transfusions. Other clinical manifestations include listlessness, fatigue, dyspnea, poor appetite, hepatosplenomegaly, heart failure, and bone deformation and delayed puberty [25].
Beta Thalassemia Intermedia
Patients with β-thalassemia intermedia have mild to moderate anemia and in most cases do not require blood transfusions [26].
This condition is milder than thalassemia major due to an inheritance of a β- globin gene mutation associated with reduced β-globin chain production. The reduced genotype is most commonly β+/β+ [17].
The clinical phenotype of thalassemia intermedia is approximately intermediate between thalassemia major and minor. The common clinical features and complication include spleen enlargement due to entrapment of damaged RBCs, with a risk of iron overload due in part to increased intestinal absorption [27].
Although thalassemia intermedia can be associated with poor growth and bone abnormalities, it presents later in life and rarely affects longevity [26].
Patients require regular monitoring because the clinical severity varies widely between patients and within a patient over time, with possible deterioration to the thalassemia major phenotype [28]. Several rare β-globin variants phenotypically manifest thalassemia intermedia. For instance, individuals with dominantly inherited β-thalassemia or inclusion body β-thalassemia clinically exhibit thalassemia intermedia. These patients have moderate anemia and splenomegaly [29]. A rare variant form called “silent β-thalassemia” results from a mild imbalance of globin chain synthesis due to reduced β-globin synthesis, leading to thalassemia intermedia. Silent β-thalassemia mutations are found mainly in the regulatory regions, β-globinpromoter and 5’ and 3’ UTRs[26].
Beta Thalassemia Minor
Thalassemia minor is the most common form of β- thalassemia, and also known as the ‘thalassemia trait, in which affected individuals are asymptomatic [30].
These forms are typically heterozygous for β-thalassemia since they carry one normal hemoglobin β- globin allele and one thalassemia allele - either βoor β+ [31].
The asymptomatic patients are usually detected through routine hematological tests, but in retrospect, some newly diagnosed patients are observed to have slight anemia and small RBCs. The primary warning for individuals with thalassemia minor is a potential uncertainty of having children changed with more serious thalassemia if their wife or vice versa is also a carrier of thalassemia minor [32].
Diagnosis of Thalassemia
The initial investigations in a patient with suspected thalassemia at presentation consist of a complete blood count (CBC) or blood picture. Characteristic features in an CBC are low hemoglobin level, mean cell volume (MCV), mean cell hemoglobin (MCH), mean cell hemoglobin concentration (MCHC), and hematocrit (HCT) levels with increased redcell distribution width (RDW). The blood picture will reveal variations in the shape and size of red cells (anisocytosis and poikilocytosis) with predominantly hypochromic microcytic cells, and nucleated red blood cells [33].
Presence of hypochromic, often wrinkled and folded cells (lepto-cells) containing irregular inclusion bodies of precipitated α globin chains is a characteristic feature in the blood film. These inclusions are prominent in splenectomised patients. Basophilic stippling, Pappeheimer bodies, and target cells are also present. The low reticulocyte count present in these patients indicates the severity of intramedullary erythroblast destruction [34].
Leukocytosis with increased neutrophil count is usually noted. In patients with hyper-spleenism due to massive splenomegaly, leucopenia with thrombocytopenia can also be seen. Bone marrow examination, although not routinely performed, will show gross erythroid hyperplasia with the reversed myeloid/erythroid ratio from the normal 3 or 4 to 0.1 or less [33].
Dis-erythropoiesis with nuclear lobulation and fragmentation, basophilic stippling, defective hemoglobinization, and α chain precipitates are also visible in the bone marrow aspirate [35].
As a result of precipitated α chains in erythroid precursors, accelerated apoptosis is noted in the poly-chromatophilic and orthochromatic stages[21]. Bone marrow iron stores are increased and active phagocytic macrophages and pseudo Gaucher cells are also present. Diagnosis of β thalassemia major is depended on the finding of the relative levels of mainly adult hemoglobin (HbA) and fetal hemoglobin (HbF) using hemoglobin electrophoresis, isoelectric focusing or High-Performance Liquid Chromatography (HPLC) methods. The findings will be varied according to the functional hemoglobin allele which is present in the patient; β° and β+ alleles. In homozygous or compound heterozygous for β° allele (β°β°), HbA is absent, the predominant type is HbF (approx.95-98%) and HbA2 can be variable. When there is a homozygous state for β+ allele (β+β+) or compound heterozygous state for β° and β+ alleles (β°β+) HbA is also present in variable amounts; can be up to 35% of total hemoglobin [11,33]. High serum ferritin and saturated iron binding capacity are signs of iron overload and seen in most patients with transfusion-dependent thalassemia. This change is reflected as increased iron in both reticuloendothelial and parenchymal cells in the liver and increased bone marrow iron stores.
Bilirubin level is usually elevated and haptoglobins are absent. Serum aspartate aminotransferase (AST) levels are frequently high at the time of diagnosis due to hemolysis. Alanine aminotransferase (ALT) levels are usually normal prior to transfusion therapy and subsequently, ALT levels may elevate due to iron-induced hepatic damage or viral hepatitis [36].
Assessment of Iron Overload and its Effect on Liver Enzymes
Ferritin is the iron storage protein that serves to store iron in a non-toxic form, to store it in a safe form, and to transport it to any site in the body where it is required. Ferritin level in serum directly relates to the amount of iron stored in the body, which is important for red blood cell production [37]. If ferritin is in height level, there is iron in excess. Ferritin levels are also used as specific indicators for iron overload. Normal ranges of ferritin are 12–300 and 12–150 ng/ ml for male and female, respectively [38]. A significantly high level of ferritin is found in patients with iron overload as this may help differentiate thalassemia patients from those with iron deficiency, both of which will have a low red blood cell count [39]. In addition, any inflammatory state can cause a high level of ferritin; it acts as an acute phase protein. Therefore, long term monitoring of ferritin would be necessary, to gain any additional information for thalassemia diagnosis or treatment of follow-up patients [22].
Alanine Transaminase (ALT), and Aspartate. Transaminase
Alanine transaminase ALT, and aspartate transaminase AST are enzymes placed hepatic cell that released into the bloodstream when liver cells are damaged, these two enzymes are previously known as the GPT serum glutamic-pyruvic transaminase and the GOT serum glutamate- oxaloacetate transaminase [40].
These two transaminase enzymes may be reported on laboratory with both their new names and previous names or by their newer names only, ALT and AST are present in highest concentrations in cells from the heart, liver, skeletal muscles and red blood cells. Patients whose liver function test show a predominant rise in the transaminases have liver diseases that are characterized by hepatocellular damage [41].
ALT is found predominantly in the liver, with lesser quantities found in the kidneys, heart and skeletal muscle, as a result the ALT is a more specific-indicator of liver inflammation than the AST, as the AST may also be elevated in diseases affecting other organs such as the heart or muscles as in the following equation.
Alanine + α-ketoglutarate ⇌ pyruvate + glutamate
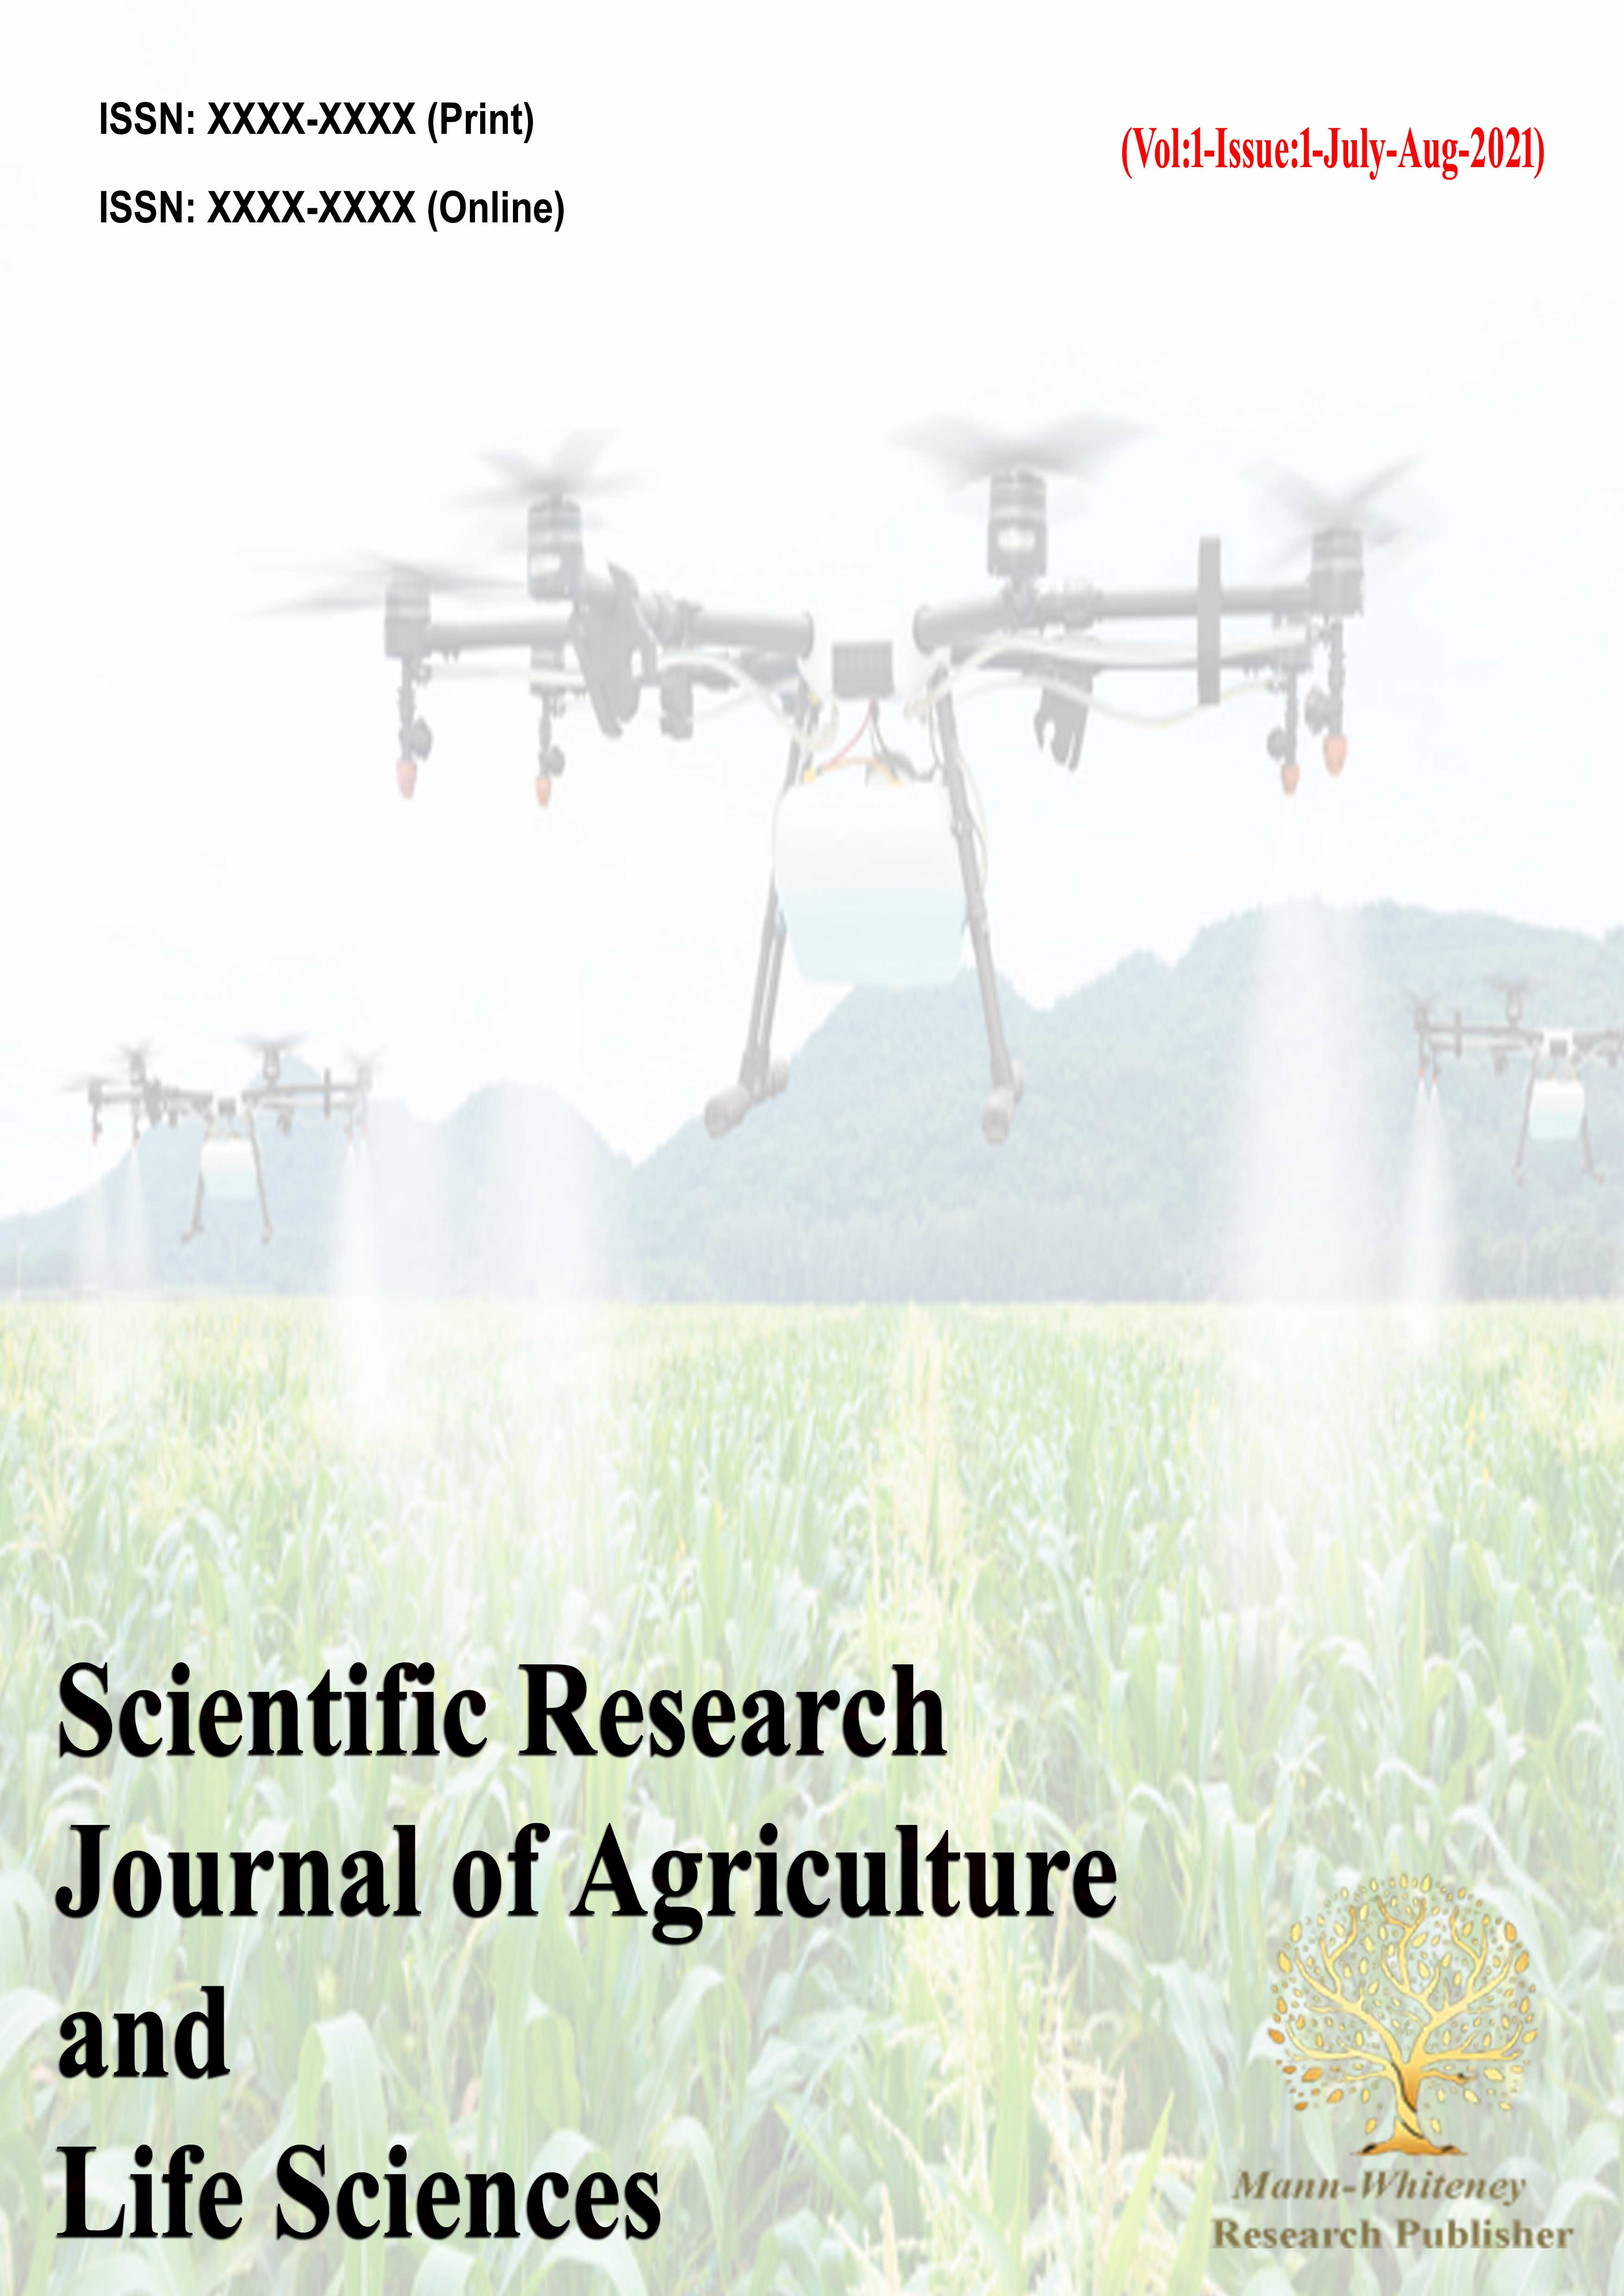
The AST is also elevated after a myocardial infarction, and during acute pancreatitis, acute hemolytic anemia, severe burns, acute renal disease, musculoskeletal diseases, and trauma. In contrast, aspartate transaminase is responsible for catalyzes the interconversion of aspartate and α- ketoglutarate to oxaloacetate and glutamate [42].
Aspartate + α-ketoglutarate ↔ oxaloacetate + glutamate
Levels of aminotransferases (ALT) in the blood indicate the degree to which liver membrane damage has resulted in an increased release of hepatocellular enzyme into the bloodstream, because ALT is more specific than AST for liver damage, ALT is used more often, in patients with risk factors for HCV infection and in whom there is no another explanation for increased enzyme levels, elevated aminotransferase levels are highly associated with HCV infection [33,43].
Alkaline Phosphatase (ALP)
ALP is present in mucosal epithelia of the small intestine, proximal convoluted tubules of the kidney, placenta, liver and bone. It performs lipid transportation in the intestine and calcification in bone. The activity of serum ALP is mainly from the liver with 50% contributed by bone, normal serum ALP is 41 to 133U/ml. In acute viral hepatitis, ALP usually remains normal or moderately increases. Elevation of ALP with prolonged itching is related with viral hepatitis A presenting cholestasis, tumor cells secrete ALP into plasma and there are tumor specific isoenzymes [44].
Hepatic and bony metastasis can also cause elevated levels of ALP, other diseases like infiltrative liver diseases, abscesses, granulomatous liver disease and amyloidosis may cause a rise in ALP, mildly elevated levels of ALP may be seen in liver cirrhosis, hepatitis and congestive cardiac failure [45].
Low levels of ALP occur in hypothyroidism, pernicious anemia, zinc deficiency and congenital hypo- phosphatasia, ALP has been found elevated in peripheral arterial disease, independent of other traditional cardiovascular risk factors [45].
Thalassemia Program in Iraq
This program was established in 1989, under the responsibility of the Ministry of health and in collaboration with WHO. It provides all the medical services for thalassemia management and control programs. There are more than 7000 thalassemia patients registered in 6 thalassemia center’s they are Baghdad, Ninawa, Waist, Bassrah, and Babylon and 8 clinics unit including Salah Din, Diyala, Messan, Thi-Qar, Muthana, Al-Najaf, Karbala, and Al- Anbar. All their medical services are free of charge. These centers are responsible to provide:
Adequate and safe blood supply for the patients in collaboration with the central blood bank
Adequate medical services for the management of thalassemia center including doctors, nurses, health-workers and laboratory workers
Training for medical staff by training courses, workshops, seminars, conferences, and encouraging research
Prevention programs, which include:
Family planning by providing the patients with contraceptive materials
Educational programs for the health workers, families, and the general population to be aware of how to control disease by interviews, folders, posters, TV spots etc
Carrier identification: in 1999 detection of the carrier rate among secondary school students was 4.8%
There are two projects which have been decided by the scientific committee to be done:
Premarital screening and introduction of a premarital test of thalassemia in the premarital certificate
Prenatal diagnosis, there is a trained medical team for this project is available but not feasible now because of the lack of kits for molecular studies
Evaluation by maintaining registration of patients, and report progress of patient care from time to time
Kits and Materials Used to Estimate (ALT and AST)
The kits used to estimate serum ALT and AST are listed in the Table 1 with their manufacture and country origin.
Principle
The Karmen rate method 22, as modified by Bergmeyer, is the base of the Aspartate Aminotransferase (AST) test. The level of AST in the blood is calculated using the method (International Federation of Clinical Chemistry), Karmen-Bergmeyer method by coupling malate dehydrogenase and reducing nicotinamide dinucleotide, after lactate dehydrogenase was add to the reaction for reduction the intervention due to endogenous pyruvate.
The AST / GOT components used were listed in Table 2
Table 1: Kits of (ALT and AST) Used In This Study and Their Manufacture / Biomerieux Company France
| No. | Reagent | Components |
| 1 | GOT Buffer substrate Phosphate buffer pH 7.5 Aspartate α-Ketoglutarate | 100 mmol/L 100 mmol/L 2 mmol/L |
| 2 | GPT Buffer substrate Phosphate buffer pH 7.5 Alanine α-Ketoglutarate | 100 mmol/L 200 mmol/L 2 mmol/L |
| 3 | Color Reagent 2,4 Dinitrophenylhydrazine | 1 mmol/L |
| 4 | Standard pyruvate | 1 mmol/L |
Table 2: Component of Reagent AST
| Item | Composition |
| Buffer, pH 7.50 | 125 mmol/L |
| L-Aspartate | 680 mmol/L |
| LDH and MDH | ≥ 2000 U/L, ≥ 1000 .U/L |
| .Sodium .Azide | < 0.1 % |
| .α-Ketoglutarate | 78 .mmol/L |
| .NADH | 1.1 .mmol/L |
Serum Creatinine
Principle: Creatinine reacts in an alkaline environment with picrate to give a colour compound whose intensity is proportional to the creatinine concentration in the sample.
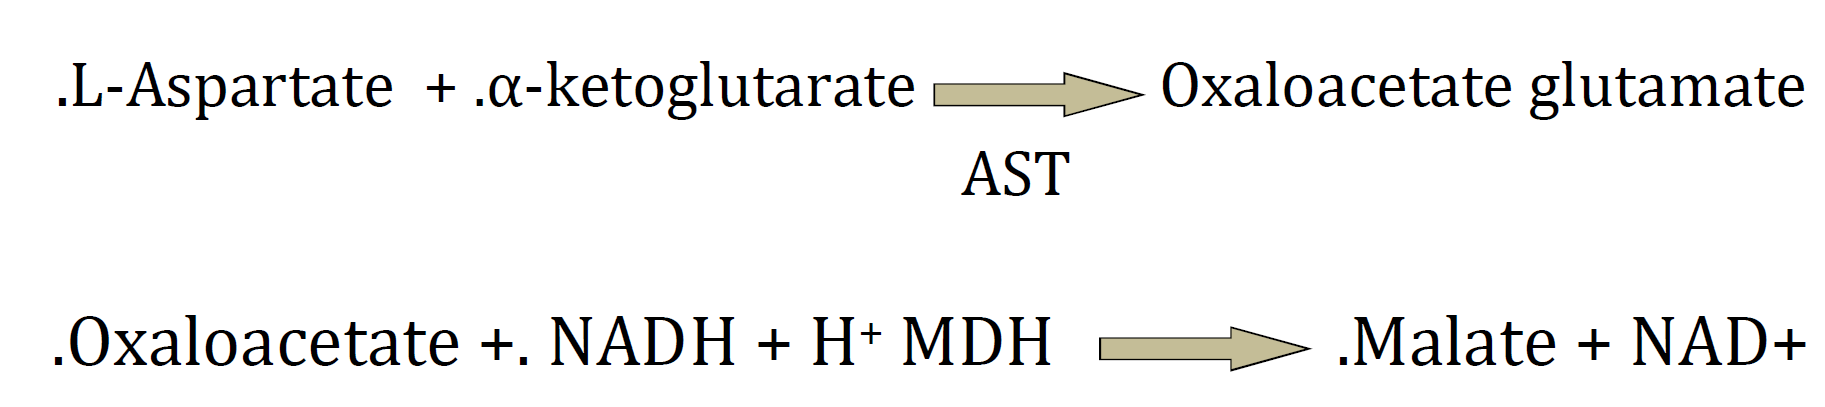
Blood Urea
Principle: Urea is hydrolyzed in the presence of water and urease to produce ammonia and carbon dioxide. The ammonia produced in the first reaction combines with alphaketoglutarate and NADH, which in the presence of glutamate - dehydrogenase, forms glutamate and NAD+.
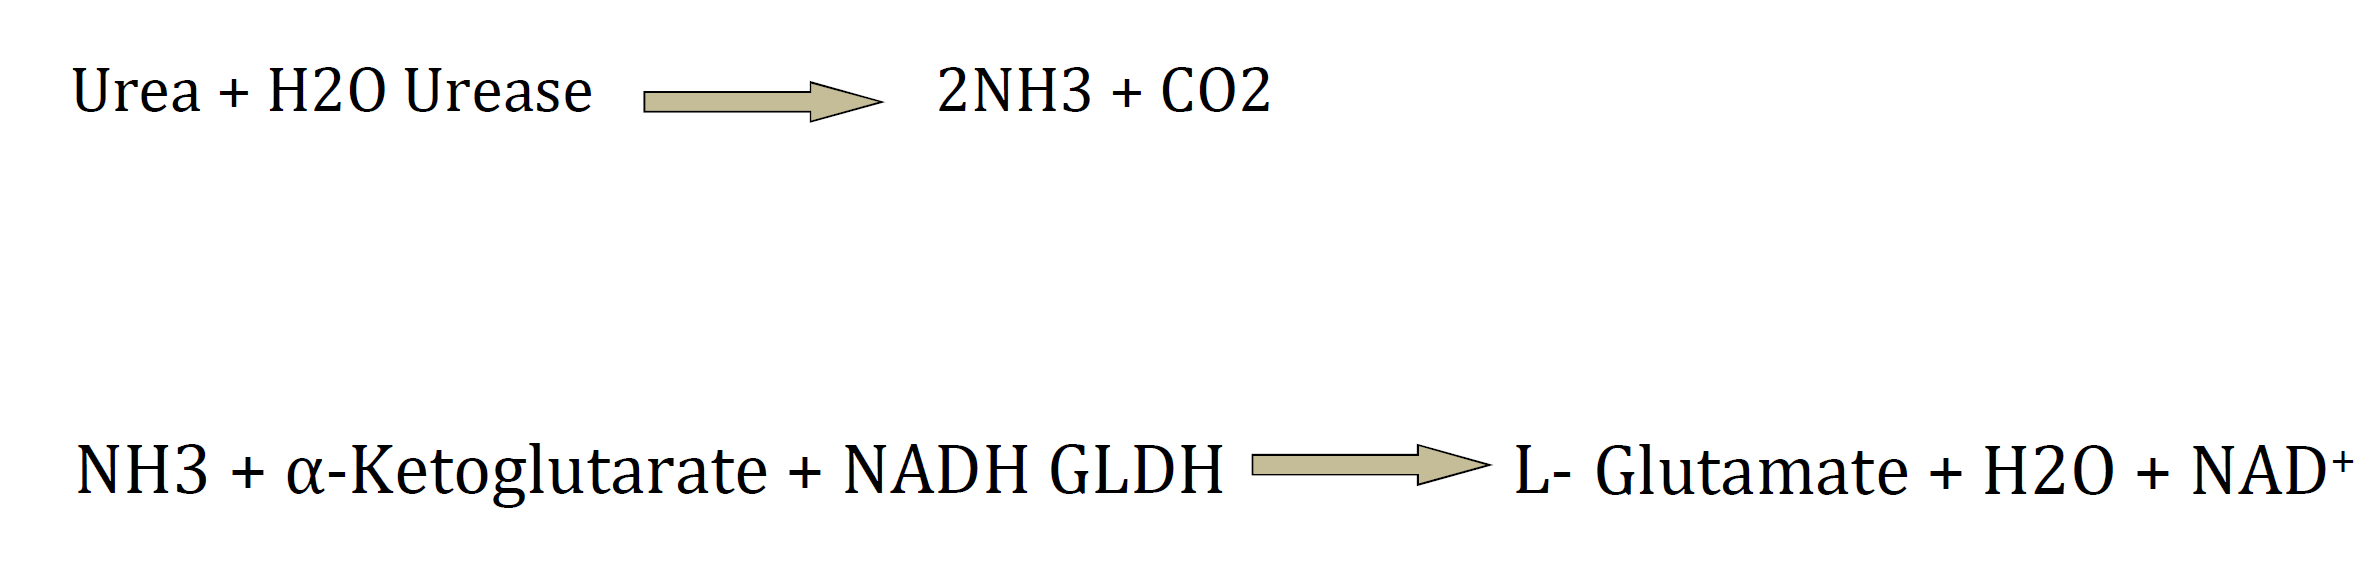
Uric Acid UA
Principle: Uric acid is converted by uricase and hydrogen peroxide (H2O2), which, under the catalytic influence of peroxide (POD), oxidizes compounds, reacts with 4-aminophenazone and 3,5-diclorophenol-sulphonate, giving a reddish-coloured compound.
Bilirubin Total
Principle
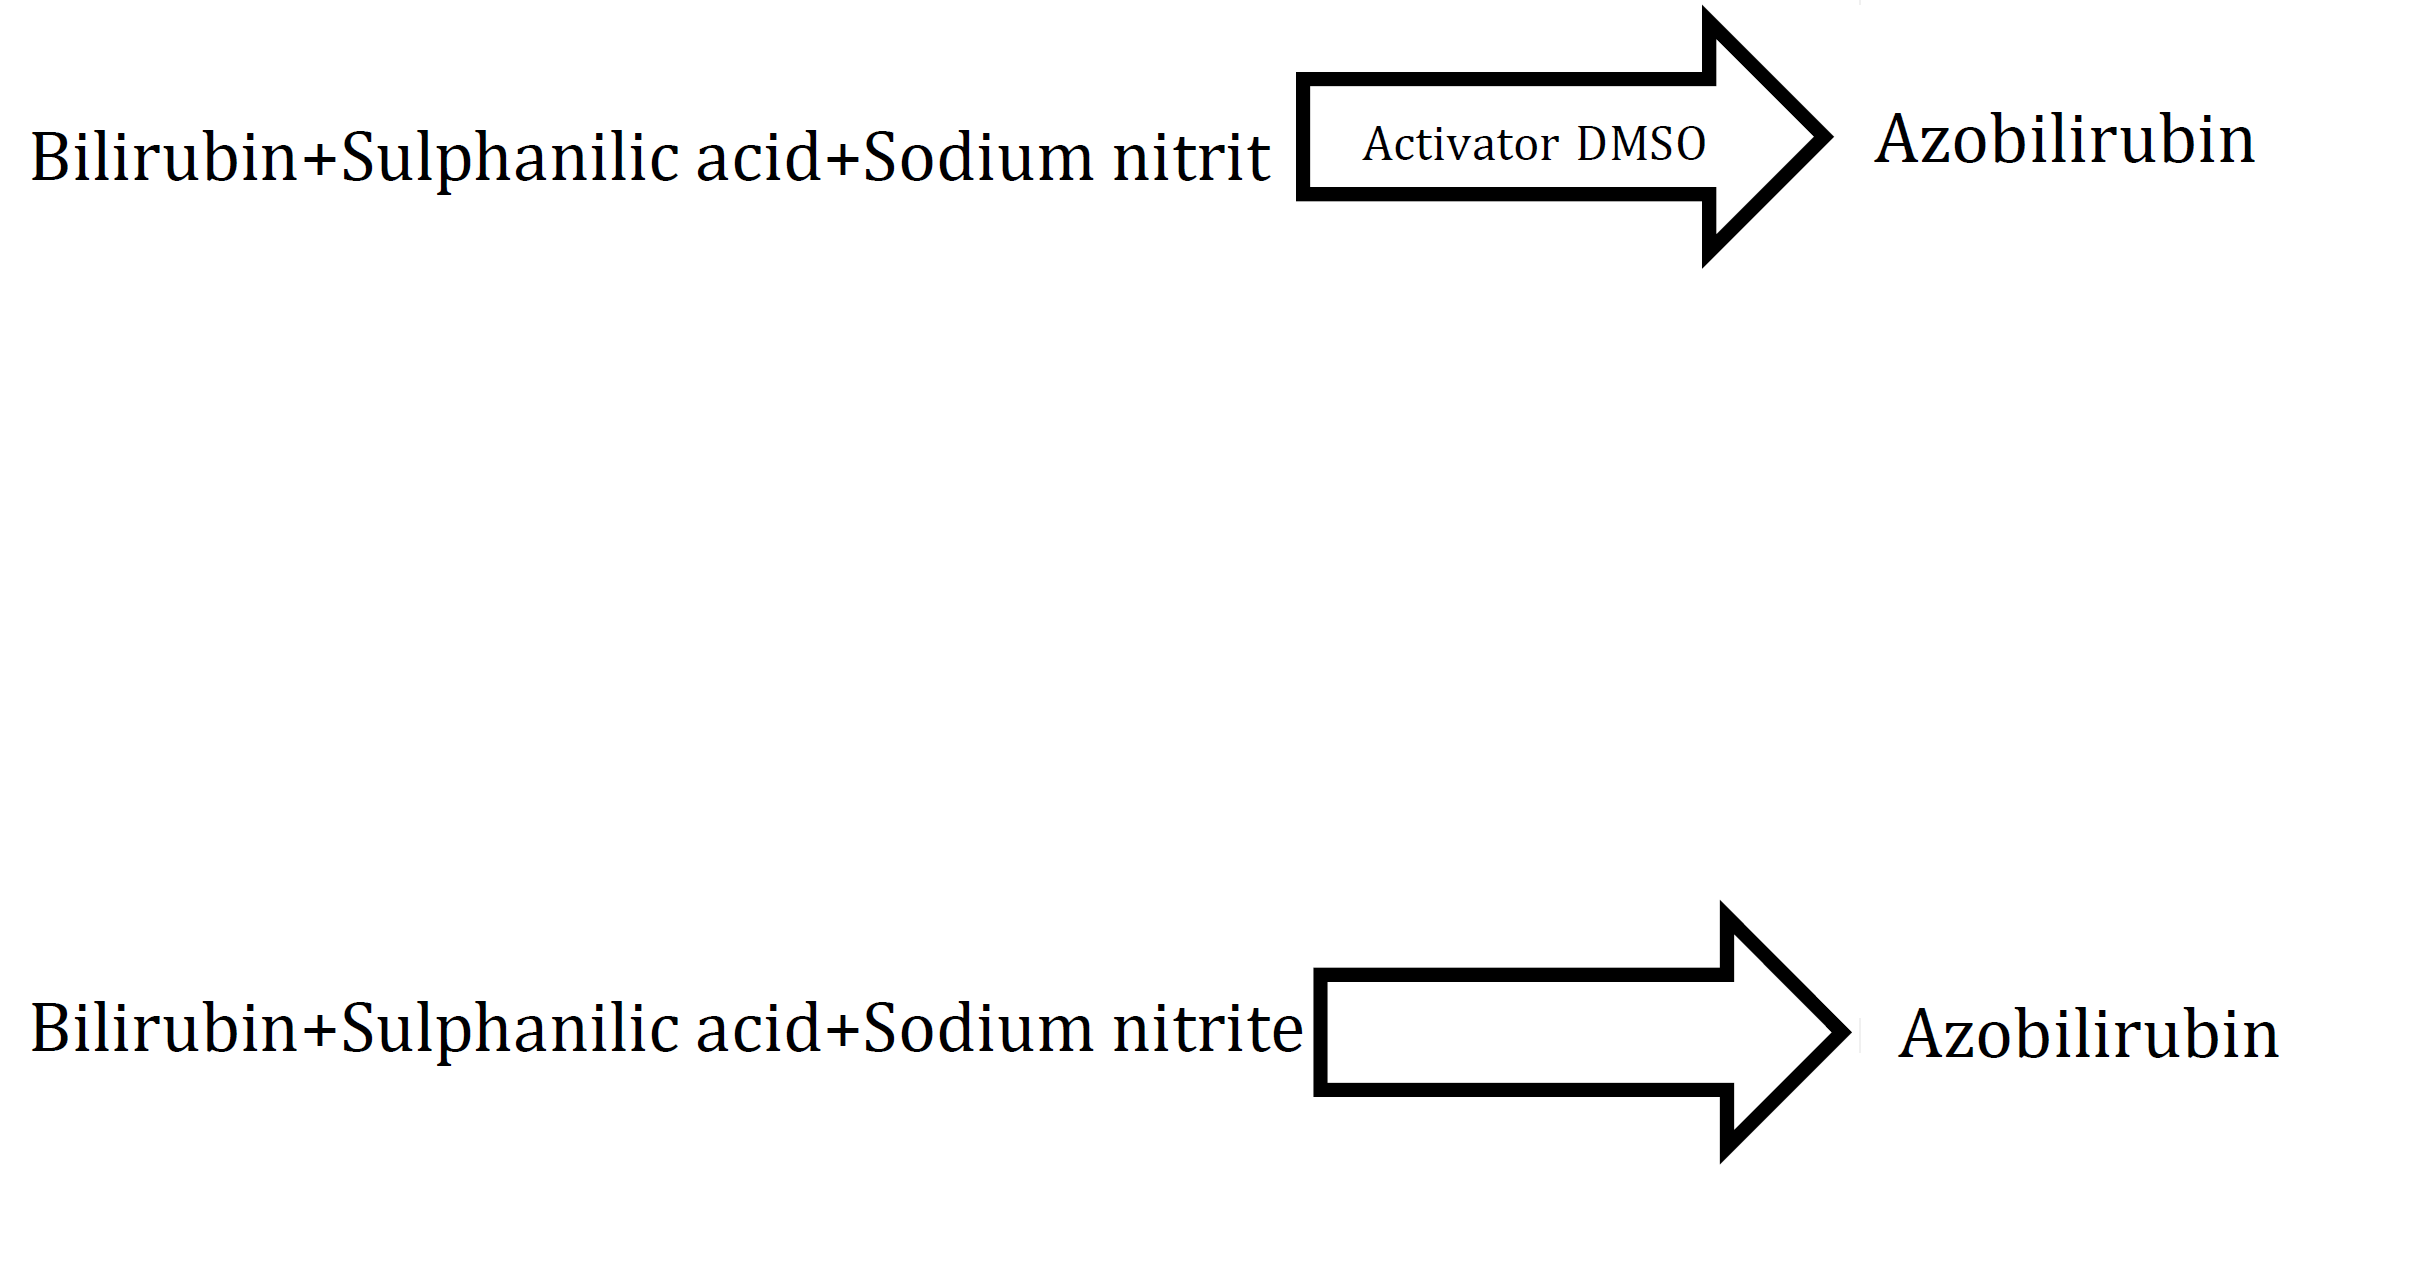
The bilirubin total and direct components used in this study were
Table 3: Component of reagent
| Item | composition |
| Litium hydroxide | 120.0 mmol/l |
| Boric acid | 80.0 mmol/l |
| Picric acid | 67.0 mmol/l |
Table 4: Component of Reagent Blood Urea
| Item | Composition |
| Good buffer ph 7.6 | 130.0 mmol/l |
| ADP | 1.2 mmol/l |
| Urease | ≥ 8000 U/l |
| GLDH | ≥ 1500 U/l |
| Good buffer ph 10.2 | 100.0 mmol/l |
| Alpha-ketoglutarate | 65.0 mmol/l |
| NADH | 1.20 mmol/l |
Table 5: Component of Reagent Uric Acid
| Item | Composition |
| Goods Buffer Ph 8.0 L | 100.0 Mmol/L |
| Ascorbate Oxidase | ³ 200 U/L |
| 3,5-Diclorophenol-Sulphonate | 2.5 Mmol/L |
| Goods Buffer Ph 8.0 | 100.0 Mmol/ |
| 4-Aminophenazone | 0.8 Mmol/L |
| Peroxidase | ³ 3000 U/L |
| Uricase | ³ 600 U/L |
Table 6: Component of Bilirubin
| Item | Composition | ||
| Total Bilirubin | |||
| Reagent 1 | Reagent 2 | ||
| Sulfanilic acid | 29 mmol/L | Sodium nitrite | 5.8 mmol/L |
| Hydrochloric acid | 67 mmol/L | ||
| DMSO 4500 mmol/L | |||
Statistical Analysis:
The data of the current study were statistically analysis by using Statistical Package of Social Science SPSS version 26m bases in using independent sample t test and person correlation at p-value <0.05.
Estimation of Liver Function and Renal Function Parameters in Thalassemia Patients and Control Group
The current study recorded a significant increased at p-value <0.05 the concentration of ALT, AST, TSB, blood urea and serum creatinine in thalassemia patients compared with control group, whereas the concentration of uric acid increased significantly in control group compared with thalassemia group as show in Table 7.
Estimation of Liver Function and Renal Function Parameters in Thalassemia Patients According to Sex
The current study recorded a significant increased at p-value <0.05 the concentration of ALT in female group than male group, while the concentration of AST increased significantly in male group than female group, the results also noted the other TSB, blood urea, serum creatinine and uric acid not scored a significant difference according to sex as show in Table 8.
Estimation of Liver Function and Renal Function Parameters in Thalassemia Patients According to Age Groups
The current study recorded a significant increased at p-value < 0.05 the concentration of blood urea in thalassemia patients with ag ≤15 years old than patients with age more than 15 years, while the concentration of serum creatinine increased significantly in thalassemia patients with ag more than 15 years old than patients with age ≤15 years, the results also noted the other ALT, AST, TSB and uric acid not scored a significant difference according to sex as show in Table 9.
A Person Correlation for Involved Parameters in Thalassemia Patients
The present study recorded the following relationship:
A strong positive correlation between ALT and AST
A moderate positive correlation between ALT and TSB
Table 7: Estimation of LFT and RFT in Thalassemia Patients and Control Group
Groups Parameters | Thalassemia No. 25 | Control No. 25 | p-value |
| Mean ± SD | |||
| ALT IU/L | 28.8±7.53 | 18.7±3.62 | 0.011* |
| AST IU/L | 37.1±11.5 | 26.6±7.53 | 0.002** |
| TSB mg/dl | 1.30±0.35 | 0.70±0.10 | <0.001** |
| B. Urea mg/dl | 22.4±7.77 | 19.2±4.96 | 0.092NS |
| S. creatinine mg/dl | 1.07±0.12 | 0.91±0.31 | 0.143NS |
| Uric Acid mg/dl | 3.30±0.82 | 4.41±1.10 | <0.001** |
The two** refer the statistic significant at p-value <0.01, the one * ** refer the statistic significant at p-value <0.05, while the NS refer the statistic is non-significant
Table 9: Estimation of LFT and RFT in Thalassemia Patients according to age groups
Groups Parameters | ≤15 Years No. 17 | >15 Years No. 8 | p-value |
| Mean±SD | |||
| ALT IU/L | 30.1±8.05 | 26.1±7.84 | 0.058NS |
| AST IU/L | 36.1±12.4 | 39.2±8.88 | 0.146NS |
| TSB mg/dl | 1.20±0.58 | 1.52±0.30 | 0.325NS |
| B. Urea mg/dl | 24.7±7.26 | 17.4±6.67 | 0.024* |
| S. creatinine mg/dl | 1.02 ± 0.09 | 1.18 ± 0.11 | 0.005** |
| Uric Acid mg/dl | 3.26 ± 0.61 | 3.38 ± 1.19 | 0.737NS |
Table 10: Person Correlation for LFT and RFT
| Correlation | AST | TSB | B. urea | S. creatinine | UA | |
| ALT | R | 0.626** | 0.418 | 0.164 | -0.228 | -0.126 |
| p-value | 0.001 | 0.009** | 0.434 | 0.274 | 0.548 | |
| AST | R | 0.528** | -0.052 | -0.044 | 0.114 | |
| p-value | 0.002 | 0.803 | 0.835 | 0.586 | ||
| TSB | R | -0.123 | 0.175 | 0.388 | ||
| p-value | 0.559 | 0.404 | 0.056 | |||
| B. urea | R | **. Correlation is significant at the 0.01 level (2-tailed). | 0.727** | 0.138 | ||
| p-value | 0.000 | 0.512 | ||||
| S. creatinine | R | Person correlation for 25 thalassemia patients | 0.313 | |||
| p-value | 0.128 | |||||
A moderate positive correlation between AST and TSB
A strong positive correlation between blood urea and serum creatinine. As show in Table 10.
Have a great knowledge of self-care after undergoing this operation, and this is a good indication that they are dealing with this type of surgery.
Estimation of Liver Function and Renal Function Parameters in Thalassemia Patients and Control Group
The current study recorded a significant increased at p-value <0.05 the concentration of ALT, AST, TSB, blood urea and serum creatinine in thalassemia patients compared with control group, whereas the concentration of uric acid increased significantly in control group compared with thalassemia group as show in Table 11.
Estimation of Liver Function and Renal Function Parameters in Thalassemia Patients According to Sex
The current study recorded a significant increased at p-value <0.05 the concentration of ALT in female group than male group, while the concentration of AST increased significantly in male group than female group, the results also noted the other TSB, blood urea, serum creatinine and uric acid not scored a significant difference according to sex as show in Table 12.
Table 11: Estimation of LFT and RFT in Thalassemia Patients and Control Group
Groups Parameters | Thalassemia No. 25 | Control No. 25 | p-Value |
| Mean±SD | |||
| ALT IU/L | 28.8±7.53 | 18.7±3.62 | 0.011* |
| AST IU/L | 37.1±11.5 | 26.6±7.53 | 0.002** |
| TSB mg/dl | 1.30±0.35 | 0.70±0.10 | < 0.001** |
| B. Urea mg/dl | 22.4±7.77 | 19.2±4.96 | 0.092NS |
S. creatinine mg/dl | 1.07±0.12 | 0.91±0.31 | 0.143NS |
Uric Acid mg/dl | 3.30±0.82 | 4.41±1.10 | < 0.001** |
The two** refer the statistic significant at p-value <0.01, the one * ** refer the statistic significant at p-value <0.05, while the NS refer the statistic is non-significant
Table12: Estimation of LFT and RFT in Thalassemia Patients according to Sex
Groups Parameters | Male No. 15 | Female No. 10 | p-value |
| Mean±SD | |||
| ALT IU/L | 26.8±7.47 | 31.9±5.14 | 0.041* |
| AST IU/L | 38.7±10.3 | 34.8±12.1 | 0.046* |
| TSB mg/dl | 1.38±0.48 | 1.19±0.34 | 0.548NS |
| B. Urea mg/dl | 22.4±6.86 | 22.3±7.38 | 0.964NS |
| S. creatinine mg/dl | 1.04±0.12 | 1.11±0.11 | 0.141NS |
| Uric Acid mg/dl | 3.38±0.78 | 3.18±0.90 | 0.578NS |
Table 13: Estimation of LFT and RFT in Thalassemia Patients According to age Groups
Groups Parameters | ≤ 15 Years No. 17 | > 15 Years No. 8 | p-value |
| Mean±SD | |||
| ALT IU/L | 30.1±8.05 | 26.1±7.84 | 0.058NS |
| AST IU/L | 36.1±12.4 | 39.2±8.88 | 0.146NS |
| TSB mg/dl | 1.20±0.58 | 1.52±0.30 | 0.325NS |
| B. Urea mg/dl | 24.7±7.26 | 17.4±6.67 | 0.024* |
| S. creatinine mg/dl | 1.02±0.09 | 1.18±0.11 | 0.005** |
| Uric Acid mg/dl | 3.26±0.61 | 3.38±1.19 | 0.737NS |
Table 14: Person Correlation for LFT and RFT
| Correlation | AST | TSB | B. urea | S. creatinine | UA | |
| ALT | r | 0.626** | 0.418 | 0.164 | -0.228 | -0.126 |
| p-value | 0.001 | 0.009** | 0.434 | 0.274 | 0.548 | |
| AST | R | 0.528** | -0.052 | -0.044 | 0.114 | |
| p-value | 0.002 | 0.803 | 0.835 | 0.586 | ||
| TSB | R | -0.123 | 0.175 | 0.388 | ||
| p-value | 0.559 | 0.404 | 0.056 | |||
| B. urea | R | **. Correlation is significant at the 0.01 level (2-tailed). | 0.727** | 0.138 | ||
| p-value | 0.000 | 0.512 | ||||
| S. creatinine | R | Person correlation for 25 thalassemia patients | 0.313 | |||
| p-value | 0.128 | |||||
Estimation of Liver Function and Renal Function Parameters in Thalassemia Patients According to Age Groups
The current study recorded a significant increased at p-value <0.05 the concentration of blood urea in thalassemia patients with ag ≤15 years old than patients with age more than 15 years, while the concentration of serum creatinine increased significantly in thalassemia patients with ag more than 15 years old than patients with age ≤15 years, the results also noted the other ALT, AST, TSB and uric acid not scored a significant difference according to sex as show in Table 13.
A Person Correlation for Involved Parameters in Thalassemia Patients
The present study recorded the following relationship:
A strong positive correlation between ALT and AST
A moderate positive correlation between ALT and TSB
A moderate positive correlation between AST and TSB
A strong positive correlation between blood urea and serum creatinine. As show in Table 14
Distribution of Thalassemia Patient and Control According to Age, Gender, Habitat and Endogamy: The distribution of thalassemia syndrome in current study according to age. The our study show a significant increase of thalassemia among second age group and first age group compare with third age group. The high rate of prevalence of thalassemia in the second and first age group, because the patient who is up to 20 years or more is exposed to many complications, the most important of which is the increase iron overload and this effects on the heart muscle and kidneys and endocrine, in addition to the viral infections, which lead to many deaths. This result is agree with previous studies obtained by Al-Attar and Shekha, [23] and Tawfeeq, [46].
The results designate that thalassemia major phenotype can be diagnosed perfectly within the early months or early days of age because the exhibitions of the disease may perform after a complete switch from fetal to adult Hb synthesis occurs.
Typically, this switch is completed by the sixth month after birth [47], But the study found that some patients were diagnosed and had a blood transfusion during the first week and others after the age of ten years. As for severe types of β-thalassemia, the symptoms may not be obvious until the second half of the first year of life till that time, the γ globin chains production and their combination into fetal Hb can mask the condition [48].
Frequently, milder forms are discovered by chance and at different ages and many patients whose conditions to be a homozygous may show no significant symptoms or anemia for several years [59]. According to the gender there are no significant difference between gender because thalassemia it is a genetic disease that is transmitted from parents to offspring and to both sex equally. This result is agreed with previous studies obtained by Al-Attar and Shekha, [23].
An according to habitat the result showed the significant increase of thalassemia syndrome in rural habitat, this is due to some common tribal traditions among the rural population and their mating and lack of openness to other families, especially those who marry cousins and cousins. This is what was found during the study, this result is agree with previous study obtained by Tawfeeq, [46], and dis agree Al-Attar and Shekha, [23], the compatibility between the two studies may be due to the random sampling of models or all ages without discrimination, The disagreement between the two studies may be due to several reasons such as the large number of rural-urban migration, especially after the 1990 war, the scarcity of rural resources and for obtain employment in the city, or the study was limited to the study of family genetic diseases.
Biochemical Parameters
Liver Enzymes: The high level of serum hepatic enzymes (ALT, AST, ALP) can be correlated to some extent with the elevated serum ferritin level, which in turn, depends upon the iron overload due to multiple blood transfusions in thalassemia patients. The results of our study support this weak correlation Hence, it can be concluded that the high levels of hepatic enzymes are possibly due to the hepatic injury, caused by iron overload in thalassemia patients receiving multiple blood transfusion. A number of researchers as [37,50]
Have the same point of view regarding the high level of hepatic enzymes in thalassemia patients. Some investigators have described the proposed mechanism of action but the exact mechanism is still unclear. Hence, further detailed studies should be conducted in order to explore the exact reason behind this in future and to find out the promising correlations in thalassemia patients receiving multiple blood transfusions.
When we detected the serum liver enzymes at different ferritin levels showed a positive relation between increased serum ferritin and amount of hepatocellular damage and thein increased levels of liver enzymes. As the serum ferritin level increases more than 1000 ng/ml, the levels of ALT, AST, and ALP rise significantly [37]. The result observed in the current study is when the level of serum ferritin increases and lead to liver cell damage and thus effected on the liver enzymes. In current study the serum ferritin concentration was very high in β-thalassemia patients in spite of chelation therapy.
A positive relation was noted between number of blood transfusions and serum ferritin levels. As Iron deposition in liver takes place, his functions are affected which are predicted by raised ALT , AST and ALP. SALT, liver enzymes were raised significantly, and continue to rise as ferritin crosses 1000 ng/ml there was a positive relation between increased of level of serum ferritin and increased of the liver enzymes. These results agreed with pervious study obtained by [40].
Immunological Parameters
Immunoglobulins: The current study show significantly higher serum for all IgG, IgM, and IgA in all age groups of thalassemia patients compared with corresponding healthy control groups this result can be attributed to numerous factors such as repeated blood transfusion in β-thalassemia patients will result in a continuous exposure to various antigens, and immune complexes and will lead to increased levels of serum immunoglobulins and from receipt of performed antibodies in the bodies of people who donate blood as a result of multiple infections.
The mechanisms of such changes in the immunoglobulin were described, according to hypothesis including iron overload on skin stimulation of IgA produce as a muco-cutaneous antibody, and repeated exposure to antigens due to frequent transfusions and infection lead to stimulation of IgM and IgG [39].
Thalassemia patients are prone to many bacterial and viral infections and other infectious agents. frequent infections also stimulate the immune system and as result in increased immunoglobulins levels [51].
Iron overload was suggested by some investigators as an important contributing factor in changing the immune parameters in thalassemia patients. It has been suggested that iron overload results in increase migration of T helper cells to the gut and lymph nodes and this causes an increase in serum immunoglobulin levels in thalassemia patients [52].
The results of the present study came in compatible with previous studies obtained by Amin, and Alyasin, : Malik et al. : Javad et al . who reported that serum IgG, IgM and IgA immunoglobulins increased in ΒTM patients.
The significant increase in the serum levels of immunoglobulins with increase of age may attributed to increase the frequency of blood transfusions and increase exposer to infectious agents. Splenectomy in patients more than 20 years in the present study may considered as another factor involve in the high levels of immunoglobulins. This can be explained through the fact that in spite of that the spleen acts as one of the major lymphoid organs to clear the blood infections, it is hypothesized that the removal of spleen may force other secondary lymphoid organs to compensate for the synthesis of the major immunoglobulin classes [30].
According who reported that splenectomy increases the serum level of IgG and IgA without change on serum level of IgM. This might be associated to filtration of transfused packed cells resulting in decreasing the chance of frequent exposure to infectious agents. On the contrary [53] reported that serum levels of IgG and IgM in βTM patients were normal. The differing immunoglobulin serum levels in major beta thalassemia patients could be due to heterogeneity of different studies in aspects including age groups, race, socioeconomic status nutrition, and difference in the care provided for the patient to control anemia and varied measures of ferritin, ignorance of the patients simultaneous affliction with hepatitis C and the failure to divide them into two groups of splenectomies and not splenectomies patients.
ABO
System : The current study showed the most frequent patient according to blood groups. In the case of females, the results presented that the most frequent ABO type in patient group were type O 40 (26.7%), type B 18 (12.0%), and type A16-10.6%. In the case of males the most frequent ABO type in patient group were type O 32 (21.3%), type B 24 (16.0%) and type A 10 (6.70%). These results also showed that there are no significant differences at (p<0.05) between blood groups within one sex (between males or females), and between both sex (between males and females). The current study agree with previous study obtained by Mohammed and Jeddoa, [54].
This probably due to no relation between genotype of blood group and genotype of thalassemia. Furthermore, the gene that encoded for blood group located on chromosome 9, while the genes of globin chromosome located on chromosome 11 and 16[55].
Viruses
The current study included the prevalence of viruses (HCV, HBV, and HIV) in patients with thalassemia who dependent on blood transfusion. The result shows the percentage of infection with HCV is 17.33%. The highest rate of infection was in the second and third age group due to the increased the most realistic possibility to exposure to infected blood due to frequent blood hesitation of admission to hospital with increase transfusions or increase contamination device due to intravenous treatment possibility to exposure to or material [56].
Based on earlier reports, HCV infection has higher prevalence compared with normal blood donors worldwide. In Iraq, <1% of normal blood donors are infected by HCV. However, reports from different geographical regions in Iraq have shown a significantly higher prevalence of anti- HCV antibody in thalassemia patients, This result documented in other studies [57]. The current result dis agree with previous studies obtained by Bagheri Amiri, Mostafavi, and Mirzazadeh, [58] in Iran, and Dumaidi et al. [59] in Palestine , but agreement with study obtained by Mohammadi and Khodabandehloo, [60] in Iran. There has been an increased in the number of patients with HCV infection. This rise may reflect the routine screening of blood donor program. In addition, the routine screening of blood donors in blood bank is limited to ELISA technology, the ELISA technique is influenced by environmental factors such as temperature, and depend on the efficiency of workers, in addition the opening window of HCV from infection to antibody production is differ from person to person [61]. So, the use of PCR technology will be more accurate in diagnosis because it can identify the infection with virus very early. In addition, hepatitis C is RNA virus, which is genetically unstable and has no vaccine due to genetic mutations in its g.enome [62].
With respect to the hepatitis B virus, the current study shows that there is no infection in all patients with thalassemia. The current result dis agree with previous studies obtained by Hussein, [13] in Thi-Qar, and Saeed et al. [56]. This may be due to the fact that hepatitis B virus is a DNA virus and genetically stable and rarely exposed to genetic mutations [63]. In addition, all patients with thalassemia in Iraq are vaccinated with the special vaccine against hepatitis B before starting blood transfusion.
Regarding the HIV virus, the current study show that there is only one infection in the first age group. The current result is dis agree with previous study obtained by Vermeulen et al. [64] in South Africa, and Bagheri Amiri, Mostafavi and Mirzazadeh, [58] in Iran
When viral infection diagnosis according to CRP. CRP is one of the acute phase proteins that IL-6 stimulates during inflammation In HCV, HBV, and HIV infections. However, the levels of these biomarkers have been seen to increase significantly at 24-48 hours after infection.
The current study showed the status of viral infection according to C reactive protein. The result showed the most frequent type of infection was chronic infection were 18 (12.0%) and acute infection were 8 (5.33%). The current result disagrees with previous study obtained by Al-Kubaisy et al. [65]. The increase infection with viruses this due to the repeated blood transfusions to which thalassemia patients are exposed to infection with viruses increases with increasing age. The acute state increased during the last ten year.
The result of current study showed, it is possible to highlight the following conclusions:
Most people with Thalassemia are villages and rural habitats
Frequent Blood transfusions in beta-thalassemia patients leads to continuous immune stimulation which affected negatively on cellular and humoral immunity
Iron overload has a negative relationship on the humoral and cellular immunity as well as on liver enzymes in beta-thalassemia patients
The immune abnormality and their complication increased with age of beta-thalassemia patients serum concentration of immunoglobulins increased with increased of age of beta thalassemia
The concentration of serum complement system decreased with increased age of beta-thalassemia
All beta-thalassemia patients shows higher WBCs counts and their differential and decreased in all hematological parameters (RBCs, Hb,
HCT, MCV and MCH ) of beta-thalassemia patients groups
The chance of infection with viruses and other pathogens increases with age
Recommendations
The routine protocol management of the patients has to be improved. This includes the following points:
Increase blood transfusion and desferal should be given in proper dose to the patients, with S.C infusion pump and VIT. C, in order to decrease tissue haemochromatosis and hypoxia
Hepatitis B. vaccine should be given to those patients who are negative for HBsAg
Bone marrow transplantation
The introduction of super-transfusion with neo-cytes (young red cells), might be effective in decreasing the rate of iron accumulation in homozygous beta-thalassemia
Develop a treatment plan by the Ministry of Health; include all age groups of thalassemia patients, without exception, with an evaluation of the efficiency of treatment through non-appearance of side effects when given to patients
We recommend that researchers intensify the study and diagnose the infectious agents that were not covered in our study to accompany the blood transfusion process
Weatherall D et al. Inherited disorders of hemoglobin. In: Jamison.
Cooley TB and Lee OP. Series of cases of splenomegaly in children with anemia and peculiar bone changes.Transactions of the American Pediatric Society, 1925, vol. 37, p. 29.
Rietti F. Ittero emolytica primitive. Atti dell’Accademia delle Scienze Mediche e Naturali di Ferrara, 1925, vol. 2, pp. 14–19.
Valentine WN and Neel JV. Hematologic and genetic study of the transmission of thalassemia. Archives of Internal Medicine, 1944, vol. 74, p. 185.
Weatherall DJ and Clegg JB. Thalassemia—a global public health problem. Nature Medicine, 1996, vol. 2, pp. 847–849.
Modell B and Darlison M. Global epidemiology of haemoglobin disorders and derived service indicators. Bulletin of the World Health Organization, 2008, vol. 86, pp. 480–487.
Weatherall DJ. Genetic variation and susceptibility to infection: the red cell and malaria. British Journal of Haematology, 2008, vol. 141, pp. 276–286.
Lo YM. Fetal nucleic acids in maternal blood: the promises. Clinical Chemistry and Laboratory Medicine, 2011, in press.
Honar N. Frequency of celiac disease in children with beta thalassemia major. Iranian Journal of Pediatrics, 2014, vol. 3, no. 4, pp. 4–9.
Daraghmeh NM. Management and complications of thalassemic patients in Palestine: retrospective study. Najah National University Journal, 2016, vol. 2, no. 3, pp. 14–22.
Traivaree C et al. Genotype–phenotype correlation among beta-thalassemia and beta-thalassemia/HbE disease in children. Journal of Blood Medicine, 2018, vol. 9, pp. 35–41.
Gedara A et al. Genetic modifiers of beta thalassemia: phenotype–genotype relationship in Sri Lankan population.University of Colombo Journal, 2012, vol. 2, no. 5, pp. 13–25.
Muhssen HJ et al. Assessment of serum zinc level in children with thalassemia major receiving oral chelation and their sibling in Al-Najaf City. Journal of Al-Kufa University, 2018, vol. 7, no. 1, pp. 746–752.
De Sanctis V et al. β-thalassemia distribution in the Old World: an ancient disease seen from a historical standpoint. Mediterranean Journal of Hematology and Infectious Diseases, 2017, vol. 9, no. 1, pp. 1–14.
Williams TN and Weatherall DJ. World distribution, population genetics, and health burden of the hemoglobinopathies.Cold Spring Harbor Perspectives in Medicine, 2012, vol. 2, no. 3, pp. 2–10.
Naderi M et al. Acute lymphoblastic leukemia in two patients with β-thalassemia major. Zahedan Journal of Research in Medical Sciences, 2014, vol. 2, no. 4, pp. 2–3.
Muncie HL and Campbell J. Alpha and beta thalassemia. American Family Physician, 2009, vol. 11, no. 2, pp. 340–345.
Farashi S and Harteveld CL. Molecular basis of α-thalassemia. Blood Cells, Molecules and Diseases, 2018, vol. 70, pp. 43–53.
Danjou F et al.Genetic modifiers of β-thalassemia and clinical severity as assessed by age at first transfusion.Hematology, 2012, vol. 2, no. 1, pp. 989–993.
Kremastinos DT et al. β-thalassemia cardiomyopathy: history, present considerations, and future perspectives.AHA Journals, 2010, vol. 3, no. 3, pp. 451–458.
Noetzli LJ et al. Pancreatic iron and glucose dysregulation in thalassemia major. American Journal of Hematology, 2012, vol. 87, no. 2, pp. 155–160.
Bazi A et al.The role of immune system in thalassemia major. Journal of Pediatrics, 2017, vol. 18, no. 10, pp. 2–19.
Al-Attar MS and Shekha MS. The prevalence of thalassemia in Erbil Province. University of Salahaddin-Hawler Journal, 2014, vol. 2, no. 1, pp. 46–55.
Surapon T. Thalassemia syndrome. Hemoglobin, 2011, vol. 14, no. 3, pp. 103–115.
Azarkar Z. Efficacy of HBV vaccination in children with thalassemia major, South Khorasan, Iran. Iranian Journal of Public Health, 2009, vol. 11, no. 3, pp. 318–320.
Sleiman J et al. Renal complications in thalassemia major. American Journal of Hematology, 2018, vol. 8, no. 2, pp. 41–49.
Viprakasit V and Ekwattanakit S. Clinical classification, screening and diagnosis for thalassemia.Hematology/Oncology Clinics of North America, 2018, vol. 32, no. 2, pp. 237–245.
Salehi MR et al. Prevalence of orofacial complications in Iranian patients with β-thalassemia major. Iranian Journal of Public Health, 2007, vol. 36, no. 2, pp. 43–46.
Kooti S et al. The prevalence of hepatitis C virus among thalassemia patients referred to Shahid Beheshti. Virology Journal, 2018, vol. 26, pp. 112–120.
De Dreuzy E et al. Current and future alternative therapies for beta-thalassemia major.Biomedical Journal, 2016, vol. 39, no. 1, pp. 24–38.
Ghatreh-Samani M et al.Oxidative stress and age-related changes in T cells: is thalassemia a model of accelerated immune system aging? Central Journal of Immunology, 2016, vol. 41, no. 1, pp. 116–124.
Clarke GM and Higgins TN. Laboratory investigation of hemoglobinopathies and thalassemias: review and update.Clinical Chemistry, 2000, pp. 1284–1290.
Cao A and Kan YW. The prevention of thalassemia.Journal of the University of California, 2013, vol. 3.
Said F and Abdel-Salam A. XmnI polymorphism: relation to β-thalassemia phenotype and genotype in Egyptian children. Egyptian Journal of Medical Human Genetics, 2015, vol. 16, no. 2, pp. 123–127.
Jeddoa ZMA et al. Immunological evaluation of patients with β-thalassemia major in Kerbala City using single radial immunodiffusion technique. Journal of Kerbala University, 2011, vol. 4, no. 1, pp. 939–943.
Shawky RM and Kamal TM. Thalassemia intermedia: an overview. Egyptian Journal of Medical Human Genetics, 2012, vol. 13, no. 3, pp. 245–255.
Salih KM and Al-Mosawy F. Influence of blood transfusion rate on some clinical manifestations in β-thalassemia major patients. Hematology/Oncology Clinics of North America, 2016, vol. 2, no. 5, pp. 15–19.
Gülhan B and Yalçın E. Effects of blood transfusion on cytokine profile and pulmonary function in patients with thalassemia major. Clinical Respiratory Journal, 2014, vol. 22, no. 1, pp. 1–10.
Asadov CD. Immunologic abnormalities in β-thalassemia. Journal of Blood Disorders and Transfusion, 2014, vol. 5, no. 7, pp. 1–15.
Suman RL et al. Correlation of liver enzymes with serum ferritin levels in β-thalassemia major. International Journal of Research in Medical Sciences, 2016, vol. 4, no. 8, pp. 3271–3274.
Cecilia S and Hultcrantz R. Decreased survival of subjects with elevated liver function tests during a 28-year follow-up. Hepatology, 2009, vol. 46, no. 3, pp. 595–602.
Masuda A et al. Role of Fc receptors as a therapeutic target. Journal of Pharmaceutical University of Japan, 2014, vol. 11, pp. 1–7.
Forget BG et al. Classification of the disorders of hemoglobin. Cold Spring Harbor Laboratory Press, 2013, vol. 15, no. 3, pp. 12–19.
Grosso M et al. Molecular basis of thalassemia. University of Naples Journal, 2011, vol. 2, no. 2, pp. 15–26.
Asmaa MS et al. Molecular and biochemical study on β-thalassemia patients in Iraq. Journal of the University of Baghdad, 2006.
Tawfeeq A. A prospective study for the outcomes of thalassemia in Kirkuk. Journal of the College of Science, Kirkuk University, 2018, vol. 17, no. 10, pp. 13–22.
Sugimoto T. Direct anti-globulin test and clinical diagnosis. Thalassemia and Other Hemolytic Anemias, 2018, vol. 15, no. 2, pp. 22–31.
Zelm MC. Sequential IgG class switching: B cells take their time. Immunology and Cell Biology, 2014, vol. 92, no. 8, pp. 645–646.
Al-Haddad RM et al. Molecular, biochemical and hematological investigations of beta-thalassemic children in Gaza governorate. Hematology/Oncology Clinics of North America, 2012, vol. 2, no. 6, pp. 12–18.
Al-Hamdani AH et al. Seroprevalence of hepatitis B and C in Iraqi population at Baghdad: a hospital-based study.University of Baghdad Journal, 2012, vol. 20, no. 3, pp. 186–190.
Moosa MM et al. Combination of two rare mutations causes beta-thalassemia in a Bangladeshi patient. Genetics and Molecular Biology, 2011, vol. 34, no. 3, pp. 406–409.
Chalevelakis G et al. Imbalanced globin chain synthesis in heterozygous beta-thalassemic bone marrow.Proceedings of the National Academy of Sciences, 2006, vol. 72, no. 10, pp. 3853–3857.
Kiani-Amin M. Serum immunoglobulin levels in splenectomized and non-splenectomized patients with major beta-thalassemia.Iranian Journal of Pediatrics, 2011, vol. 21, no. 1, pp. 95–98.
Mohammed Z and Jeddoa A. Molecular characterization of beta-thalassemia mutations in Holy Karbala. Journal of the College of Science, University of Kerbala, August 2018, pp. 12–19.
Sinha PA et al. Study of distribution of ABO blood groups in β-thalassemia patients. International Journal of Research in Medical Sciences, 2017, vol. 5, no. 8, p. 3479.
Saeed U et al. Estimation of hepatitis B virus, hepatitis C virus and different clinical parameters in the thalassemic population of Pakistan. Virology Research and Treatment, 2015, pp. 11–16.
Abed RE. The prevalence of HCV infection in Thi-Qar Province and evaluation of frequency of NS5B gene with some types of cytokines. Journal of the College of Education for Pure Science, 2013.
Bagheri AF et al. HIV, HBV and HCV coinfection prevalence in Iran: a systematic review and meta-analysis. PLOS One, 2016, vol. 11, no. 3, pp. 15–19.
Dumaidi K et al. Prevalence of sero-molecular markers of hepatitis C and B viruses among patients with β-thalassemia major in Northern West Bank, Palestine. Canadian Journal of Infectious Diseases and Medical Microbiology, 2018, vol. 18, no. 10, pp. 1–6.
Mohammadi S and Khodabandehloo M. Prevalence of hepatitis C virus antibodies among beta-thalassemia major patients in Kurdistan Province, Iran. Iranian Academic Journal, 2017, vol. 12, no. 3, pp. 23–31.
Haghpanah S et al. The frequency of hypothyroidism and its relationship with HCV positivity in patients with thalassemia major in Southern Iran. Biomedical Journal, 2018, vol. 89, no. 1, pp. 55–60.
Bazi A et al. Characteristics of seropositive hepatitis B and C thalassemia major patients in South-East Iran.Biotic Health Science, 2016, vol. 3, no. 2, pp. 0–5.
Jawetz M et al. Medical microbiology. 27th ed., McGraw-Hill, 2016.
Vermeulen M et al. Use of blood donor screening to monitor prevalence of HIV and hepatitis B and C viruses in South Africa. Virology Journal, 2017, vol. 23, no. 9, pp. 1–4.
Al-Kubaisy WA et al. Hepatitis C virus prevalence and genotyping among hepatocellular carcinoma patients in Baghdad. Asian Pacific Journal of Cancer Prevention, 2014, vol. 15, no. 18, pp. 7725–7730.
