
+91 6002993949
submission@iarconsortium.org
Open Access
ISSN (Print) : 2708-6259
ISSN (Online) : 2708-6267
Topographic maps are considered a fundamental and essential tool in field geographical studies, as they provide an accurate representation of the Earth's surface through contour lines and conventional symbols that reflect elevation, slope, and natural and human features. Through this detailed depiction, topographic maps contribute to facilitating the understanding of the relationship between various geographical elements, making them an indispensable tool in multiple fields such as geomorphology, urban planning, environmental phenomena analysis, site determination, and watershed analysis. With the expansion of applied geographical applications, the importance of topographic maps has increased as a reliable source of accurate field information. They enable researchers to read and understand the nature of the terrain before going into the field, thus saving time and effort while enhancing the efficiency of geographical analysis. Therefore, this research aims to highlight the vital role that topographic maps play in field geographical studies in terms of their functions, methods of use, and their significance in supporting scientific interpretation and analysis of the geographical environment.
Background
Geographic field studies are contingent upon accurate spatial data for interpreting both the physical and human characteristics of the landscape. Many instruments are available to geographers; however, topographic maps continue to be a basic tool for mapping qualitative and quantitative information. Topographic maps visually depict the surface of the earth and provide essential information about elevation, landforms and human (anthropogenic) structures all in a single map. Topographic maps allow for 3-dimensional representations of terrain which is essential for both scientific investigation and practice [1].
Topographic maps have been critical across many disciplines, from military logistics, global infrastructure projects, environmental monitoring, and risk assessment due to their standardised design. The great value of topographic maps is that features such as slopes, ridges, valleys, and watersheds may be interpreted with contour lines or symbologist [2].
In the last few decades, the adoption of Geographic Information Systems (GIS) and remotes sensing technologies have transformed the analysis of spatial data. Yet, topographic maps still operate under the heading of fundamentals robustly. Especially in the planning and executing of sample field work, topographic maps provide context for the location and areas for improvement or additional information collection. In a world where si852 or more dudes do not want to get much more complicated and GIS or spatial data organization needs to be limited, topographic maps retain value and enhance advanced spatial modelling [3].
By recognizing the foundational and evolving role of topographic maps, this research contributes to a better understanding of their practical functions, methodological applications, and continued relevance in the age of digital cartography.
Problem Statement
While modern technologies provide options for field-data collection, topographic maps are still a central feature of geographical inquiries. But that begs the question of how accurate they are as representations of field conditions in the real-world situation and how well they can be used in practical geographical research [4].
Main Research Question
What is the role of topographic maps in enhancing the efficiency and accuracy of field geographical studies?
Significance of the Study
To highlight the scientific and practical value of topographic maps
To support geographers with principles and tools that facilitate fieldwork
To guide planning institutions in utilizing topographic data for effective decision-making
Research Objectives
To identify the characteristics and components of topographic maps
To analyze the methods of using topographic maps in geographical fieldwork
To assess the effectiveness of topographic maps in representing terrain and geographical phenomena
To clarify the relationship between map accuracy and the quality of field-based studies
Research Hypotheses
There is a direct positive relationship between the accuracy of a topographic map and the success of field study
Topographic maps can be employed in all types of fields of geographical studies, whether physical or human
Definition of Topographic Maps
A topographic map is one of the most important types of maps used for accurately and comprehensively representing the Earth’s surface. It displays both natural and human-made features in their true geographical context [5]. What distinguishes topographic maps is their use of contour line continuous lines that connect points of equal elevation above sea level—to represent terrain elevation and slope [6]. This allows for a three-dimensional visualization of the terrain on a two-dimensional surface, making it a powerful analytical tool for understanding landforms.
Topographic maps also include a standardized set of symbols used to represent roads, railways, rivers, vegetation, boundaries, and human structures. These symbols help readers quickly and accurately interpret various features. Such maps are typically produced at medium to large scales (e.g., 1:25,000 or 1:50,000), allowing for detailed representation of geographic phenomena and making them suitable for use in field studies, geological surveys, urban planning, civil engineering, and military operations [7].
The spatial accuracy of topographic maps is ensured using precise cartographic projections, such as the Mercator or orthographic projection. The data used to produce these maps is derived from ground surveys, aerial imagery, or satellite data (See Map 1).
Due to the precise quantitative and spatial information, they provide, topographic maps are an indispensable tool for geographers and field researchers. They contribute to landform analysis, the study of spatial relationships, route planning, and the identification of optimal locations for research, investment, or environmental protection.
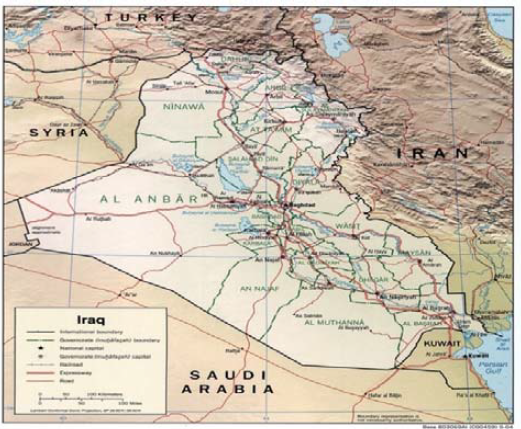
Map 1: Topographic Map of Iraq.
Source: Directorate of Military Survey, Baghdad, Iraq, 1987
Map Symbols and Scale
Topographic Map Symbols: Symbols on topographic maps are standardized graphical elements used to represent natural and human-made features in a simplified yet accurate manner. These symbols act as the language of the map, allowing the reader to interpret its content and understand various features without the need for descriptive text [8].
Topographic symbols are generally classified into three main types:
Line Symbols
Used to represent linear features such as:
Roads (primary, secondary, unpaved)
Rivers and streams
Railway lines
Contour lines (indicating elevation)
Area Symbols
Used to shade or color specific regions representing:
Forests and agricultural lands
Lakes and water bodies
Residential or industrial areas
Point Symbols
Used to indicate features that occupy a specific point on the map, such as wells, buildings, schools, towers, mosques, temples, etc.
These symbols are usually accompanied by a map legend placed in one corner of the map, which explains the meaning of each symbol used (See Figure 1).
Map Scale
The map scale represents the ratio between a distance on the map and its corresponding distance on the ground. It is a fundamental component in understanding and utilizing any map accurately. Map scale can be expressed in three main forms [9]:
Figure 1: Types of Geographic Symbols
Source: Based on the topographic map and outputs from ArcGIS version 10.8.

Figure 2: Types of Map Scales
Source: Based on 1:50,000 and 1:25,000 topographic maps and outputs from ArcGIS version 10.8.

Figure 3: A Babylonian world map drawn 4,000 years ago
Source: https://ar.wikipedia.org/
Numerical Scale
This is written as a fractional ratio, such as: 1:50,000. This means that 1 centimeter on the map corresponds to 50,000 centimeters (or 500 meters) in the real world.
Graphical Scale
Presented as a drawn line divided into units (e.g., meters, kilometers, miles). This type of scale is particularly useful, as it remains accurate even if the map is resized or photocopied.
Verbal Scale
Expressed in words, such as: "1 centimeter represents 1 kilometer.", maps are generally categorized according to their scale as follows:
Large-scale maps (e.g., 1:10,000 or larger): Used for detailed planning, engineering surveys, and site-level analysis
Medium-scale maps (e.g., 1:25,000 to 1:100,000): Commonly used in topographic mapping and field studies
Small-scale maps (e.g., smaller than 1:250,000): Used for regional, national, or continental mapping purposes
Choosing the appropriate scale is crucial for balancing accuracy with detail. It directly impacts the effectiveness and clarity of topographic maps, especially in field-based applications (See Figure 2).
The History of Topographic Maps and the Evolution of their Use
The origins of topographic maps can be traced back to ancient civilizations, where humans, since the dawn of history, attempted to depict their surrounding environments and identify the locations of resources and natural landmarks. Early forms of topographic representation appeared in Egyptian, Babylonian, and Greek civilizations; however, these early efforts lacked the scientific accuracy and cartographic principles known today [10] (See Figure 3).
The true development of topographic mapping began with the rise of surveying science in the 17th and 18th centuries, particularly in Europe, where major powers undertook systematic national surveying projects for military and developmental purposes. One of the most notable projects of this era was the Cassini Topographic Survey of France (Carte de Cassini), completed in the 18th century, which represented the first comprehensive national topographic map based on grid systems and precise measurements [11].
In the 19th century, advancements in surveying tools—such as theodolite and angle-measuring devices—enabled the production of more accurate topographic maps. The Industrial Revolution further increased demand for such maps, particularly for the construction of railways, roads, and urban planning [12].
By the early 20th century, the advent of the airplane signified the beginning of new types of aerial survey. This vehicle facilitated topographic mapping, vastly improving the accuracy of topographic mapping and enlarging its coverage [11]. The establishment of national agencies in the post-World War periods, such as the USGS (U.S. Geological Survey) and the Great Britain Ordnance Survey, mean that topographic maps were officially produced by a national agency using standard procedures, scale, and symbology [13].
Topographic maps have evolved in the 21st century, benefitting from the development of remote sensing and Geographic Information System (GIS) technology, creating digital maps that are interactive, automatically analyzed, and regularly updated. Topographic maps are now used widely for regional planning, resource management, environmental risk assessment, and civil engineering, rather than only in education and geographical research as they once were [14].
In conclusion, the progress of topographic mapping is representative of advances in technology regarding spatial measurements and geographic knowledge systems. It reflects their importance as a scientific tool in understanding and analyzing the surface of the earth.
Uses of Topographic Maps in Field Planning
Topographic maps are integral for geographic field planning and are an important resource for researchers, engineers, and planners in assessing the characteristics of a particular site prior to visiting. Topographic maps provide precise readings on terrain characteristics like elevation, slope, and aspects that assist users in selecting a route of travel, identifying a study area, and projecting the amount of effort that will be required to collect data [15].
In geographic studies, topographic maps help researchers analyze site characteristics through the precise location of phenomena, such as valleys, hills, human settlements and water sources, and they are useful for preparing an organized action to collect data. Topographic maps assist researchers prepare a draft topographic profile of a study area helping the research team obtain a visual representation of the configuration of elevation changes, helping the field team think about geographical locations of interest or sensitive site areas [16].
In civil and urban planning, topographic maps are essential in providing a basis for the design of roads, construction sites, or other areas such as in determining land features appropriately dealing with agricultural or construction potential while also analyzing the risk of floods or landslides in mountainous regions. In planning large scale projects or studies, such as geological or environmental surveys, topographic could be useful in determining base points and distributing equipment to different fields while also identifying safe travel paths.
Thus, the topographic map serves as a vital visual and informational reference in the pre-fieldwork stage. It provides an initial, accurate spatial understanding that helps in making informed decisions, allocating field efforts efficiently, and avoiding potential obstacles.
Reading and Interpreting Topographic Information in the Field
Reading and interpreting a topographic map may be the most important skill for geographers and researchers in the field. Field data quality can depend on the ability to interpret topographic symbols and understand spatial relationships among features and between the features represented in two dimensions and the field representations in three dimensions.
Typically, field interpretation starts with determining where the researcher is situated using geographic coordinates or the Universal Transverse Mercator (UTM) grid system. Using prominent features like mountain peaks, rivers or lakes, roads, or buildings helps match the features portrayed on the map to the real-world field observations.
Understanding contour lines is the most important feature to help understand format of the surface. Contour lines may be close together, if so, there are steeper slopes; if the contour lines are widely spaced, the terrain is flat or gently sloping. In addition to visualizing surface constraints (how steep or flat the surface is), these contour lines may be used to create terrain profiles for the researcher to determine access points, observation and blind spots, and the steepness of gradients for water flow.
To help determine land covers, land uses, and settlement types, topographic symbols are also used. Knowing true north and magnetic north will help researchers better navigate in the field and avoid being misled by distance and direction errors.
Combining field observations with prior map analysis allows for a detailed spatial understanding used in documenting observations, tracking geographic phenomena, and interpreting the relationship between terrain, human activity, and natural features.
Field Tools for Geographers
Fieldwork in geography requires a range of tools that enable accurate collection of spatial and descriptive data, direct linkage with topographic maps, and real-time analysis in the study environment [17]. These tools can be categorized as traditional and digital:
Traditional Tools
Paper topographic map: Primary reference for positioning and terrain analysis
Geological or field compass: For determining directions and aligning the map with the real world
Measuring tape: Used to measure distances between visible points
Telescope or field binoculars: For viewing distant features and matching them with map locations
Field notebook: For recording observations, sketches, and real-time diagrams
Modern Digital Tools
Global Positioning System (GPS): For recording precise geographic coordinates and mapping them directly
Smartphones and tablets: Equipped with topographic map apps and GIS tools for real-time navigation and data logging
Digital camera or smartphone: For capturing geotagged photos of field features
Digital measuring devices (e.g., altimeter, slope meter): To record precise terrain differences
These tools complement each other, with maps serving as visual guides and instruments assisting in measurement, documentation, and spatial analysis assuring accurate data collection that can later be processed through GIS or remote sensing software.
Kirkuk Governorate as A Field Example
Study Area Selection: Kirkuk Governorate: Kirkuk, located in northern Iraq, was chosen as the applied case study due to its diverse topography, natural resources, and environmental variety. Its geographical location—between latitudes 35°30′ and 35°50′ N, and longitudes 44°00′ and 44°20′ E—makes it an ideal area for testing the effectiveness of topographic maps in fieldwork.
Kirkuk is bordered by Erbil to the north, Sulaymaniyah to the east, Salah al-Din to the south, and Nineveh to the west. The terrain gradually changes from flat plains in the southwest to mountainous areas in the northeast. It is crossed by seasonal water channels and contains a mix of agricultural land, urban areas, and oil fields.
A 1:50,000 topographic map was used to cover a representative section of the governorate, combining natural terrain and human land use. Several field visits were conducted to document geographic features and compare them with the map’s content (See Map 2).
This selection allowed a realistic evaluation of the map's effectiveness in field planning, geographical observation, and accurate assessment.
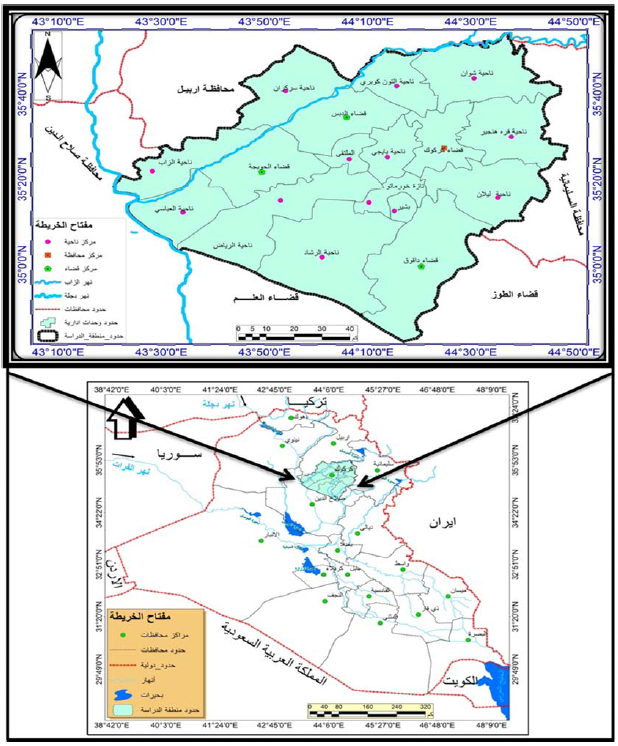
Map 2: Topographic Map of Kirkuk Governorate
Source: Prepared by the researcher using the Military Survey Directorate, Iraq Administrative Map, and ArcGIS 10.8 outputs
Practical Application of the Topographic Map in Kirkuk
As part of the research, the 1:50,000 scale topographic map of Kirkuk was used to conduct an applied field study aimed at assessing the map’s role in planning and terrain analysis.
The study began by identifying key study locations on the map, covering varied terrain from flat plains to elevated zones. Contour lines were analyzed to determine slopes, elevations, and seasonal watercourses, as well as both natural and human features (See Map 3).
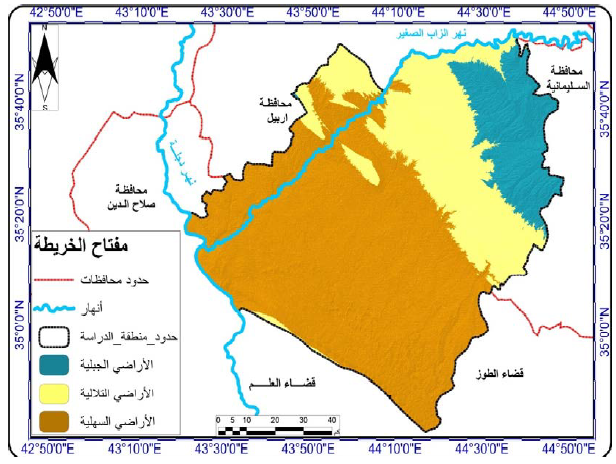
Map 3: Natural Features of Kirkuk Governorate
Source: Created by the researcher based on the 1:100,000 Iraq topographic map and ArcGIS 10.8 outputs
In the field, GPS devices were used to match real locations with mapped ones. A field compass was used to measure directions, while observations on soil type, vegetation, and land use were recorded. Topographic profiles were drawn from contour data to visualize elevation changes and assess land suitability for agriculture or urban development.
Findings revealed that the topographic map provided sufficient accuracy in representing key terrain features, assisted in planning safe and efficient routes, and supported effective distribution of research teams. It also helped identify steep zones requiring caution and flat areas suitable for development.
This application demonstrated the indispensable value of topographic maps in conducting fieldwork in Kirkuk by providing a reliable planning foundation and enhancing data collection and interpretation.
Comparing Field Results with Cartographic Representation
A thorough review of range-findings reported from the field and the representation of those landscape features on a topographic map revealed that the two sources were highly comparable, particularly for physical landscape features such as mountain peaks and valleys, watercourses, as well as the presence of towns and road layouts.
However, in cases where there had been land use changes (new agricultural areas or new road and town development) since the topographic maps were made, there were a few inconsistencies when they were compared (the maps did not include the changes made since their production). Human modifications, such as road construction and expansion of the built environment, seemed to be the sources of a small amount of inaccuracy in representing the landscape on the maps.
The findings of this investigation show the necessity of updating the topographic maps periodically and using a digital format which allows one to continually edit and update maps using remote sensing and GIS. While the topographic map is a primary tool in fieldwork, landscapes and human activities in the landscape must always be checked and verified in the field - for complete accuracy.
Ultimately, this study revealed that something as traditional as topographic maps can be treated as reliable representations, and as practical and substantive sources of knowledge in geographical research in the field. However, the results speak to the wisdom of combining them with field data to render them even more accurate and relevant with respect to that landscape and time context for analysis.
Considering the discussions developed in this paper about the importance of topographic maps in field-based geographical research, they are still a critical and unique way of precisely, richly, and effectively on the ground mapping, measuring, analyzing, and understanding terrain and geographical phenomena. The applied case study completed in Kirkuk Governorate, in Iraq in particular, reinforces how topographic maps have special relevance for planning in the field, locating precise places to study, and examining topographic features that affect diverse land uses.
The results also indicate that the usefulness of topographic maps is potentially relevant to their periodic updating and correspondence to field reality, which necessitates the use of GIS and remote sensing. In addition, when topographic maps augment field data, aspects of the total geographical research experience are ameliorated, and the chances of poorly representing reality are reduced.
It is suggested to improve the use of topographic maps during field studies, especially in terms of regularly updating maps and teaching map reading and field interpretation skills. Moreover, the study also supports creating comprehensive spatial databases that will combine topographic maps with recent and modern digital technologies to provide topographic maps with the greatest consideration for their application in a variety of fields of geography.
On a final note, topographic maps constitute one of the bedrock components of field-based geography work, a vital piece of building spatial knowledge and effectively accomplishing research and planning goals.
Tarolli, P. "High-resolution topography for understanding Earth surface processes: Opportunities and challenges." Geomorphology, vol. 216, 2014, pp. 295–312. https:// doi. org/ 10.1016/j.geomorph.2014.03.008.
Fernandes-Da-Silva, P.C. and J. Cripps. "Geo-environmental terrain assessments based on remote sensing tools: A review of applications to hazard mapping and control." In Broniewicz, E., ed. Environmental Management in Practice. IntechOpen, 2011. https://doi.org/10.5772/24487.
Nwilag, B.D. et al. "Digital topographic mapping and modelling using low altitude unmanned aerial vehicle." Modeling Earth Systems and Environment, vol. 9, no. 2, 2023, pp. 1463–76. https://doi.org/10.1007/s40808-022-01677-z.
O'Sullivan, D. "Complexity science and human geography." Transactions of the Institute of British Geographers, vol. 29, no. 3, 2004, pp. 282–95. https://doi.org/10.1111/j.0020-2754.2004.00321.x.
Uhl, J.H. et al. "Map archive mining: Visual-analytical approaches to explore large historical map collections." ISPRS International Journal of Geo-Information, vol. 7, no. 4, 2018, p. 148. https://doi.org/10.3390/ijgi7040148.
Freeman, H. and S.P. Morse. "On searching a contour map for a given terrain elevation profile." Journal of the Franklin Institute, vol. 284, no. 1, 1967, pp. 1–25. https:// doi.org/ 10.1016/0016-0032(67)90568-6.
Liben, L.S. and R.M. Downs. "Understanding maps as symbols: The development of map concepts in children." Advances in Child Development and Behavior, vol. 22, 1989, pp. 145–201. https://doi.org/10.1016/s0065-2407(08)60414-0.
Bailey, H. and D. Smaldone. "Geointerpretation: The interpretive potential of maps." Journal of Interpretation Research, vol. 12, no. 2, 2007, pp. 45–59. https:// doi. org/ 10.1177/109258720701200204.
Siegel, A.W. and S.H. White. "The development of spatial representations of large-scale environments." Advances in Child Development and Behavior, vol. 10, 1975, pp. 9–55. https://doi.org/10.1016/s0065-2407(08)60007-5.
Miller, B.A. and R.J. Schaetzl. "The historical role of base maps in soil geography." Geoderma, vols. 230–231, 2014, pp. 329–39. https://doi.org/10.1016/j.geoderma.2014.04.020.
Collier, P. "The impact on topographic mapping of developments in land and air survey: 1900–1939." Cartography and Geographic Information Science, vol. 29, no. 3, 2002, pp. 155–74. https:// doi.org/ 10.1559/ 152304002782008440.
Chilton, D. "Land measurement in the sixteenth century." Transactions of the Newcomen Society, vol. 31, no. 1, 1957, pp. 111–29. https://doi.org/10.1179/tns.1957.005.
Uluocha, N. "Fifty years of post-colonial mapping in Nigeria: An overview." Cartographica, vol. 47, no. 3, 2012, pp. 179–94. https://doi.org/10.3138/carto.47.3.1069.
Usery, E.L. et al. "Topographic mapping evolution: From field and photographically collected data to GIS production and linked open data." The Cartographic Journal, vol. 55, no. 4, 2018, pp. 378–90. https://doi.org/10.1080/00087041.2018.1539555.
Barbarella, M. et al. "Topographic base maps from remote sensing data for engineering geomorphological modelling: An application on coastal Mediterranean landscape." Geosciences, vol. 9, no. 12, 2019, p. 500. https:// doi. org/ 10.3390/geosciences9120500.
Xiong, L. et al. "Geomorphometry and terrain analysis: Data, methods, platforms and applications." Earth-Science Reviews, vol. 233, 2022, article 104191. https:// doi. org/ 10.1016/j.earscirev.2022.104191.
Ruan, L. et al. "A platform and its applied modes for geography fieldwork in higher education based on location services." ISPRS International Journal of Geo-Information, vol. 10, no. 4, 2021, p. 225. https://doi.org/10.3390/ijgi10040225.
