
+91 6002993949
submission@iarconsortium.org
Open Access
ISSN (Print) : 2708-5155
ISSN (Online) : 2708-5163
This study aims to determine how feasible it would be to power a house in a far-flung neighborhood of the Turkish city of Siirt with a hybrid energy system consisting of wind turbines, photovoltaic cells, a diesel generator and storage batteries. From a technological and financial standpoint, various hybrid system configurations, the potential for using renewable energy sources, and the effects of using a system with a scheduled diesel generator are all examined. The Hybrid Optimization of Multiple Electric Renewables (HOMER) evaluates the viability of various system configurations to deliver the required 39.74 kWh/day at a peak load of 4.72 kW. The HOMER program was used to investigate the best designs and parameters for systems that generate electricity. The best configuration is chosen by comparing the Net Present Cost (NPC) and the Cost of Energy (COE) across ten different hybrid system cases with an unscheduled diesel generator and six different hybrid system cases with a scheduled diesel generator. HOMER has found the best and least expensive way to solve the problem. The most technologically and economically feasible system configurations are 14.8 kW PV system, 5.2 kW diesel generator, 42 batteries, and 4.33 kW converter for the system with an unscheduled diesel generator and 14.7 kW PV system, 5.2 kW diesel generator, 62 batteries, and 4.64 kW converter for the system with a scheduled diesel generator. Among all the alternatives, the hybrid PV/Diesel/Battery system is considered to have the best technical performance. It also showed that the best results for the economy and the environment, which makes the system more sustainable. The system with an unscheduled diesel generator has a minimum (NPC) of 49.032 dollars and a minimum (COE) of 0.262 ($/kWh), while the system with a scheduled diesel generator has a minimum NPC of 52.573 dollars and a minimum COE of 0.0281($/kWh). In addition, the system with a scheduled diesel generator is more environmentally friendly because it emits less CO2 and other gases than the system with an unscheduled diesel generator.
Turkish energy policy has continued to be guided by market reform and energy security since the International Energy Agency (IEA) in-depth review of Turkey in 2016. Over the past two decades, rapid economic and population expansion have increased import dependency in addition to driving a significant increase in energy demand. In order to rationalize the expansion of its energy consumption, reduce consumer energy costs, and slow the rate of import increase, Turkey has sought a reform of its energy system.
Turkey's economy is still heavily dependent on imports, particularly those of oil and gas (93 and 99%, respectively), and is still driven by fossil fuels. Turkey has made increasing local exploration and production a priority to lessen its reliance on oil and gas imports. However, given the limitations of upstream resources and taking an emissions reduction into account, Turkey should also give cost-effective demand-side measures like efficiency gains and fuel switching in the transportation sector, which is still 98% dependent on oil, fair consideration. Furthermore, Turkey still has a lot of room to expand its use of renewable energy sources, not just for electricity but also for other purposes like heating [1].
Many people on the planet live in remote or rural areas that are physically cut off from the grid, especially in developing countries. Without a steady supply of fuel, it is very challenging to supply these locations with electricity. Finding hybrid solutions based on renewable energy for electrifying rural or off-grid communities is additionally vital due to the challenge of bringing fossil fuels to remote regions and their negative environmental effects.
According to a report on renewable energy source [2], these sources provide 22.8% of the world's electricity, with fossil fuels and nuclear power plants providing the remaining 77.2%. This survey estimates that approximately 1.1 billion people worldwide lack access to electricity.
In a 2020 study [3], the authors presented a case study of the design of a stand-alone hybrid renewable microgrid for a remote community in Pakistan. Levelized Cost of Energy (LCOE), (NPC), and emissions were employed in the analysis of the hybrid system that used PV, wind, diesel, and batteries. According to simulation results, PV-wind-battery had the lowest (LCOE), at $0.311 per kWh. HOMER Pro software was used in this investigation.
A hybrid off-grid PV, wind, diesel, and battery energy system was built and analyzed in Malaysia's KLIA Sepang Station to guarantee the power supply to a decentralized community [4]. Other Malaysian territories with comparable weather conditions can use this approach. To ensure that the system's activities are sufficiently realistic in regard to the NPC, they are optimized and simulated. The findings show that when compared to conventional power plants, the NPC may be reduced by about 29.65%. Additionally, it reveals that CO2 and other GHG emissions can be reduced by 25% annually compared to conventional power plants, demonstrating that it is an environmentally friendly energy system.
A study investigated the best mix of renewable energy technologies, under Jordan's climatic conditions, to satisfy a single house's energy needs [5]. Ten alternative scenarios were assessed among several configured energy systems (wind, PV, and diesel with storage) to determine the optimal system configuration for the given technical and financial climate. This experiment found that the Initial Capital Cost ($), Operating Cost ($/yr), Total Net Present Cost ($), and Cost of Electricity (COE) ($/kWh) based on economic and feasibility considerations. They discovered that a PV, diesel with batteries system with an NPC of $66,012 and a COE of $0.338 per kWh was the most economical configuration.
One study investigated the performance of a stand-alone hybrid wind and solar system with a backup diesel system in KSA [6]. This study found that expanding wind farms can cut the amount of diesel energy produced by 25% and the amount of time a diesel system is operating by 18%. This study demonstrated that expanding the PV area is not practical. A battery storage system that could store energy for 24 hours of peak demand was used in this study, which lowered the amount of diesel energy produced by 17% and the amount of time the diesel system was in operation by 30%. According to research that examined various configurations of Wind Energy Conversion Systems (WECS) [6], PV panels, and diesel backup with battery storage, it is necessary for 17% of the energy demand to be generated from the diesel backup when using 10-kW WECS with 150 m2 of PV Panels and 3 days of battery storage, as opposed to 38% without a battery.
Numerous studies have documented the best hybrid system configurations, including PV/Wind/Diesel/Battery systems [7-14]. Meanwhile, compared to wind turbines, PV systems have demonstrated cheaper costs and more applicability [15].
The majority of studies [16-20] have recommended hybrid PV/diesel systems for rural electrification. Furthermore, some research has looked into the feasibility and techno-economic viability of using various hybrid system designs in remote locations [21-25]. Based on the previous literature, it is clear that the majority of studies in this area have been created with the goal of determining the ideal design, assessing the potential, or researching the techno-economic viability for typical hybrid systems. These studies generally demonstrate that hybrid systems offer higher levels of reliability and lower LCOE than single source electricity. However, these studies do not consider the effect of using a system that contains a schedule diesel generator, despite how crucial it is to the system.
The purpose of this research is to determine the best hybrid energy system combination to meet the energy needs of a single house in Siberia, for one system with a scheduled diesel generator and the other with an unscheduled diesel generator. This study is anticipated to be extremely helpful in making decisions in any area with similar conditions.
Site Description: Siirt is a pretty province in Southeast Anatolia that is separated from this province by the Tigris River and is situated 224 kilometers (140 miles) northeast of Mardin [26]. Siirt is located at latitude 37.927404 and longitude 41.941978, as shown in Figure 1. With extremely hot, dry summers and chilly, wet winters, Siirt experiences a hot Mediterranean summer climate. Winter brings frequent frost and sporadically falling snow [27,28]. As of 2021 the population of the province is a little over 330 thousand [29]. The province encompasses a land area of 5,406 km2. Its water network is made up of the Tigris River and its tributaries. Promoting the province's pistachio and vegetable cultures has great potential. Finally, Siirt has abundant reserves of asphalt, copper, and chrome [26] (Figure 1).
Figure 1: Location of Siirt
Utilized Software
Homer pro: Using a combination of conventional and renewable energy sources, load management, and storage, hybrid microgrid and grid-connected systems may be built with the help of the HOMER software. The system configuration is useful for determining such questions as: which parts should be included in the system's design, how many of them, and what size they should be [30].
The Homer Simulation
Typically, HOMER runs its simulations in three stages as described by [5,31]:
Pre-Analysis: Setting the technical and financial specifications of the hardware components to be inserted, recognizing energy sources and load needs both non-renewable and renewable resources, and deciding how the system will be set up (Figure 2). In addition, measurements are carried out of the site's temperature, wind speed, and solar radiation
Analysis: Input data is used to run simulations of different system configurations; the resulting list of feasible configurations is then ranked by (NPC). User load requirements, fuel cost, and discount rate must be met
Post-Analysis: On the basis of technical, financial, and environmental preferences, the optimized system is selected from among all possible system combinations after comparing the outputs of various systems
Model Design Input
Figure 2 is a schematic representation of the hybrid system's conceptual design layout, as described in the HOMER pro user manual [32]. The system consists of PV modules (model CS6U-340M), a wind turbine (model XL1), a diesel generator (Gen), batteries (Iron), a power demand (electrical), and a converter. The model's Alternating Current (AC) side contains a load demand, a wind turbine, and a diesel generator. Direct Current (DC) connections are made between the battery bank and PV modules. The converter, whose function is to transform DC power into AC, is situated between the two power sources.
Figure 2: HOMER Microgrid System Schematic with Loads, Generation and Storage
Electricity Load and Demand
The house in Siirt that is being used for this research has many different appliances, such as a lighting unit, a television, a computer, a refrigerator, a kettle, a microwave, a washing machine, an air conditioner, and a water heater. The power rating of each appliance is considered, followed by an estimate of its quantity and operating hours, to determine overall electrical consumption. Table 1 shows that the case requires 39.74 kWh/day and 4.72 kW peak load. Using HOMER, we determined that a residential load profile best suited our needs, and then adjusted the average load and peak load accordingly. Daily load profile for a typical home is shown in Figure 3.
Table 1: Demand and Load Analysis for the Electric System
Appliance | Power (Watt) | Number | Average hrs/day | Average Wh/day |
Washing machine | 800 | 1 | 1 | 800 |
air conditioner | 1000 | 2 | 6 | 12000 |
Water Heater | 3000 | 1 | 5 | 15000 |
Microwave | 900 | 1 | 0.6 | 540 |
Kettle | 2500 | 1 | 0.4 | 1000 |
Refrigerator | 250 | 1 | 24 | 6000 |
Computer | 70 | 2 | 2.5 | 350 |
TV | 110 | 1 | 5 | 550 |
iron | 1200 | 1 | 1 | 1200 |
Light | 16 | 18 | 8 | 2304 |
Total Wh/day | 39744 | |||
Figure 3: Three Types of Load Profiles: (a) Daily, (b) Seasonal and (c) Yearly
Weather Information
Siirt, in Southeast Anatolia, is the region picked for this study. Latitude 37.927404 and longitude 41.941978 are the coordinates for Siirt. The Surface Meteorology and Solar Energy Database (SMSE) at the National Aeronautics and Space Administration (NASA) provide yearly averages for solar radiation and wind speed [32]. Throughout the year, the sun provides an average of 4.77 kWh/m2 per day of energy, and the average clearness index is 0.5. For the location chosen, the average monthly solar radiation over a 22-year time period (1983- 2005). is shown in Figure 4. The average annual wind speed is 4.76 m/s. As shown in Figure 4, According to the HOMER software, the highest average wind speed occurs in July, and the lowest average wind speed occurs in November. These measurements were taken 50 m above the earth's surface (July 1983–June 1993) using monthly averaged values over a 10-year period.
The ambient temperature and solar radiation have the biggest impacts on the solar PV system's output power. Figure 4 shows the selected location's average monthly air temperature values over a 22-year period as well as the area's average monthly ambient temperature (July 1983-June 2005).
Figurer 4: Each Month's Average Daily Solar Radiation, Clearness Index, Monthly Average Wind Velocity and Average Monthly Ambient Temperature
System Components
In HOMER, a variety of power system components, such as wind turbines, solar panels, converters, diesel generators, and batteries, are used to provide the energy necessary to meet household demand. Table 2 provides a summary of the technical and financial information of system components that will be integrated in HOMER software.
Table 2: Financial and Technical Information about System Components
Battery | |
Factors | Value |
Model | Iron Edison |
Nominal voltage | 12 Volt |
Capacity | 100 Ah |
Capital cost | $170/unit |
Replacement cost | $130/unit |
Operating and Management cost | $10/year. |
Initial state of charge | 100% |
Minimum state of charge | 30% |
Life throughput per battery | 11,880kWh |
PV | |
Factors | Value |
Model | CS6U-340M |
Rated capacity | 0.34kW |
Capital cost | $750/kW |
Replacement cost | $0/kW |
Operating and Management cost | $28/year |
Temperature co-efficient | -0.41/ |
Efficiency | 17.49% |
Operation temperature | 45 |
Battery | |
Factors | Value |
Capital cost | $890 |
Lifetime | 15years |
Replacement cost | $800 |
Operating and Management cost | $10/kW/year |
| |
Efficiency | 95% |
Wind Turbine | |
Factors | Value |
Model | Bergey BWC XL.1 |
Rated capacity | 1 kW |
Capital Cost (CC) | $6,700/kW |
Replacement cost | $4,500/kW |
O & M cost | $115/year |
Cut in wind speed | 4 m/s. |
Cut out wind speed | 22 m/s. |
Rated wind speed | 13 m/s. |
Lifetime | 15,000 hr. |
Hub height | 10 m. |
Diesel Generator | |
Factors | Value |
Brand name | Autosize Genset |
Size | 5.2kW |
Capital cost | $650.00 |
Replacement cost | $550.00 |
Operating and Management cost | $0.05/hr. |
Minimum running hours | 15,000hr. |
Minimum load ratio | 25.00% |
Fuel Cost ($/L) | $1.28/L |
Scheduled and Unscheduled Diesel Generator
When battery banks and other renewable energy sources, like solar and wind power, are unable to supply the necessary power, a diesel generator is used in this work. Once the auto-size generator has been selected, based on peak demand plus 10%, HOMER calculates the diesel generator's capacity. In this situation, a 5.2 kW diesel generator (peak demand 4.72 ´ 1.1 = 5.2) with a 15000-hour lifetime is appropriate for this hybrid system.
A diesel generator is thought to be 35% efficient. The generator's maximum load ratio is 25%. The price of fuel was estimated at $1.28 per liter.
A scheduled diesel generator with its operating hours is shown in Figure 5. To prevent any disruptions, this generator was turned off during school hours. However, this restriction does not apply on weekends or when an unscheduled diesel generator was running.
Economic Analysis
For HOMER simulation to work, economic input parameters like project lifetime and project annual real interest rate are necessary [8]. HOMER ranks systems by net present cost after simulation. Levelized Cost of Energy (LCOE) is another useful metric for comparing system configurations [33]. The following sections will discuss each of these economic factors.
Annual Real İnterest Rate
Used to convert one-time costs to annualized costs [31]. It is determined using Equation 1:

Using Equation 1, we can determine that i (%) is the real interest rate, i′ (%) is the nominal interest rate, and f (%) is the inflation rate. This study has a 25-year project life with an 8% discount rate and 2% inflation rate.
Net Present Cost
The present value of a system's lifetime costs less its lifetime revenues is known as the total Net Present Cost (NPC). According to Equations 2 and 3, the total NPC is used to rank and base the optimization results of the HOMER simulation:
Including the costs of replacement, capital, O&M, and fuel, the annualized cost is denoted by the symbol "Cann,tot", which stands for dollars per year. Present value of a series of equal annual cash flows is calculated using the Capital Recovery Factor (CRF), where I is the real interest rate expressed as a percent and N is the total number of years in which the project is expected to be operational [34].
Cost of Energy
The cost of supplying, producing, and creating energy is the Cost of Energy (COE), which is the standard definition of the typical cost of usable electrical energy measured in ($/kWh) [35]. The Equations 4 and 5 represent the calculation of (COE):
Es is annual energy consumption, CA (%) is total annualized cost, CA_cap is annualized capital cost, CA_rep is annualized replacement cost, and CA _O&M is annualized O&M cost.
Life Cycle Emissions (LCE)
The unit (kg CO2-eq/yr) represents the equivalent CO2 emissions from a year's energy use. The mathematical expression for calculating LCE is shown in the following equation [9]:
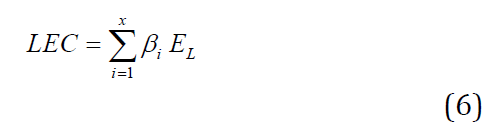
x represents the number of components, βi (kg CO2-eq/kWh) represents each component's lifetime equivalent CO2 emissions, and EL (kWh) represents each component's energy generated or stored.
After specifying the technical and location and financial information for wind turbine, solar PV modules, Batteries, Diesel generator, and Converter, It would be possible for HOMER to initiate simulation and calculation [31]. The outcomes of the microgrid design using HOMER will be discussed and analyzed in this section.
Table 3: Description of the Optimization Results for the System with an Unscheduled Diesel Generator
| Combination | PV Panels (kW) | Wind Turbines (kW) | Diesel Generators (kW) | # of Batteries | Converters (kW) | Total NPC ($) | COE ($/kWh) |
PV/Diesel/Batteries/Converter | 14.8 | 0 | 5.2 | 42 | 4.33 | 49,032 | 0.262 |
PV/Wind/Diesel/Batteries/Converter | 14.3 | 1 | 5.2 | 40 | 4.32 | 56,234 | 0.306 |
PV/Batteries/Converter | 25 | 0 | 0 | 108 | 5.01 | 68,583 | 0.366 |
PV/Wind/Batteries/Converter | 24.4 | 1 | 0 | 104 | 4.99 | 75,424 | 0.403 |
Diesel/Batteries/Converter | 0 | 0 | 5.2 | 18 | 2.93 | 119,382 | 0.637 |
Wind/Diesel/Batteries/Converter | 0 | 1 | 5.2 | 18 | 2.98 | 122,100 | 0.651 |
PV/Diesel/Converter | 26.9 | 0 | 5.2 | 0 | 3.27 | 155,800 | 0.831 |
PV/Wind/Diesel /Converter | 26.1 | 1 | 5.2 | 0 | 3.16 | 162,405 | 0.866 |
Diesel Generator | 0 | 0 | 5.2 | 0 | 0 | 164,230 | 0.876 |
Wind/Diesel/ | 0 | 1 | 5.2 | 0 | 0 | 169931 | 0.906 |
Table 4: Description of the Optimization Results for the System with a Scheduled Diesel Generator
| Combination | PV Panels (kW) | Wind Turbines (kW) | Diesel Generators (kW) | # of Batteries | Converters (kW) | Total NPC ($) | COE ($/kWh) |
PV/Diesel/Batteries/Converter | 14.7 | 0 | 5.2 | 62 | 4.64 | 52,573 | 0.281 |
PV/Wind/Diesel/Batteries/Converter | 16 | 1 | 5.2 | 58 | 4.57 | 60,421 | 0.322 |
PV/Batteries/Converter | 25 | 0 | 0 | 108 | 5.01 | 68,583 | 0.366 |
PV/Wind/Batteries/Converter | 24.4 | 1 | 0 | 104 | 4.99 | 75,424 | 0.403 |
Wind/Diesel/Batteries/Converter | 0 | 19 | 5.2 | 288 | 12.9 | 287,996 | 1.54 |
Wind/Batteries/Converter | 0 | 32 | 0 | 268 | 13.3 | 382,259 | 2.04 |
Figure 6: (a) Annual Electrical Production for Each Optimization Result for the System with a Scheduled Diesel Generator (b) Annual Electrical Production for each Optimization Result for the System with an Unscheduled Diesel Generator
Figure 7: (a) Cost Summary of most Attractive Results, an Unscheduled Diesel Generator (b) A Scheduled Diesel Generator
Optimization Analysis
For the system with an unscheduled diesel generator, ten different scenarios are evaluated, and for the system with a scheduled diesel generator, six different scenarios are evaluated in order to determine the best configuration for the system both economically and technically. Even though HOMER ran simulations on many parts of the energy system, it only shows the hybrid system scenarios that can be put into action. All optimization results for both systems are characterized by a focus on NPC and COE, as shown in Tables 3 and 4.
After investigating the effect of utilizing a scheduled diesel generator in a hybrid system and comparing it to a system that uses the same loads with an unscheduled diesel generator, the results show the best optimization outcomes for both systems. These outcomes are listed beginning with the Lowest Net Present cost (NPC). Based on feasibility and economic considerations, the Homer program assists us in obtaining all of these results. Figures 6a and 6b illustrate the annual electrical generation for each optimization result.
Cost Analysis
According to HOMER, the most attractive result for the system with an unscheduled diesel generator is a combination of 14.8 kW (model CS6U-340M), 4.33 kW converter, 5.2 kW (Gen), and 42 (iron), and the most attractive result for the system with a scheduled diesel generator is a combination of 14.7 kW (model CS6U-340M), 5.2 kW (Gen), 4.64 kW converter, and 62 (iron) batteries.
Figure 8: (a) Nominal Cash Flow for Sensitivity Results, an Unscheduled Diesel Generator (b) A Scheduled Diesel Generator
Figure 9: (a) Monthly Average Electrical Production for Sensitivity Results, an Unscheduled Diesel Generator (b) A Scheduled Diesel Generator
Figure 10: (a) Gas Emissions for Optimization Results for both Systems, an Unscheduled Diesel Generator (b) A Scheduled Diesel Generator
Figure 11: Gas Emissions for the Best Optimal Design, (1) For the System with an Unscheduled (Gen), (2) For the System with a Scheduled (Gen)
In these solutions, the NPC and COE values were 49.032$ and 0.262 $/kWh for the system with an unscheduled diesel generator and 52.573$ and 0.281 $/kWh for the system with a scheduled diesel generator, respectively. Figure 7 depicts the cost summary for these solutions. Additionally, Figure 8 describes the Nominal Cash Flow for the aforementioned solutions. Moreover, the average monthly electrical production for these solutions is shown in Figure 9. By employing renewable energy sources (PV) in these solutions, we can get better results in terms of emissions, as shown in Figure 10.
Figure 11 demonstrates that, in the optimal design of the system with a scheduled diesel generator, the use of more sustainable energy sources (PV) results in lower gas emissions compared to the optimal design of the system with an unscheduled diesel generator.
Additionally, Figure 8 describes the Nominal Cash Flow for the aforementioned solutions.
Moreover, the average monthly electrical production for these solutions is shown in Figure 9.
By employing renewable energy sources (PV) in these solutions, we can get better results in terms of emissions, as shown in Figure10.
Figure11 demonstrates that, in the optimal design of the system with a scheduled diesel generator, the use of more sustainable energy sources (PV) results in lower gas emissions compared to the optimal design of the system with an unscheduled diesel generator.
This study compares two hybrid energy systems using scheduled and unscheduled diesel generators to suit a single family domestic residential building energy needs in Siirt climate. Environmental and economic considerations made the systems practicable. After studying ten hybrid system cases for the unscheduled diesel generator and six for the scheduled diesel generator, the optimal configuration is identified based on Cost of Energy and Net Present Cost. The system configuration that uses all (model CS6U-340M), a diesel generator (Gen), (Iron) batteries and converters simultaneously is the most technologically and economically feasible, with 14.8 kW (model CS6U-340M) system, 5.2 kW(Gen), 42 (Iron) batteries, and 4.33 kW converter for the system with an unscheduled diesel generator and 14.7 kW (model CS6U-340M) system, 5.2 kW (Gen), 4.64 kW converter and 62 (iron) batteries for the system with a scheduled diesel generator.
The following are the main findings of this study:
The optimal hybrid system configuration's Net Present Cost and Cost of Energy were 49.032 $, 0.262 $/kWh for the system with an unscheduled diesel generator and 52.573 $, 0.281 $/kWh for the scheduled diesel generator system
According to the analysis, the optimal hybrid system with a scheduled diesel generator emits less CO2 and other gases than the system with an unscheduled diesel generator, resulting in an environmentally friendly solution
Acknowledgments
This work was supported by the Scientific Research Support Fund of The….University, Kayseri, Turkey, project number FF.11111.
Authors’ Contributions
Anas Mohammad, AO and TU designed the structure. AO grew the sample according to the specifications. AO fabricated the device, carried out the experiments work, the theoretical calculations, in collaboration with TU, and wrote up the article. TU is the inventor of the original device and the overall supervisor of the project. Both authors read and approved the final manuscript.
Competing Interests
The authors declare that they have no competing interests.
International Energy Agency. “Turkey 2021.” 2021.
REN21. “Renewables 2016 global status report.” 2016. doi: ISBN 978-3-9818107-0-7.
Al-Ammar, E.A. et al. “Residential community load management based on optimal design of standalone HRES with model predictive control.” IEEE Access, no. 8, 2020, pp. 12542–12572. https://doi.org/10.1109/ACCESS.2020.2965250.
Shezan, S.A. et al. “Performance analysis of an off-grid wind-PV (photovoltaic)-diesel-battery hybrid energy system feasible for remote areas.” Journal of Cleaner Production, no. 125, 2016, pp. 121–132. https://doi.org/10.1016/j.jclepro.2016.03.014.
Al-Rashed, R. et al. “Potential of using off-grid PV/wind/diesel battery hybrid energy system in Jordan.” Proceedings of the 12th International Renewable Energy Conference (IREC 2021), 2021, pp. 0–6. https://doi.org/10.1109/IREC51415.2021.9427825.
Elhadidy, M.A. “Performance evaluation of hybrid (wind/solar/diesel) power systems.” Renewable Energy, vol. 26,no. 3, 2002, pp. 401–413. https://doi.org/10.1016/S0960-1481(01)00139-2.
Hossain, M. et al. “Performance evaluation of a stand-alone PV-wind-diesel-battery hybrid system feasible for a large resort center in South China Sea, Malaysia.” Sustainable Cities and Society, vol. 28, 2017, pp. 358–366. https://doi.org/10.1016/j.scs.2016.10.008.
Ngan, M.S. and C.W. Tan. “Assessment of economic viability for PV/wind/diesel hybrid energy system in southern Peninsular Malaysia.” Renewable and Sustainable Energy Reviews, vol. 16, no. 1, 2012, pp. 634–647. https://doi.org/10.1016/j.rser.2011.08.028.
Mandal, S. et al. “Optimum sizing of a stand-alone hybrid energy system for rural electrification in Bangladesh.” Journal of Cleaner Production, vol. 200, 2018, pp. 12–27. https://doi.org/10.1016/j.jclepro.2018.07.257.
Hassan, Q. et al. “Optimization of PV/wind/diesel hybrid power system in HOMER for rural electrification.” Journal of Physics: Conference Series, vol. 745, no. 3, 2016. https://doi.org/10.1088/1742-6596/745/3/032006.
Purlu, M. et al. “Optimal sizing of a hybrid PV, wind and micro-hydro system for rural electrification using LPO.” Energy Conversion and Management, vol. 28, no. 1, 2021, pp. 1–7. https://doi.org/10.1109/IREC51415.2021.9427825.
Li, C. et al. “Techno-economic performance study of stand-alone wind/diesel/battery hybrid system with different battery technologies in the cold region of China.” Energy, vol. 192, 2020. https://doi.org/10.1016/j.energy.2019.116702.
Kaabeche, A. and R. Ibtiouen. “Techno-economic optimization of hybrid photovoltaic/wind/diesel/battery generation in a stand-alone power system.” Solar Energy, vol. 103, 2014, pp. 171–182. https://doi.org/10.1016/j.solener.2014.02.017.
Salisu, S. et al. “Assessment of technical and economic feasibility for a hybrid PV-wind-diesel-battery energy system in a remote community of north central Nigeria.” Alexandria Engineering Journal, vol. 58, no. 4, 2019, pp. 1103–1118. https://doi.org/10.1016/j.aej.2019.09.013.
Hazelton, J. et al. “A review of the potential benefits and risks of photovoltaic hybrid mini-grid systems.” Renewable Energy, vol. 67, 2014, pp. 222–229. https://doi.org/10.1016/j.renene.2013.11.026.
Khatib, T. et al. “Optimal sizing of building integrated hybrid PV/diesel generator system for zero load rejection for Malaysia.” Energy and Buildings, vol. 43, no. 12, 2011, pp. 3430–3435. https://doi.org/10.1016/j.enbuild.2011.09.008.
Neves, D. et al. “Design and implementation of hybrid renewable energy systems on micro-communities: a review on case studies.” Renewable and Sustainable Energy Reviews, vol. 31, 2014, pp. 935–946. https://doi.org/10.1016/j.rser.2013.12.047.
Ajan, A.H., C.W. Ahmed and S.S. Ahmed. “On the policy of photovoltaic and diesel generation mix for an off-grid site.” Solar Energy, vol. 74, 2003, pp. 453–467.
Barkhouse, D.A.R. et al. “Yield predictions for photovoltaic power plants: empirical validation, recent advances and remaining uncertainties.” Progress in Photovoltaics: Research and Applications, vol. 20, no. 1, 2015, pp. 6–11. https://doi.org/10.1002/pip.
Phuangpornpitak, N. and S. Kumar. “PV hybrid systems for rural electrification in Thailand.” Renewable and Sustainable Energy Reviews, vol. 11, no. 7, 2007, pp. 1530–1543. https://doi.org/10.1016/j.rser.2005.11.008.
Vendoti, S. et al. “Techno-economic analysis of off-grid solar/wind/biogas/biomass/fuel cell/battery system for electrification in a cluster of villages by HOMER software.” Environment, Development and Sustainability, vol. 23, no. 1, 2021, pp. 351–372. https://doi.org/10.1007/s10668-019-00583-2.
Kolhe, M.L. et al. “Techno-economic sizing of off-grid hybrid renewable energy system for rural electrification in Sri Lanka.” Sustainable Energy Technologies and Assessments, vol. 11, 2015, pp. 53–64. https://doi.org/10.1016/j.seta.2015.03.008.
Elsaraf, H. et al. “Techno-economic design of a combined heat and power microgrid for a remote community in Newfoundland Canada.” IEEE Access, vol. 9, 2021, pp. 91548–91563. https://doi.org/10.1109/ACCESS.2021.3091738.
Haghighat Mamaghani, A. et al. “Techno-economic feasibility of photovoltaic, wind, diesel and hybrid electrification systems for off-grid rural electrification in Colombia.” Renewable Energy, vol. 97, 2016, pp. 293–305. https://doi.org/10.1016/j.renene.2016.05.086.
Elkadeem, M.R. et al. “Feasibility analysis and techno-economic design of grid-isolated hybrid renewable energy system for electrification of agriculture and irrigation area: a case study in Dongola, Sudan.” Energy Conversion and Management, vol. 196, 2019, pp. 1453–1478. https://doi.org/10.1016/j.enconman.2019.06.085.
“Siirt | All about Turkey.” https://www.allaboutturkey.com/siirt.html.
Belda, M., E. Holtanová, T. Halenka and J. Kalvová. “Climate classification revisited: from Köppen to Trewartha.” Climate Research, vol. 59, no. 1, Feb. 2014, pp. 1–13. https://doi.org/10.3354/cr01204.
Beck, H.E. et al. “Present and future Köppen-Geiger climate classification maps at 1-km resolution.” Scientific Data, vol. 5, no. 1, Oct. 2018, p. 180214. https://doi.org/10.1038/sdata.2018.214.
“Siirt (province, Turkey) - population statistics, charts, map and location.” https://www.citypopulation.de/en/turkey/admin/TRC34__siirt/.
Homer, H. et al. “12265039_03.” 2016.
Homer Energy. “Homer Pro.” Manual Homer Energy, 2019, pp. 1–241. https://www.homerenergy.com/pdf/HOMER2_2.8_HelpManual.pdf.
“HOMER Pro user manual.” https://www.homerenergy.com/products/pro/docs/index.html.
Das, H.S. et al. “Proposition of a PV/tidal powered micro-hydro and diesel hybrid system: a southern Bangladesh focus.” Renewable and Sustainable Energy Reviews, vol. 53, 2016, pp. 1137–1148. https://doi.org/10.1016/j.rser.2015.09.038.
Bhakta, S. et al. “Techno-economic analysis of standalone photovoltaic/wind hybrid system for application in isolated hamlets of North-East India.” Journal of Renewable and Sustainable Energy, vol. 7, no. 2, 2015. https://doi.org/10.1063/1.4918792.
Hiendro, A. et al. “Techno-economic analysis of photovoltaic/wind hybrid system for onshore/remote area in Indonesia.” Energy, vol. 59, 2013, pp. 652–657. https://doi.org/10.1016/j.energy.2013.06.005
