
+91 6002993949
submission@iarconsortium.org
Open Access
ISSN (Print) : 2708-5155
ISSN (Online) : 2708-5163
About 7% of greenhouse gas emissions globally are attributable to the cement sector into the environment. Alternative binders must be developed to address the costs associated with the building sector and the environmental effects of cement manufacturing, as well as to make the concrete industry sustainable. The partial replacement of cement in concrete with paper ash was investigated as a solution to these research gaps. Sixty concrete cubes with a standard size of 100 mm were also cast and they were immersed in water for 7, 14, 21 and 28 days to cure. The results show that the specific gravity and sand's moisture content and paper ash used were 1.34 and 1.66 and 4.23 and 3.04, respectively. For every replacement pattern, the compressive strength findings showed that strength increased with increasing curing time. 11.61 and 15.02 N/mm2 were the compressive strengths after 7 and 28 days for 0%, whereas 6.32 and 8.10 N/mm2 were obtained for 20%. Strength development for the control concrete was faster a little more than 76% of its 28-day strength was attained in 7 days compared to 62% for 20% replacement level. Though a downward trend in strength development was noticed as the percentage of Paper ash increases, there is the prospect of Paper ash concrete to equal and exceeds control strength as depicted by their convergence towards the control line. In conclusion, paper ash can be utilized to partially substitute cement in concrete due to its pozzolanic qualities. Considering the outcomes, 5% replacement level is recommended.
The ingredients used in making concrete are divided into two groups: the active group, which consists of cement and water and the inert group, which consists of aggregates. Although cement makes up approximately 20% of the concrete mix's volume, the most used cement as a binding material for construction work is Portland cement [7]. In general, three cement grades exist: 33, 43 and 53 grade which are also called 32.5 MPa, 42.5 MPa and 52.5 MPa cement strength grades. For quality assurance, any cement that satisfies the strength criterion of cement grade 32.5 is deemed to have a compressive force of 32.5 MPa. For this reason, if a cement manufacturer's goal is to produce grade 42.5 cement, they can simply downgrade their product to grade 32.5 cement if the cement's compressive strength is below 42.5 MPa. Considering this, cement grade 33, or cement having a strength class of 32.5 MPa, is the least strong cement when compared to grades 43 and 53. Workability is increased by 43 and 53 grade cement's higher fineness because it reduces aggregate friction. Siddiqui (2004) [17] highlighted that cement demand is closely linked to economic growth, as many developing nations pursue rapid infrastructure development. The cement industry contributes significantly to employment and economic expansion. However, it faces sustainability challenges due to its environmental impact. Ordinary Portland Cement (OPC) production is highly energy-intensive, requiring about 4.2 GJ per ton and emitting 0.8–1 ton of CO₂ [8]. Cement manufacturing contributes 8%–10% of global anthropogenic CO₂ emissions. In Nigeria, wastepaper generation is estimated at 0.43 kg per person daily, with 60%–80% being organic [15, 20]. Safiuddin et al. (2010) [15] noted that cement production is a major contributor to greenhouse gas emissions, alongside fossil fuel combustion and deforestation. The industry is a significant consumer of natural resources and a key source of air pollution, releasing nitrogen oxides (NOx), sulfur dioxide (SO₂) andgrey dust. Cement plants, particularly in urban areas, worsen air quality. Due to high CO₂ emissions, the Portland cement sector has been widely studied for energy use and environmental impact [8].
Major pollution sources include kiln emissions, conveyor beltsand crushing mills, making the industry responsible for about 7% of global greenhouse gas emissions.
To enhance sustainability, alternative binders are needed to reduce cement’s environmental impact and natural resource consumption. Key sustainability challenges include reducing CO₂ emissions and integrating waste recycling into construction. Population growth has increased construction demand, leading to material shortages. Engineers are exploring waste conversion into building materials, with pozzolanic materials emerging as viable substitutes for Ordinary Portland Cement (OPC). Paper sludge ash has been identified as a potential pozzolan. The study aims to assess concrete strength using paper ash as a partial cement replacement. It examines the chemical and physical properties of paper ash, the effect of curing age on compressive strength and the impact of different replacement levels (5%, 10%, 15% and 20%). Compressive strength was tested at 7, 14, 21 and 28 days using a 1:2:4 concrete mix, with control specimens made of regular Portland cement.
Impact of Concrete on the environment
Safiuddin et al. (2010) [15] described concrete as a synthetic building material composed of Portland cement, water, fine and coarse aggregates and a small amount of air. The inert materials include fine aggregates like sand and coarse aggregates such as gravel, crushed stone, or slag, all derived from natural resources. However, the depletion of these resources has raised environmental concerns. Gartner (2004) [8] estimate that cement production contributes 5–10% of global CO₂ emissions, releasing 0.7–1.1 tons of CO₂ per ton of cement. To mitigate this impact, reducing cement content in concrete by incorporating supplementary cementitious materials, such as fly ash, blast-furnace slag, silica fume, metakaolin, natural pozzolans and biomass ash, is a viable solution [16].
Pozzolanas in Concrete
Rukzon and Chindaprasirt (2009) [14] explained that pozzolanas are materials containing reactive silica in an amorphous form, which have little to no cementitious properties on their own. However, in the presence of lime and water, they react to form cementing compounds. Portland cement production is highly energy-intensive and emits significant greenhouse gases. While pozzolanas do not possess inherent cementing properties, their silica and alumina react with calcium oxide (CaO) or calcium hydroxide (Ca (OH)₂) to create cementitious materials. Paper ash, a widely available industrial byproduct, is a promising pozzolan due to its high silicon dioxide content. Its use as a partial cement replacement offers both financial and engineering benefits in concrete production.
Characteristics of Concrete Containing Pozzolans
Characteristics of Paper Sludge Ash
Physical properties: Paper mill sludge is composed of water, organic materials, inorganic salts, microscopic cellulose fibers and Mochizuki et al. (2003) [11] found that paper sludge ash, produced by burning wastepaper sludge, has a particle density between 2.2 and 2.9 g/cm³ and a water absorption capacity of about 25%. Monosi reported its bulk density as 1200 kg/m³, making it lighter than sand (2500–2600 kg/m³) and common binders (2100–3100 kg/m³). Tay (1995) [19] determined its specific gravity as 2.81, while Ahmad found it to be 2.6. Khanbilvardi described it as inorganic with a water content of 28% and a bulk specific gravity of 1.83. Ishimoto et al. (2000) [9] noted that paper sludge consists of 60% water and 40% solids, with 30% ash content. Liaw recorded an average moisture content of 75.40% and an ignition loss of 70.11%, which drops to 19.63% after co-generation.
Chemical properties: Wastepaper sludge ash (WPSA) primarily consists of silica (SiO₂) and lime (CaO), with magnesium oxide (MgO) present at about 4%, while other major elements, including potassium oxide (K₂O), ferric trioxide (Fe₂O₃), sulfate (SO₃) and aluminum trioxide (Al₂O₃), are found in minimal amounts (less than 2%).
Bai et al. (2003) [3] noted that the presence of CaO in WPSA has both advantages and drawbacks as a hydraulic binder. The main concern is expansion due to CaO hydration to Ca (OH)₂, which, if occurring after setting, can cause unsoundness. Mozaffari et al. (2009) [12] examined how lime content could be beneficial for WPSA’s activation as a hydraulic binder. Pozzolanic materials like ground granulated blast furnace slag (GGBFS) could be activated by the high alkalinity resulting from the rapid hydration of lime. According to Editing, paper sludge containstrace amounts of minerals such as kaolinite and calcium carbonate, which are used as coating agents to create a smooth paper surface. The amount of these agents varies depending on the type of paper but generally ranges from 5 to 20 grams per square meter.
Portland cement
This study utilized Ordinary Portland Cement (OPC), a type of hydraulic cement that undergoes a chemical reaction (hydration) in the presence of water to form water-insoluble hydrates.
Fine aggregates
According to Microsoft Encarta, sand is a loose, finely granular mass of mineral materials, primarily composed of quartz (silica) with small amounts of mica, feldspar, magnetite and other resistant minerals.
Table 1: Total number of concrete cubes required
PAPER ASH CONTENT (%) | 7 DAYS | 14 DAYS | 21 DAYS | 28 DAYS | TOTAL |
0 | 3 | 3 | 3 | 3 | 12 |
5 | 3 | 3 | 3 | 3 | 12 |
10 | 3 | 3 | 3 | 3 | 12 |
15 | 3 | 3 | 3 | 3 | 12 |
20 | 3 | 3 | 3 | 3 | 12 |
Total number of cubes | 15 | 15 | 15 | 15 | 60 |
Table 2: Weight of materials for each replacement order
Replacement | Paper ash (kg) | Cement (kg) | Sand (kg) | Granite (kg) |
0% | -- | 3.729 | 7.457 | 14.914 |
5% | 0.186 | 3.543 | 7.457 | 14.914 |
10% | 0.373 | 3.356 | 7.457 | 14.914 |
15% | 0.559 | 3.170 | 7.457 | 14.914 |
20% | 0.746 | 2.983 | 7.457 | 14.914 |
TOTAL (Kg) | 1.864 | 16.781 | 37.285 | 74.570 |
Fine aggregate produced by crushing hard stone is known as crushed stone sand, while that obtained from natural gravels is called crushed gravel sand.
Coarse aggregates
According to Microsoft Encarta, aggregates, which are mostly retained on a 4.75mm IS sieve, contain a limited amount of finer material. They are formed either by the natural disintegration of rocks or by artificial crushing, with their properties derived from the parent rocks. Aggregates mainly consist of quartz and feldspar (potash feldspar and oligoclase), with trace amounts of mica (biotite or muscovite) and minor accessory minerals such as zircon, apatite, magnetite, ilmenite and sphene.
Water
The liquid state of the hydrogen-oxygen molecule H2O is referred to as water. Pure water is tasteless and odorless.
Paper ash
Paper ash is produced by burning used paper, with the furnace located at the Department of Building, Federal University of Technology Akure. In this study, 60 concrete cube specimens (100 mm x 100 mm x 100 mm) were cast and tested for workability (consistency) and compressive strength at 7, 14, 21 and 28 days of curing.
0% paper ash with 100% OPC Concrete
5% paper ash with 95% OPC Concrete
10% paper ash with 90% OPC Concrete
15% paper ash with 85% OPC Concrete
20% paper ash with 80% OPC Concrete
The average compressive strength is determined and obtained.
Concrete Casting Process
Batching/Weighing
According to Mehta and Monteiro (2001) [10], thickening of damp sand results in measurement errors. Selecting and adjusting the ingredients to provide the necessary strength, workability and durability is the process of designing a concrete mix.
For this research study, the batching was done on the basis of weight and for the 3 cubes and 10 slump cones, the quantities of materials used were based on the following calculation.
Volume of 60 cubes of
100mm × 100mm ×100mm = 0.060 m3
Using 1450 kg/m3 as the density of concrete
Total mass of concrete required = 0.060 × 1450 = 87kg
Table 3: Moisture content for sand
| Sample | S 1 (g) | S 2 (g) | S 3 (g) |
| Weight of can (W1) | 32.4 | 47.2 | 46.6 |
| Weight of can + wet sample (W2) | 112.9 | 132.7 | 114.0 |
| Weight of can + oven dry sample (W3) | 109.6 | 129.2 | 113.3 |
| Moisture content (%) = (W2-W3)/(W3-W1) x 100 | 4.27 | 4.27 | 4.17 |
| Average moisture content (%) 4.23 | |||
Waste and Shrinkage factor = 1.5
1.5 × 87 =130.5kg
Therefore, the weight of concrete corresponding to each placement level 0, 5, 10, 15 and 20% = 130.5/5=26.1 kg
Using mix ratio 1:2:4, the mass of cement.
Mixing
Mehta and Monteiro (2001) [10] suggest that inadequate mixing is often blamed for the irregular handling and growth properties of freshly mixed concrete. To prevent stiffening, ready-mixed concrete should be transported to the site promptly, ensuring proper finishing and consolidation after placement. Additionally, concrete should be positioned as close as possible to its final location to minimize segregation during the placement process.
Compaction
The procedure involves removing trapped air pockets by molding concrete inside the forms and around embedded components. Compaction was done using a tamping rod (16mm diameter, 600mm length), with 25 blows uniformly distributed over each deposited layer's surface, ensuring no segregation.
Curing
is the process of cement hydration and setting, during which heat is released. The main goals are to prevent moisture loss and control the temperature to ensure the concrete reaches the desired strength. Without curing, concrete gains only 50% of the strength compared to continuously cured concrete.
Tests on Concrete
Concrete Slump Test
Workability of concrete, as defined in ASTM C125-03 [2], refers to the effort needed to manipulate freshly mixed concrete while maintaining minimal loss of homogeneity.
Water was added to the mixing pan and the slump cone was filled in layers, tamped 25 times with a hemispherical steel rod and rodded into the previous layer. After filling the cone, excess concrete was removed and the cone was lifted carefully. The slump height was measured by inverting the cone and determining the separation between the original and slumped concrete positions. This process was repeated for each replacement pattern in the study to record the slump values.
Concrete Cube Test
The compressive strength of concrete is the most important factor. The characteristic strength, which defines the concrete grade, is determined by the 28-day
Table 4: Moisture content for paper ash cube strength. To measure this strength, standard cubes of 100 mm were crushed, using aggregates no larger than 25 mm.
Sample | S 1 (g) | S 2 (g) | S 3 (g) |
Weight of can (W1) | 5.80 | 5.90 | 6.00 |
Weight of can + wet sample (W2) | 13.30 | 13.40 | 13.60 |
Weight of can + oven dry sample (W3) | 13.20 | 13.30 | 13.50 |
Moisture content (%) = (W2-W3)/(W3- W1) x 100 | 1.35 | 1.35 | 1.33 |
Average moisture content (%) 1.34 | |||
Compressive strength
As defined in BS EN 12390-3:2002 [5], it is the maximum uniaxial compressive stress a material can withstand before failure. It is influenced by the water-cement ratio and indicates the concrete's resistance to crushing forces.
The aim of the test is to determine the concrete's compressive strength at various curing stages. Cube moulds were cleaned, oiled and filled with 50 mm layers of pre-mixed concrete, following BS EN 12390-2:2000 [4] guidelines. Each layer was tamped 25 times with a steel-tamping rod. After filling, the surface was leveled and troweled and the cubes were marked for identification. After 15 minutes, the moulds were struck off and the cubes were placed in a curing tank for 16 to 72 hours. At 7, 14, 21 and 28 days, the cubes were removed, weighed and tested for compressive strength.
Laboratory tests to be carried out on the samples
Moisture content test
The test was conducted on paper ash and paper ash-soil samples to determine their natural moisture content, which refers to the weight ratio of water to solids in a given quantity of soil.
Specific Gravity Test:
Specific gravity of paper ash was conducted in the laboratory of the Department of Civil Engineering at the Federal University of Technology Akure.
Sieve Analysis
Sieve analysis, or gradation test, was also determined to assess the particle size distribution of granular materials. A material's size distribution often significantly impacts its behavior during use.
Experimental Design
The data collected was Compaction strength of blended cement concrete with paper ash cubes of size 100mm. The independent variables are
Specimen size, at one level that is 100mm3
Mix proportions at one level, 1:2:4
Percentage replacement of OPC with Paper ash at five levels, that is 0%, 5%, 10%, 15% and 20% by weight
The ideal ratio of cement to water, namely 0.5
Curing age at four levels that is 7, 14, 21 and 28 days.
Table 5: Specific gravity for Paper ash
Description | Sample 1 (g) | Sample 2 (g) | Sample 3 (g) |
Weight of bottle and stopper (W1) | 303.1 | 311.7 | 311.2 |
Weight of bottle, stopper and sample (W2) | 353.1 | 360.1 | 362.0 |
Weight of bottle and water filled to the neck (W3) | 610.3 | 587.6 | 595.5 |
Weight of bottle, sample, stopper and water filled to the neck (W4) | 623.1 | 614.1 | 612.1 |
SG= (W2-W1)/[(W3-W1) -(W4-W2)] | 1.34 | 2.77 | 1.48 |
Mean SG 1.66 | |||
Table 6: Specific gravity for sand
Description | Sample 1 (g) | Sample 2 (g) | Sample 3 (g) |
Weight of bottle and stopper (W1) | 303.1 | 311.7 | 311.2 |
Weight of bottle, stopper and sample (W2) | 353.1 | 363.7 | 361.2 |
Weight of bottle and water filled to the neck (W3) | 610.3 | 587.6 | 595.5 |
Weight of bottle, sample, stopper and water filled to the neck (W4) | 639.6 | 628.2 | 621.9 |
SG= (W2-W1)/[(W3-W1) -(W4-W2)] | 2.45 | 4.56 | 2.11 |
| Mean SG 3.04 | |||

Figure 1: Grading curve for fine aggregates
The results of the experiment and findings from the various laboratory tests conducted are presented and discussed in the following subsections.
Moisture content
Relative to the sample's initial (wet) weight, the moisture content represents the proportion of moisture in the sample.
Table 4 gives the average moisture content values of sand and paper ash to be 1.34.
Specific Gravity shows the results of the procedures used to measure the specific gravity of the sand and ash used for this project work.
The average specific gravity values for sand and paper ash are 3.04 and 1.66 respectively as shown in tables 5 and 6. While ASTM C618-03 [1], which governs pozzolan classification, does not set a specific requirement for pozzolan's specific gravity, the value for paper ash indicates that it is not a high-density
Table 7: Sieve analysis for sand
Sieve Size (Mm) | Weight Of Sieve (g) | Weight Of Sieve & Mass Retained (g) | Mass Retained (g) | Retained % | Cum Retained % | Passed % |
4.75 | 618.5 | 619.6 | 1.1 | 0.22 | 0.22 | 99.78 |
2.36 | 479.4 | 487.2 | 7.8 | 1.56 | 1.78 | 98.22 |
1.7 | 351.1 | 355.2 | 4.1 | 0.82 | 2.6 | 97.4 |
0.6 | 346.5 | 459.2 | 113 | 22.6 | 26.2 | 74.8 |
0.5 | 360.2 | 419.8 | 59.6 | 11.92 | 37.12 | 62.88 |
0.425 | 350.3 | 388.6 | 38.3 | 7.66 | 44.78 | 55.22 |
0.212 | 357.3 | 572.6 | 215.3 | 43.06 | 87.84 | 12.16 |
0.15 | 346.3 | 379.2 | 32.7 | 6.54 | 94.38 | 5.62 |
0.075 | 321.4 | 346.5 | 25.1 | 5.02 | 99.4 | 0.6 |
Pan | 173.8 | 176.8 | 3 | 0.6 | 100 | 0 |
Table 8: Sieve analysis for paper ash
Sieve Size (Mm) | Weight Of Sieve (g) | Weight Of Sieve & Mass Retained (g) | Mass Retained (g) | Retained % | Cum Retained % | Passed % |
4.75 | 618.5 | 618.5 | 0 | 0 | 0 | 100 |
2.36 | 479.4 | 487.2 | 7.8 | 5.23 | 5.23 | 94.77 |
1.7 | 351.1 | 356.6 | 5.5 | 3.69 | 8.92 | 91.08 |
0.6 | 346.5 | 379.6 | 33.1 | 22.12 | 31.04 | 68.96 |
0.5 | 360.2 | 383.3 | 23.1 | 15.42 | 46.46 | 53.54 |
0.425 | 350.3 | 367.8 | 17.5 | 11.73 | 58.19 | 41.81 |
0.212 | 357.3 | 416.8 | 59.5 | 39.88 | 98.07 | 1.93 |
0.15 | 346.3 | 347.9 | 1.6 | 0.94 | 99.01 | 0.99 |
0.075 | 321.4 | 322.8 | 1.4 | 0.74 | 99.75 | 0.25 |
Pan | 173.8 | 174.3 | 0.5 | 0.21 | 99.96 | 0.04 |
Table 9: Slump values for paper ash blended cement concrete
Replacement Pattern | Concrete height (mm) | Slump Value (mm) |
0% paper ash and 100% Cement | 260 | 40 |
5% Paper ash and 95% Cement | 263 | 37 |
10% Paper ash and 90% Cement | 265 | 35 |
15% Paper ash and 85% Cement | 268 | 32 |
20% Paper ash and 80% Cement | 270 | 30 |
Table 10: Compressive strength of concrete
Curing age (days) | Replacement % | Weight (kg) | Applied load (N) | Compressive strength (N/mm) |
7 | 0 | 2.60 | 116.10 | 11.61 |
14 | 0 | 2.52 | 131.70 | 13.17 |
21 | 0 | 2.53 | 141.73 | 14.17 |
28 | 0 | 2.50 | 152.67 | 15.27 |
7 | 5 | 2.63 | 88.47 | 8.85 |
14 | 5 | 2.55 | 95.70 | 9.57 |
21 | 5 | 2.63 | 102.07 | 10.21 |
28 | 5 | 2,63 | 110.28 | 11.03 |
7 | 10 | 2.47 | 63.17 | 6.32 |
14 | 10 | 2.43 | 80.97 | 8.10 |
21 | 10 | 2.45 | 85.10 | 8.51 |
28 | 10 | 2.48 | 92.60 | 9.26 |
7 | 15 | 2.50 | 55.97 | 5.60 |
14 | 15 | 2.37 | 72.07 | 72.10 |
21 | 15 | 2.43 | 78.33 | 7.83 |
28 | 15 | 2.42 | 88.53 | 8.85 |
7 | 20 | 2.43 | 50.93 | 5.09 |
14 | 20 | 2.47 | 68.20 | 6.82 |
21 | 20 | 2.47 | 70.57 | 7.06 |
28 | 20 | 2.48 | 81.03 | 8.10 |
Figure 2: Particle size distribution curve for paper ash
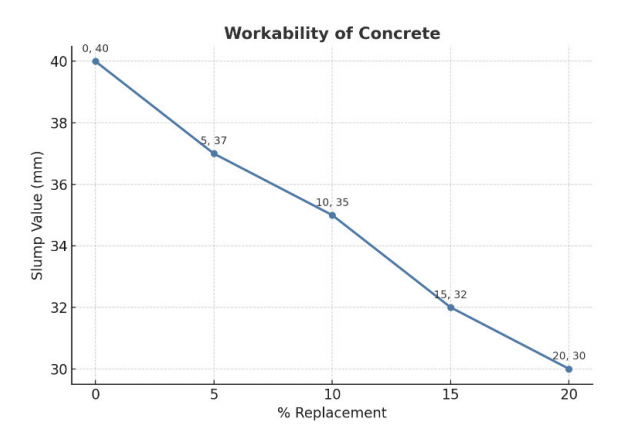
Figure 3: Workability of fresh concrete
material. According to ASTM C125-03 [2], a heavyweight aggregate requires a specific gravity greater than 3.30.
Sieve Analysis
The grading of each soil sample is determined through sieve analysis to assess whether the sample is suitable for its intended purpose.
Weight of sample (sand) = 500g
Figure 1 shows that the sand used has particles smaller than 4.75mm, as 0% was retained on the 4.75mm sieve. According to ASTM C125-03 [2], this qualifies the sand as a fine aggregate, suitable for concrete production due to its small grain size.
Workability
The slump values for the concrete with various waste paper ash replacement patterns varied, but all showed a true slump with a water-to-cement ratio of 0.5. Concrete with 0% and 5% ash had slump values of 40mm and 37mm, respectively, indicating low workability according to BS EN 206-1:2000 [6]. As the amount of waste paper ash increased, the slump decreased due to the ash particles absorbing more water than cement, reducing workability. The mix with 5% waste paper ash had the highest slump, likely due to the increased volume of the mixture, as ash occupies more volume than cement.
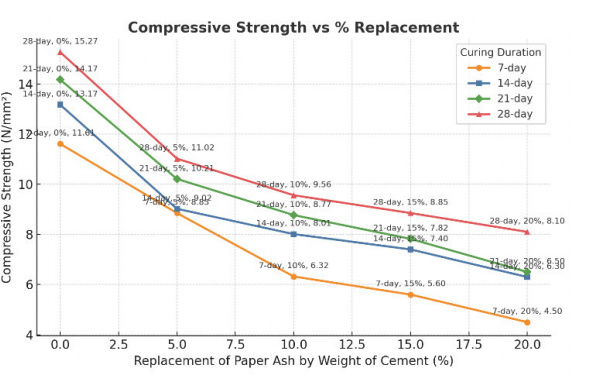
Figure 4: Effect of paper ash on concrete strength
Compressive strength test
The compression test is a key method for assessing the hardened strength of concrete. After curing, the specimen is removed from the curing tank and cleaned of excess water. A compression test is performed on 100mm cubes using ELE 20000 KN digital testing equipment. The compressive strength results for the cubes at 7, 14, 21 and 28 days for various replacement patterns are presented in Table 10. All 60 cubes were placed in the curing medium, with each cube having an area of 10000 mm², which was used to calculate the compressive strength.
The average compressive strengths of the control cubes (0% ash) at 7, 14, 21 and 28 days were 11.61, 13.17, 14.17 and 15.17 N/mm², respectively. As the paper ash content increased, there was a corresponding reduction in strength. The compressive strengths for 5% ash replacement were 8.85, 9.57, 10.21 and 11.2 N/mm² and for 20% ash replacement, they were 5.09, 6.82, 7.06 and 8.1 N/mm². The strength of paper ash concrete is influenced by factors such as the reactivity of the paper ash, which depends on the fineness of its particles. The paper ash used in this study was sieved through a 425 μm sieve.
According to ASTM C618-03 [1], the strength activity index requires that pozzolan-containing concrete should have a minimum of 75% strength compared to the control at either 7 or 28 days. Since concrete with pozzolan develops strength more slowly, the 28-day strength was used for comparison. All replacement levels met this requirement, with the lowest 28-day strength being 8.1 N/mm² (for 20% and 75% of the control strength (15.27 N/mm²) was 11.30 N/mm².
Figure 5 shows that the strength of concrete increases as the curing period progresses. The graph illustrates that all concrete samples gain strength over time with extended curing.
The control concrete achieved over 76.23% of its 28-day strength at 7 days, showing faster strength development. The 5% Paper ash concrete reached 80.3%, while the 10%, 15% and 20% replacement levels attained 66.39%, 63.28% and 62.83% respectively. This indicates that, except for the 5% replacement, all other mixes exhibited slower strength development, with a decrease in early-age strength as the Paper ash content increased, which is consistent with the 14, 21 and 28-day strength results.
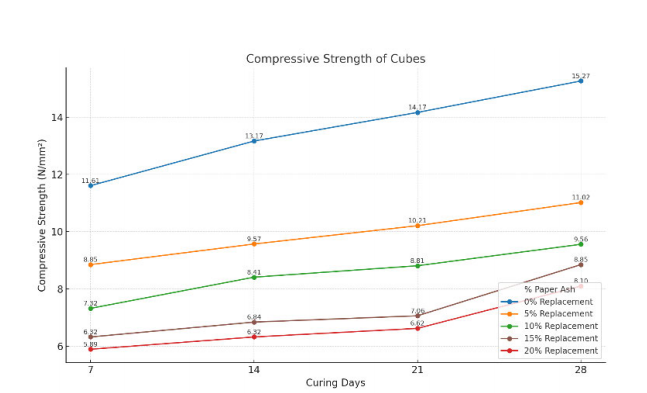
Fig 5: Relationship between curing and compressive
The average compressive strength values in tables 11 and 12 show that at 14 days, the strength for 10%, 15% and 20% Paper ash are 88.6%, 77.8% and 67.7% respectively, compared to 63.38% and 62.83% for 15% and 20% Paper ash at earlier stages. The 10% Paper ash mix has a slower strength development at 14 days. As the Paper ash content increases, the concrete's hardening rate also increases up to the 20% replacement level. This is because more Paper particles react with calcium hydroxide from cement hydration. The strength development curves for the Paper ash mixes approach that of the control mix, with the potential to eventually exceed it. At 21 days, the 15% and 20% replacements reached 88.1% and 87.2% of their 28-day strength, respectively, compared to 77.8% and 67.7% at 14 days.
This study investigated the use of paper ash as a partial replacement for cement in concrete, evaluating its suitability and strength. The paper ash had a moisture content of 1.34% and a specific gravity of 1.66. Concrete with paper ash showed a true slump at a 0.5 water-to-cement ratio, though it was less workable than the control mix. The strength development of paper ash concrete was slower at early ages but improved over time as the ash content increased. Compressive strength generally increased with curing time but decreased with higher paper ash content. The highest strength was achieved with a 5% paper ash replacement, with 28-day strengths of 11.02, 9.56, 8.86 and 8.1 N/mm² for 5%, 10%, 15% and 20% replacements, respectively. Depending on the structure's requirements, paper ash can be effectively incorporated into concrete for both structural and non-structural applications, offering potential cost savings in construction.
ASTM International. “ASTM C618-00: Standard Specification for Coal Fly Ash and Raw or Calcined Natural Pozzolan for Use as a Mineral Admixture in Concrete.” ASTM International, 2000, West Conshohocken. http://dx.doi.org/10.1520/C0618-00.
ASTM International. “ASTM C125-03: Standard Terminology Relating to Concrete and Concrete Aggregates.” ASTM International, 2003, West Conshohocken. http://dx.doi.org/10.1520/C0125-03.
Bai, Jianjun et al. "Compressive Strength and Hydration of Wastepaper Sludge Ash–Ground Granulated Blastfurnace Slag Blended Pastes." Cement and Concrete Research, vol. 33, no. 8, 2003, pp. 1189–1202. https://doi.org/10.1016/S0008-8846(03)00038-0.
British Standards Institution. Testing Hardened Concrete – Part 2: Making and Curing Specimens for Strength Tests. BS EN 12390-2:2000, BSI, London, 2000. https://doi.org/10.3403/30360082U.
British Standards Institution. Testing Hardened Concrete – Part 3: Compressive Strength of Test Specimens. BS EN 12390-3:2002, BSI, London, 2002. https://doi.org/10.3403/03015544.
British Standards Institution. Concrete – Part 1: Specification, Performance, Production and Conformity. BS EN 206-1:2000, BSI, London, 2000. https://doi.org/10.3403/02248618.
Gambhir, Mohan Lal. "Building and Construction Materials: Testing and Quality Control." McGraw-Hill Education India, 2014. https://books.google.com/books/about/Building_and_Construction_Materials.html?id=43zvAwAAQBAJ.
Gartner, Ellis. "Industrially Interesting Approaches to Low CO₂ Cements." Cement and Concrete Research, vol. 34, no. 9, 2004, pp. 1489–1498. https://doi.org/10.1016/j.cemconres.2004.01.021.
Ishimoto, Hiroji, et al. "Use of Papermaking Sludge as New Material." Journal of Materials in Civil Engineering, vol. 12, no. 4, 2000, pp. 310–313. https://doi.org/10.1061/(ASCE)0899-1561(2000)12:4(310).
Mehta, Paulo Kumar and Paulo J. M. Monteiro. "Concrete: Microstructure, Properties and Materials." 2nd ed., McGraw-Hill Professional, 2001. https://books.google.com/books/about/Concrete_Microstructure_Properties_and_M.html?id=GA5ZnxoRNiYC.
Mochizuki, Yoshihito, et al. "Effects of Soil Improvement Due to Mixing with Paper Sludge Ash." Fujita Technical Research Report, no. 39, 2003, pp. 99–109. https://www.fujita.co.jp/tech_center/img/up/2003/2003-17.pdf.
Mozaffari, Ehsan, et al. "An Investigation into the Strength Development of Wastepaper Sludge Ash Blended with Ground Granulated Blastfurnace Slag." Cement and Concrete Research, vol. 39, no. 10, 2009, pp. 942–949. https://doi.org/10.1016/ j.cemconres. 2009.06.003.
Ogwueleka, Tochukwu C. "Municipal Solid Waste Characteristics and Management in Nigeria." Iranian Journal of Environmental Health Science & Engineering, vol. 6, no. 3, 2009, pp. 173–180.
Rukzon, Sumrerng and Prinya Chindaprasirt. "Strength and Chloride Resistance of Blended Portland Cement Mortar Containing Palm Oil Fuel Ash and Fly Ash." International Journal of Minerals, Metallurgy and Materials, vol. 16, no. 4, 2009, pp. 475–481. https://doi.org/10.1016/S1674-4799(09)60083-2.
Safiuddin, Muhammad, et al. "Utilization of Solid Wastes in Construction Materials." International Journal of the Physical Sciences, vol. 5, no. 13, 2010, pp. 1952–1963. https://eprints.um.edu.my/5990/.
Sata, Vanchai, et al. "Compressive Strength and Heat Evolution of Concretes Containing Palm Oil Fuel Ash." Journal of Materials in Civil Engineering, vol. 22, no. 10, 2010, pp. 1033–1038. https://doi.org/10.1061/(ASCE)MT.1943-5533.0000108.
Siddique, Rafat. "Performance Characteristics of High-Volume Fly Ash Concrete." Cement and Concrete Research, vol. 34, no. 3, 2004, pp. 487–493. https://doi.org/10.1016/j.cemconres.2003.09.002.
Sridhar, Mynepalli K. C. "From Urban Wastes to Sustainable Waste Management in Nigeria: A Case Study." Sustainable Environmental Management in Nigeria, edited by Matt F. A. Ivbijaro, Festus Akintola and Raphael U. Okechukwu, Mattivi Productions, 2006, pp. 337–353. https://www.academia.edu/110886.
