+91 6002993949
submission@iarconsortium.org
Open Access
ISSN (Print) : 2708-5090
ISSN (Online) : 2708-5104
Safflower (Carthamus tinctorius L.) is an oilseed crop having high potential for oil and protein cake but still need more exploitation. The experiments were carried out for two winter seasons (2007/08) and (2008/09) at the University of Gezira, Wad Medani, Sudan, under irrigation. Ten safflower genotypes were used and fixed three spacings between plants along the ridge (30, 40 and 50 cm). The treatments were arranged in a split plot design with spacing as the main plots and safflower genotypes as the subplots with four replications. oil analysis was done in Egypt at the Agricultural Research Center “Food Technology Research Institute''. MSTATC package was used for the statistical analysis. The oil content was significantly affected by genotype with an average of 27.68% and a range of 20.03–35.58%. Genotypes 1, 5, 8 and 10 produced oil content percentages over 30%. Genotypes 1 and 5 are spiny, Sudanese collections. Most of the genotypes were of the high linoleic type (67.78–78.02 % of total fatty acids). The observed stearic acid range was (2.1-3.1 %). Oleic acid contents ranged from 11.7 % to 15.97 %. The genotypes 1, 5, 8 and 10 were recommended for further improvement and testing under Sudan conditions.
Safflower (Carthamus tinctorius L.) is an oilseed crop having high potential for oil and protein cake but still need more exploitation It can be grown in diversified environments due its capability of resisting drought and salt [1]. India, Kazakhstan, Mexico, USA and Argentina are the leading countries for its production and there is a great potential to grow this crop in Africa [2]. The safflower seeds constitute about 38–48% oil, 15–22% protein, 11–22% fiber and 18–59% hull [3]. safflower is grown for its edible oil used for food cooking, salad oil,for frying and in the industry of frozen food and margarine. In affluent countries, research linking health and diet has increased the demand for the oil which is the richest in polyunsaturated fatty acid (linoleic acid, 77%). The medicinal properties of linoleic acid indicating its usefulness in lowering serum cholesterol levels in humans and reducing the risk of heart attacks. This gave safflower oil recognition as healthy oil [4]. high proportion of polyunsaturated fatty acids such as linoleic acid and tocopherol that are used for medicinal as well as dietetic purposes [5]. Asp et al. [6] reported that an 8 g daily dose of safflower cooking oil, for 16 weeks can improve health measures such as glycemia, inflammation, and blood lipids in obese, postmenopausal women who have Type 2 diabetes. Also, they reported that daily supplementation with safflower oil for 16 weeks reduced abdominal fat and increased muscle tissue and suggested that a daily dose of 1 2/3 teaspoons of safflower oil reduce the risk of heart disease. Significant consideration has been created in the utilization and improvement of safflower seed oil for its super medical advantages as treatment of hyperlipaemia, arteriosclerosis, coronary illness. The safflower oil containing fat-dissolvable vitamins retinol, calciferol, tocopherol and phylloquinone and having essential unsaturated fats as linoleic acid. high oleic safflower oils are stable on heating, making it suitable for frying [5].
The linoleic acid in safflower oil has effectively shown to decrease body weight and adipose tissues as demonstrated in clinical trials [7]. Safflower is lowering cholesterol level in the blood [8] safflower oil is effective in fat-induced insulin resistance [9]. However, Safflower oil contains. unsaturated fatty acids such as linoleic and oleic acid in percentages ranging 77.9-79.5% and 9.5-11.3% of total fatty acids respectively [1]. While, saturated fatty acids are lower 9.7% to 10.8% of total fatty acids. While the saturated fatty acids are palmitic and stearic acids 7.2-8.6% and 2.0-2.4% respectively [10]. Sabzalian et al. [11] analyzed three different species of safflower and reported that oleic, linoleic, stearic and palmitic acids are the major fatty acids constituting 96-99% of the total fatty acids. Ashrafi and Razmjoo [12] reported that the oil contents of safflower cultivars were significantly reduced due to drought stress. In particular, both the stearic and palmitic acid contents were reduced by 57 % on average, whereas the linoleic and oleic acid contents were reduced by only 8 and 14 %, respectively. The results clearly showed that water deficit conditions severely affected saturated compared to unsaturated fatty acid contents. India ranks first in the production of safflower oil along with the other minor oilseeds like sesame. Safflower oil has been characterized in different regions of the world and several experiences have demonstrated a variability of composition functions of varieties, soil and climate conditions. So, the introduction of a new crop to a regional cropping system requires information concerning its performance under local environmental conditions [13]. Around the world, safflower is mainly grown for its edible oil for cooking, salad oil and margarine. In affluent countries, research linking health and diet has increased the demand for the oil, which has the highest polyunsaturated/saturated ratios of any oil available. It is nutritionally similar to olive oil, with high levels of linoleic or oleic acid, but much less costly. Polyunsaturated fats are associated with lowering of blood cholesterol. Also, mono-unsaturates such as oleic safflower oil tends to lower blood levels of LDL (Low-density lipoprotein), one of the five major groups of lipoproteins (‘bad’ cholesterol), without affecting HDL (high-density lipoprotein) (‘good’ cholesterol) [14]. Safflower oil is highly stable, and its consistency remains the same at low temperatures, thereby making it suitable for application in frozen/chilled foods. Also, its oil is better suited to hydrogenation for margarine production than soya or canola oils [15]. Safflower oil is nonallergenic, and therefore suitable in injectable medications [16]. A comparison of the development potential of sunflower and safflower in India is presented by Surinder [17]. The average yield and cost benefit ratio are lower in safflower. Although both oilseed crops show great promise and good economic returns with a minimal irrigation, safflower gives more response and yield and a higher economic result because of its greater tolerance to drought, oil content and composition and other oil characteristics.
The objective of this study is to select safflower genotype producing high level of seed oil rich in linoleic and oleic acid so as to encourage safflower cultivation in the country to contribute in reducing shortfall in oil production.
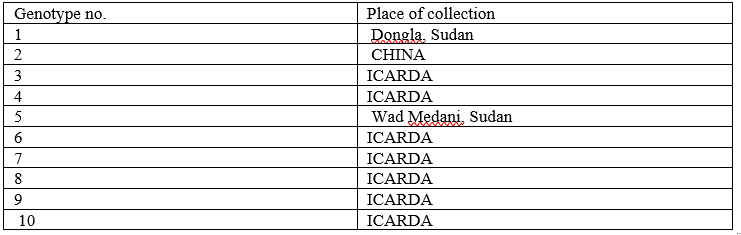
The experiments were carried out for two winter seasons Abu Haraz (2007/08) and Nisheishiba (2008/09) all at the University of Gezira, Wad Medani, Sudan, under irrigation. The two sites (Nisheishiba and Abu Haraz) were very close and opposite to each other but lying on the western and eastern bank of the Blue Nile, respectively. The two sites were within the vicinity of Wad Medani town which lies at latitude 14˚ 24′ N, longitude 33˚ 29′ E and altitude 407m above sea level. The soil of the area was classified as fine montmorillonitic isohyperthermic Entic chromusterts, Suleimi series. It was described as heavy cracking clay with high clay content (40 – 65%), low organic carbon content (0.4%), high cation exchange capacity (CEC), low permeability when wet and with a pH ranging from 7.2 – 9.6. The area is characterized by an arid tropical climate with the lowest temperature in January and the highest in July. The annual average rainfall is about 350mm received mainly between mid-July to mid-October. The winter experiments were sown in mid-November and harvested during the last week of April in each season. Ten safflower genotypes (table 1) were used and fixed three spacings between plants along the ridge (30, 40 and 50 cm). The treatments were arranged in a split plot design with spacing as the main plots and safflower genotypes as the subplots with four replications. The area of the experimental plot was 12m2 (3m x 4m) and consisted of five ridges 0.80m apart. The seeds were sown in hills, (2-3 seeds/hole) and then thinned to one plant per hill after full field emergence (about 21 days from sowing). The land was prepared by discing, leveling and ridging. Then, 43kg N/ha (in form of urea) were broadcasted on the ridges three weeks after sowing. The experiments were irrigated according to crop water requirements. Weeding was done manually. Analysis of variance procedure was performed for each of the characters studied to test significance of mean differences among genotypes. Duncan’s Multiple Range Test was computed to compare and separate average values of genotypes. package was used for the statistical analysis
Table 1. The10 safflower genotypes and their place of collection.
Determination of seed oil content and fatty acid composition
All the work concerning the oil analysis was done in Egypt at the Agricultural Research Center “Food Technology Research.
Oil content
Seeds of each genotype in the two locations of the two seasons were bulked together and seed sample for each genotype was drawn from the bulk.
Oil contents of the various genotypes were determined according to AOCS Official Method Ai 3-75. Four grams of the ground sample were weighed into a filter paper and enclosed in a second filter paper folded in such a way to prevent escape of the meal. The second paper was left open at the top like a thimble. Then a piece of absorbent cotton was placed on the top of the thimble to distribute the solvent as it drops on the sample. then, the wrapped sample was placed in extraction tube and then, 150 ml of n- hexane was poured in the extraction flask before fixing the tubes, after 6 hours of extraction the extraction flask was disconnected. The hexane was recovered by distillation under vacuum. The solvent was evaporated on a water bath. The last traces of hexane were removed by putting the flask in an oven. Then, the flask was cooled in a desiccator at room temperature and weighed. Heating was repeated until constant weight was obtained.
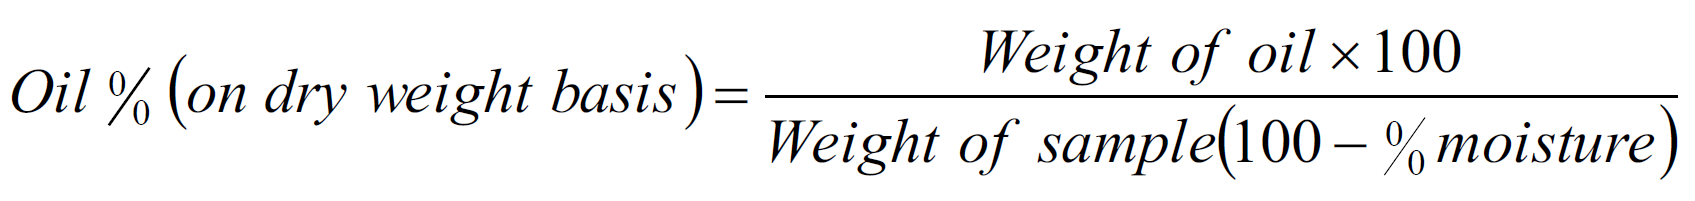
Oil content was calculated as follows:
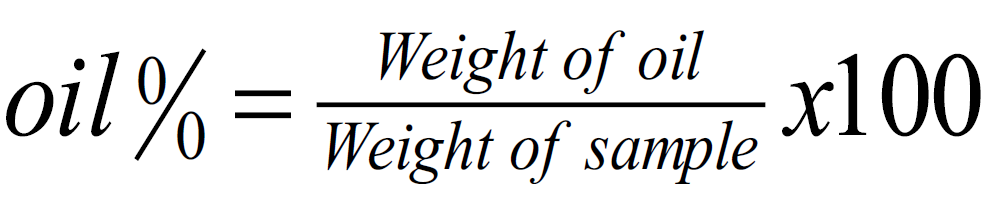
The percent oil is calculated on dry weight-basis with the following formula:
Chemical properties of safflower seed oil
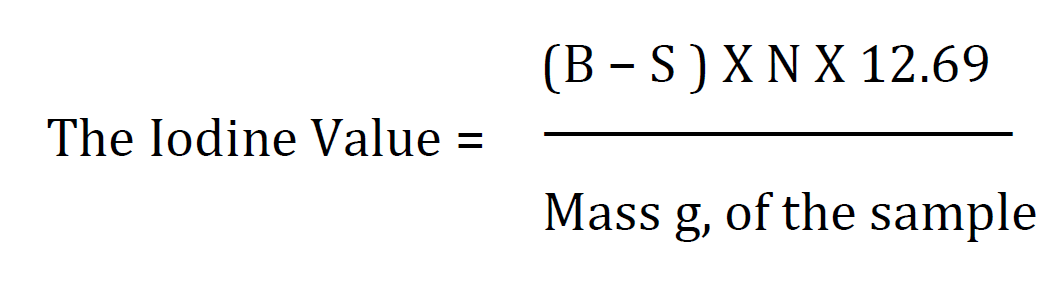
Iodine value
This property is frequently used to measure fat stability. The iodine value estimates the number of double bonds present in the fat or oil. Consequently, it is necessary to previously know the nature of the lipid and the number of double bonds that might be present in the lipid. The higher the stability of the oil, the lower is the iodine value of the sample. This analysis has the same limitations of the method of initial value of peroxides. Moreover, high levels of peroxide might interfere with the procedure.
The iodine value is a measure of the unsaturation of fats and oils and is expressed in terms of the number of centigrams of iodine absorbed per gram of sample (% iodine absorbed). The iodine value for each oil sample was carried out according to AOCS official method Cd 1-25 reapproved.
0.25 g of oil sample were weighed into 500 ml conical flask then 15 of chlorophorm were added to dissolve the sample 25 ml of Hanss solution were added to the mixture. After that, the flask was kept in a dark place for 30 minutes, after half an
hour 10 ml of potassium iodide were added with vigorous shaking of the flask, 100 ml of distilled water were added to wash the walls followed by titration by 0.1 N Sodium Thiosulphate with vigorous and continuous shaking after each drop till a faint yellow colour was disappeared. Then 1ml of starch indicator solution were added to the flask and the titration was continued until the disappearance of the blue colour. The same procedures were similarly conducted for the blank.
The Iodine Value (IV ) was calculated as follows:
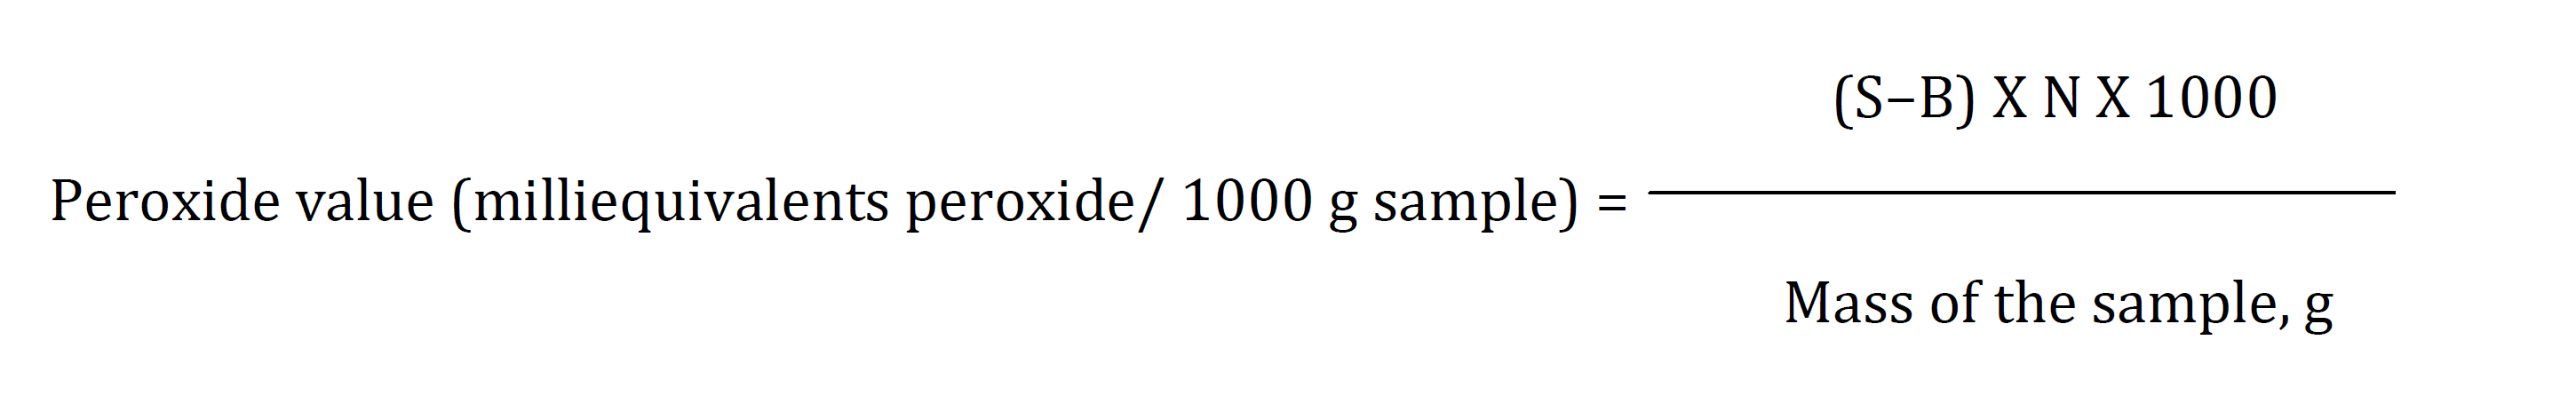
Peroxide value (PV)
This method determines all substances, in terms of milliequivalents of peroxide per 1000 grams of sample, that oxidize potassium iodide under the conditions of the test. The substances are generally assumed to be peroxides or other similar products of fat oxidation.
This test was carried out according to AOCS official method Cd-90 (1973). 1 − 2 gm was weighted in a conical flask (250 ml), then 30 ml of acetic - chloroform solution was added in a ratio of 3:2 with shaking to dissolve the sample 1 ml of saturated potassium iodide solution was added and the flask was vigorously shaked until the solution appeared clear and left in the dark for two minutes. After that, 30 ml of distilled water were added. Titration was carried out against 0.1 N sodium thiosulfate with vigorous agitation until the yellow iodine colour was disappeared. Then 0.5ml of starch indicator were added. With constant agitation especially near the end point, to liberate all of the iodine from the solvent layer, titration was continued. Thiosulfate solution was added drop wise until the blue colour just disappeared.
A blank titration against 0.1 N sodium thiosulfate solution was carried out, the volume of sodium thiosulfate must not exceed 0.1 ml.
Acid value
Acid value determine the free fatty acids existing in the oil sample.
AOCS official method Cd 3a-63 (1973) was used for determining the acid value of our oil samples. According to the expected acid value the test sample weight was determined. 2.0g of the sample was weighed in a dry and clean conical flask 30ml of 95% ethanol were added. The mixture was then heated on a water path until the boiling point with continuous shaking. The phenolphthalein indicator was added and titrated with 0.1N NaOH with vigorous shaking during the titration until the pink colour.
The acid value expressed as mg of KOH per gram of oil and was calculated as follows:
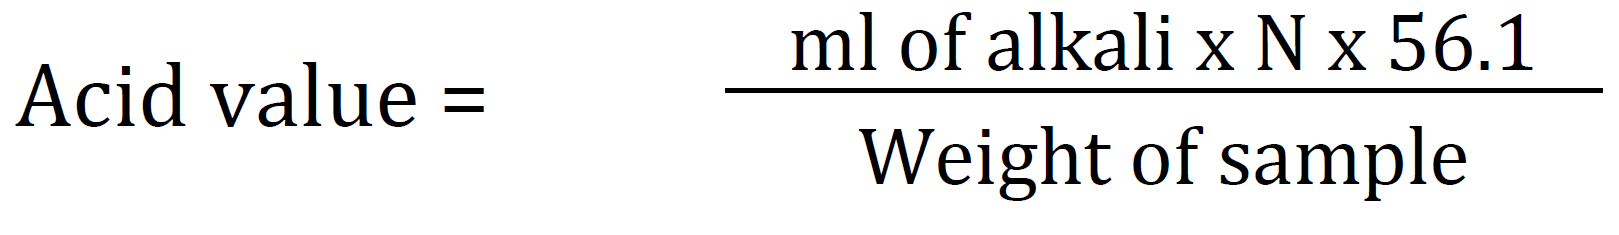
Where:
N : normality of KOH
The acid value was converted to free fatty acids as oleic acid by dividing the acid value by the factor 1.99
Saponification value
Saponification value is the amount of alkali necessary to saponify a definite quantity of the sample. It is expressed as the number of milligrams of potassium hydroxide (KOH) required to saponify 1 gram of the sample. This test was carried out according to AOCS official method Cd 3-25 revised.
2─3 g of oil was weighed in a 250 conical flask, then 50 ml of potassium hydroxide were added, the flask was heated on water bath under reflux for 30─60 min. in addition to the use of air condenser. Then, solution was cooled and titrated against 0.5 N HCL with phenolphthalein as an indicator. Blank determination was prepared and conducted simultaneously with the sample which was similar in all respects.
Calculations:
(B─S) X (M)
Saponification value = ────────── X 56.1
W
Where:
B : volume of 0.5 N HCL required to titrate blank, ml
S : volume of 0.5 N HCL required to titrate sample, ml
M : molarity of HCL solution
W : mass of test portion in grams
Unsaponifiable Matter
Unsaponifiable matter includes those substances frequently found dissolved in fats and oils, which cannot be saponified by the usual caustic treatment, but are soluble in ordinary fats and oil solvents. Steroids, pigments and hydrocarbons that do not form soaps when mixed with caustic soda comprise the unsaponifiable matter. These substances are indigestible and are soluble in common solvents for oils. Therefore, the higher their percentage, the lower is the energetic value of the oil or fat. It is assessed as the material extracted from the lipid source using diethyl ether after ethanolic alkaline saponification. The maximum level admitted in oils and fats is 1% [21].
The test was conducted according to AOCS official method ca 6a-40 [22]. 5 g of well-mixed oil sample were weighed accurately in a soxhlet flask. 30 ml of 95% ethyl alcohol 5 ml of 50% KOH solution were added. The contents of the flask were gently, but steadily boiled under reflux for an hour, or until completely saponified.
The saponified contents of the flask were transferred to the extraction cylinder and washed to 40 ml mark with 95% ethyl alcohol. The volume of the transferred solution were completed to 80 ml. The flask was washed with 5 ml of petroleum ether added to the cylinder. Then the contents were cooled to room temperature and 50 ml of petroleum ether were added. After that, the flask was shaken for one minute and then allowed to settle until both layers are clear. The upper layer was removed completely by glass siphon without including any of the lower portion. The petroleum ether fractions were combined in a 500-ml separator funnel. The extraction was repeated six times, using 50-ml portions of petroleum ether each time with vigorous shaking.
The combined extracts were washed in the separator funnel three times, by using 25-ml portions of 10% ethyl alcohol in distilled water, with vigorous shaking and drawing off the aqueous alcohol layer after each extraction. The washing process was continued with 10% ethyl alcohol solution until the wash solution no longer gives a pink colour after the addition of one drop of phenolphthalein solution. The petroleum ether extract was transferred to clean beaker and was evaporated to dryness on a water bath.
The drying was completed to a constant weight in a vacuum oven at 75─80ºC and international pressure of not more than 200 mm mercury. Then the beaker was cooled in a desiccator and weighed. The result becomes “ A “ in the calculation. After weighing the residue was taken up in 50% ml of warm (50ºC) 95% alcohol, containing phenolphthalein indicator and previously neutralized to phenolphthalein end point. Further more, the content of the beaker were titrated against 0.02 N NaOH. The grams of fatty acid determined by this titration become “B” in the calculation for determining percent unsaponifiable matter.
Unsaponifiable matter = (weight of residue ─ weight of fatty acid) X 100
Weight of the sample
Refractive Index
The refractive index of a substance is the ratio of the speed of light in a vacuum to the speed of light in the substance. The refraction of oils is characteristics within certain limits for each kind of oil. It is related to the degree of saturation but, it is affected by other factors such as free fatty acid content, oxidation and heat treatment. The test was carried out according to AOCS official method Cc 7-25 reapproved 1997 Revised 2002 [23].
The refractive index was measured by refractometer (CARL ZEISS JENA 2O2727 Germany) which was standardized following the manufacturer’s instructions, with a glass prism compared to refractive index of water which equal to 1.3330 at 20.0°C.
Several drops of sample were placed on the lower prism. The prisms were closed and tighten firmly with the screw head. The process was allowed to stand for 1–2 min or until the sample comes to the temperature of the instrument (25.0°C). Three separate readings were taken and the average was calculated.
Fatty Acid Composition
The oil sample (50-100 mg) was converted to its fatty acid methyl esters (FAME) as described by Marquard [24]. The methyl esters of the fatty acids (0.5 μl) were analyzed in a Hewlett-Packard 6890 (GC HP 6890) series gas chromatograph (Network GC system USA) equipped with a flame ionizing detector (FID) and a DB-23 capillary glass column (60 m x 0.32 mm i.d.: film thickness = 0.25 μm). This was operated under the following conditions: oven temperature program, initial 150°C for 1 min raised to 170°C at a rate of 10°C min-1 and then from 170° to 192° at 5°C min kept at 192°C for 5 min) 192°−220° C during 10 min and held for 3 min: The oven, injector and detector temperatures were maintained at 100○, 230○ and 230°C, respectively: Nitrogen was used as a carrier gas at a flow rate of 40 ml min-1. Peak identification was performed by comparing the relative retention times with those of a commercial standard mixture of FAME. The contents of palmitic (16:0), stearic (18:0), oleic (18:1), and linoleic (18:2) acids were determined using a computing integrator. The effects of the independent variables on oil content and palmitic, stearic, oleic, and linoleic acid concentrations of the oil were analyzed on a percentage basis.
Determination of the Oxidative Stability of Oils and Fats
Rancimat Method: Oxidative stability of the safflower oil was determined by using rancimat apparatus according to the international standard of AOCS CD 12B-92 [25]. The test was performed on an automated Metrohm Rancimat model 679 at 110±0.1ºC and an air flow of 20 L/hr, absorption solution was 60 ml distilled water, to determine the induction period (IP) of the individual oils.
Sample weight = 3g
Results and Discussion
Oil Content: Oil content is one of the most important traits for safflower evaluation. The success of safflower introduction in new areas is greatly affected by oil content of seeds [26]. The oil content and fatty acid composition of oil crops are not constant and can be influenced by genotype, environment and management practices.
Oil contents of safflower genotypes under investigation were significantly affected by genotype (p<0.01). The average oil percentage was 27.68 % (Table 2). The analysis of variance showed significant effects of genotypes on oil percentage (Table 2).
When the temperature increases during seed maturation, the content of linoleic acid decreases whereas, in contrast, oleic, palmitic and stearic acid contents increase. Standard safflower oil contains about 6–8 % palmitic acid, 2–3 % stearic acid, 16–20 % oleic acid and 71–75 % linoleic acid [27].
In the current study oil content is significantly affected by genotype. There was variation for seed oil content among genotypes with an average of 27 .68% of seed weight and a range of 20.03-35.58%. The highest seed oil content (35.58%) was observed in genotype 1 Table 2. While the others such as genotypes 5, 8, and 10 produced values over 30% Table 2. Oil contents was highest particularly in spiny genotypes obtained from Sudan (genotype 1 and genotype 5). This finding was in agreement with the finding of Knowles [28] Table 2. Variation in oil quality indicates the possibility for breeding safflower genotypes rich in linoleic or oleic acids.
Chemical Properties of Seed Oil
These include iodine value, peroxide value, saponification value, unsaponifiable products, and fatty acid composition. Iodine value measures the content of unsaturation of double bonds capable to react with halogens.
Iodine Value
Iodine values of the oils of the different genotypes of safflower evaluated were shown in Table2.The highest iodine value was achieved by genotypes 10, 9, and 4 150.3, 149.7, and 149.2 respectively while genotypes 6, and 3 showed the lowest iodine number 144.5 and 144.4 Table 2. This variations in iodine values of safflower oil indicated that climatic conditions, especially temperature, play an important role in the determination of the degree of saturation. i.e. oils with higher iodine values matured during the cold temperature in winter.
Saponification Value
Saponification value is the amount of alkali necessary to saponify a definite quantity of sample. The results of the saponification values of safflower oils were presented in Table 2. The highest saponification value was obtained by genotype 3 198.3 followed by gen. 1 197.2 and the lowest saponification value was achieved by genotype7 195.4 Table 2.
Unsaponifiable Matters
The substances that are frequently found dissolved in fats and oils, and cannot be saponified by the usual caustic, but are soluble in ordinary fat and oil solvents, are called unsaponifiable maters. Unsaponifiale matters percentage was shown in Table 2.
Fatty Acid Composition
Safflower (Carthamus tinctorius) is one of the best examples of a plant that shows variability in the fatty acid composition of seed oil. The results of analysis for oil content and fatty acids are shown in Table 3. The oil contents and fatty acids composition of the examined safflower genotypes differed from each other. Safflower genotypes showed statistical differences on the basis of oil content (p<0.001). The lowest oil content ratios of 20.03% and 20.62% were obtained from genotype 2 and 3 respectively. On the other hand, the highest oil ratios or percents were obtained from genotype 1 and 5 35.58% and 34.19% respectively. The oil contents of the remaining genotypes were scattered among these values i. e in the range between 34.19 and 35.58 Table 3.
Table 2: Chemical Analysis of Oil from the Safflower Genotypes Evaluated at Abu Haraz and Nisheishiba 2006/07-2007/08, Wad Medani, Sudan
| Genotype | Oil % | Rank | Acidity | Refractive index | Peroxide Value | Iodine value | Saponification value | Unsaponifiable products | Stability (hours) |
| 1 | 35.58a | 1 | 0.09 | 1.47 | 4.53de | 147.0bc | 197.2b | 0.35 | 6.43 |
| 2 | 20.03e | 10 | 0.25 | 1.47 | 12.43b | 148.6ab | 195.8c | 0.44 | 6.55 |
| 3 | 20.62e | 9 | 0.21 | 1.47 | 11.41b | 144.4d | 198.3a | 1.45 | 6.03 |
| 4 | 27.24c | 6 | 0.12 | 1.47 | 4.77de | 149.2a | 196.2c | 1.22 | 5.68 |
| 5 | 34.19a | 2 | 0.06 | 1.47 | 6.16cd | 145.9cd | 196.1c | 1.35 | 6.75 |
| 6 | 24.76d | 7 | 0.08 | 1.47 | 17.70a | 144.5d | 196.1c | 1.10 | 4.83 |
| 7 | 24.48d | 8 | 0.11 | 1.47 | 20.26a | 146.7c | 195.4c | 0.53 | 5.35 |
| 8 | 30.59b | 4 | 0.14 | 1.47 | 7.54c | 148.7ab | 195.9c | 0.95 | 6.68 |
| 9 | 27.83c | 5 | 0.09 | 1.47 | 8.20c | 149.7a | 196.1c | 0.74 | 5.72 |
| 10 | 31.49b | 3 | 0.11 | 1.47 | 2.78e | 150.3a | 196.0c | 0.58 | 6.02 |
| Mean | 27.68 | - | 0.12 | 1.47 | 9.58 | 147.5 | 196.3 | 0.87 | 5.99 |
| C.V | 2.90 | - | 6.18 | 0.01 | 14.58 | 0.24 | 0.35 | - | - |
| SE | 0.25 | - | 0.01 | 0.00 | 0.44 | 0.11 | 0.22 | - | - |
| Sign. level | ** | - | ** | ns | ** | ** | ns | - | - |
** is the level of significance at 1% and ns = non-significant. Means within the same column followed by the same letter (s) are not significantly different at the probability level of 5% according to Duncan’s Multiple Range test
Table 3: The Oil Content and Fatty Acid Composition of the Ten Safflower Genotypes Evaluated at Abu Haraz and Nisheishiba, Wad Medani, Sudan
| Genotype Fatty acid content (%) | |||||||||||
| Oi l(%) | C14:0 | C16:0 | C16:1 | C18:0 | C18:1 | C18:2 | C18:3 | C20:0 | C20:1 | C22:0 | |
| 1 | 35.58a | 0.11 | 6.03 | ----- | 3.12 | 14.80 | 75.10 | ----- | 0.41 | 0.21 | 0.18 |
| 2 | 20.03e | 0.12 | 5.32 | 0.28 | 2.48 | 15.68 | 75.10 | 0.10 | 0.37 | 0.30 | 0.20 |
| 3 | 20.62e | 0.17 | 6.51 | 0.03 | 3.20 | 15.97 | 73.11 | 0.09 | 0.44 | 0.19 | 0.24 |
| 4 | 27.24c | 0.12 | 7.04 | 0.06 | 2.09 | 12.49 | 77.34 | 0.08 | 0.29 | 0.17 | 0.27 |
| 5 | 34.19a | 0.11 | 6.76 | 0.04 | 2.90 | 14.64 | 73.87 | 0.32 | 0.38 | 0.70 | 0.24 |
| 6 | 24.76d | 0.13 | 7.41 | 0.08 | 2.78 | 14.65 | 73.85 | 0.09 | 0.44 | 0.19 | 0.32 |
| 7 | 24.48d | 0.10 | 6.58 | 0.03 | 2.93 | 14.52 | 74.83 | 0.07 | 0.43 | 0.19 | 0.28 |
| 8 | 30.59b | 0.13 | 7.04 | 0.07 | 2.17 | 13.11 | 67.60 | 0.10 | 0.33 | 0.20 | 0.21 |
| 9 | 27.83c | 0.19 | 7.74 | 0.06 | 2.52 | 12.20 | 77.13 | 0.09 | 0.30 | ----- | ----- |
| 10 | 31.49b | 0.12 | 6.80 | 0.05 | 2.48 | 11.70 | 78.02 | 0.08 | 0.32 | 0.17 | 0.21 |
16:0 palmitic acid (%): 18:0 stearic acid (%): 18:1 oleic acid (%): 18:2 linoleic acid (%). Means within the same column followed by the same letter (s) are not significantly different at the probability level of 5% according to Duncan’s Multiple Range test
Oil content ratios of 41.3% and 43.1% were reported in safflower by Bergman [29]. Oil content of safflower genotypes from different production areas of the world was reported as 27.6 to 31.8% [30], 22.2-29.4, 23.86-40.33% [31]. From Table 2 the results of the study were in accordance with those of previous findings reported by Esendal et al. [32]. The results had also, confirmed the fact that spiny safflower genotypes (1 and 5) contain more oil than spineless ones [33].
The fatty acid composition of the 10 safflower genotypes at Abu Haraz, and Nisheishiba was shown in Table 3. the oil of the genotypes in this study was mainly to be made up of 5.32 % to 7.74 % palmitic, 11.70 % to 15.97 % oleic, 67.60 % to 78.02 % linoleic, 0.07 % to 0.32 % linolenic, 0.29% to 0.44% arachidic, 0 % to 0.70 % eicosenoic and 0 % to 0.32 % behenic acid.
Results of chemical analyses revealed that in this collection, most of the genotypes were of the high linoleic type 67.6-78.02% of total fatty acids Table 3. The genotype effect was predominant for the fatty acid composition. Genotype 10 had the highest linoleic acid content, while genotype 8 contained the lowest amount of linoleic acid.
The range observed for stearic acid, (2.1-3.1%) in this sudy was little above the normal range (2-3%) reported for fatty acid by Fernández-martinez et al.[34]. The mean (6.7%) and range (5.03-7.7%) of palmitic acid in seeds were within the normal range reported for this fatty acid [28].
Oelke et al. [35] reported that there are two types of safflower genotypes, the type that produces oil which is high in monounsaturated fatty acids Oleic acid 18:1, and those with high concentrations of polyunsaturated fatty acids linoleic acid 18:2, which account for 90% of the total fatty acids. The remaining 10% correspond to the saturated fatty acids: palmitic 16:0 and stearic 18:0. Guan and Zheng 2008.
In this study oleic acid contents range from 11.7 to 15.97%, the highest oleic acid value was observed in genotype 3 15.97%. On the other hand, the highest values for linoleic acid were determined in genotype 10 78.02%. In contrast, the linoleic acid values ranges from 67.6 to 77.34% for the rest of genotypes Table 3. Velasco and Fernandez [36] indicated that safflower showed great versatility for seed oil contents and fatty acid composition.
Oxidative Stability (Rancimat Method)
The susceptibility of the studied oils to oxidation was measured by the Rancimat test. The end point of the Rancimat test can be determined by the induction period (IP) to the inflection point in the oxidation curve [37]. The Oil Stability Index (OSI) was determined using a Rancimat instrument. This test measures the induction period, which is the time needed to degrade organic acids derived from aldehyde and ketones, as well as the time needed to concentrate peroxide products in the solution [38].
The rapidity of oxidation of an oil depends on the degree of unsaturation, the presence of antioxidants, and prior storage conditions. In the OSI analysis, the rate of oxidation is slow until resistance to oxidation is overcome. This time is known as the oxidation induction period and it is a tool to determine the useful life of the oil. The length of the IP is considered a relative measure of the stability of oils.
The results of oxidative stability, in terms of measurement of IP are shown in Table 2. It was found that out of the ten safflower genotype tested 6 genotypes had the highest IP (>6). Genotypes namely, 5, 8, 2, and 1 had the highest shelf life above 6 months, whereas genotype 6 had the lowest storage period (less than 5 months).
The oil content was significantly affected by genotype with an average of 27.68% and a range of 20.03–35.58%. Genotypes 1, 5, 8 and 10 produced oil content percentages over 30%. Genotypes 1 and 5 are spiny, Sudanese collections. Most of the genotypes were of the high linoleic type 67.78–78.02 % of total fatty acids. The observed stearic acid range was 2.1-3.1 %. Oleic acid contents ranged from 11.7 % to 15.97 %.
The highest seed yielding genotype 10 which is 2 ton/ha (unpublished data) is spineless and having high oil content 31.49% and high linoleic acid 78.02% is recommended for further improvement together with genotype 1 which is spiny having seed yield of 1.7 ton/ha (unpublished data) 35.58% oil and 75.1% linoleic acid.
Mihaela, P. et al. “Perspectives of safflower oil as biodiesel source for South Eastern Europe (comparative study: Safflower, soybean and rapeseed).” Fuel, vol. 111, 2013, pp. 114–119.
FAOSTAT. FAOSTAT online database. 2015, faostat3.fao.org/saffower.
Aydeniz, B. et al. “Physico-chemical, sensory and aromatic properties of cold press produced safflower oil.” Journal of the American Oil Chemists’ Society, vol. 91, 2014, pp. 99–110.
Singh, V.N.N. “Safflower.” Breeding oilseed crops for sustainable production: Opportunities and constraints, edited by Surinder Kumar Gupta, Academic Press, 2016, pp. 149–167.
Han, X. et al. “Extraction of safflower seed oil by supercritical CO₂.” Journal of Food Engineering, vol. 92, no. 4, 2009, pp. 370–376.
Asp, M.L. et al. “Time-dependent effects of safflower oil to improve glycemia, inflammation and blood lipids in obese post-menopausal women with type 2 diabetes: A randomized, double-masked crossover study.” Clinical Nutrition, vol. 30, 2011, pp. 443–449.
Norris, L.E. et al. “Comparison of dietary conjugated linoleic acid with safflower oil on body composition in obese postmenopausal women with type 2 diabetes mellitus.” The American Journal of Clinical Nutrition, vol. 90, no. 3, 2009, pp. 468–476.
Fasina, O.O. et al. “Predicting temperature dependence viscosity of vegetable oils from fatty acid composition.” Journal of the American Oil Chemists’ Society, vol. 83, no. 10, 2006, pp. 899–903.
Neschen, S. et al. “Contrasting effects of fish oil and safflower oil on hepatic peroxisomal and tissue lipid content.” American Journal of Physiology–Endocrinology and Metabolism, vol. 282, no. 2, 2002, pp. 395–401.
Ben Moumen, A. et al. “Biochemical characterisation of the seed oils of four safflower (Carthamus tinctorius) varieties grown in north-eastern Morocco.” International Journal of Food Science and Technology, vol. 50, no. 3, 2015, pp. 804–810.
Sabzalian, M.R. et al. “Oil content and fatty acid composition in seeds of three safflower species.” Journal of the American Oil Chemists’ Society, vol. 85, no. 8, 2008, pp. 717–721.
Ashrafi, E. and K. Razmjoo. “Effect of irrigation regimes on oil content and composition of safflower (Carthamus tinctorius L.) Cultivars.” Journal of the American Oil Chemists’ Society, vol. 87, 2010, pp. 499–506.
Camas, N. et al. “Seed yield, oil content and fatty acids composition of safflower (Carthamus tinctorius L.) Grown in northern Turkey conditions.” Journal of Faculty of Agriculture, vol. 22, no. 1, 2007, pp. 98–104.
Smith, J.R. Safflower: Characteristics of safflower. American Oil Chemists’ Society Press, 1996, pp. 32–67.
Sehgal, D. and S.N. Raina. “Carthamus.” Wild crop relatives: Genomic and breeding resources – oilseeds, edited by Chittaranjan Kole, 2011, pp. 63–96.
Delshad, E. et al. “Medical uses of Carthamus tinctorius L. (safflower): A comprehensive review from traditional medicine to modern medicine.” Electronic Physician, vol. 10, no. 4, 2018, pp. 6672–6681.
Gupta, S.K. Breeding oilseed crops for sustainable production. 2016.
American Oil Chemists’ Society. Official and tentative methods. 3rd ed., AOCS Press, 1985.
American Oil Chemists’ Society. Official methods and recommended practices. AOCS Press, 1973.
American Oil Chemists’ Society. Official methods Cd 3–25. AOCS Press, 2003.
Butolo, J.E. Qualidade de ingredientes na alimentação animal. Colégio Brasileiro de Nutrição Animal, 2002. Cited in Baião, N.C. and L.J.C. Lara. “Oil and fat in broiler nutrition.” Brazilian Journal of Poultry Science, vol. 7, no. 3, 2005, pp. 129–141.
American Oil Chemists’ Society. Official methods and recommended practices. 4th ed., AOCS Press, 1990.
American Oil Chemists’ Society. Official method Cc 7–25. Revised 2002, AOCS Press.
Marquard, R. “Qualitätsanalytik im Dienste der Pflanzenzüchtung.” Fat Science Technology, vol. 89, 1987, pp. 95–99. Cited in Baydar, N.G. and M. A. “Oil content and oil quality properties of some grape seeds.” Turkish Journal of Agriculture, vol. 25, 2001, pp. 163–168.
American Oil Chemists’ Society. Official method Cd 12b–92. AOCS Press, 2013.
Bassil, E.S. et al. “Response of safflower (Carthamus tinctorius L.) to residual soil N following cotton in rotation in the San Joaquin Valley of California.” Journal of Agricultural Science, vol. 138, 2002, pp. 395–402.
Samanci, B. and E. Ozkaynak. “Effect of planting date on seed yield, oil content and fatty acid composition of safflower cultivars grown in the Mediterranean region of Turkey.” Journal of Agronomy and Crop Science, vol. 189, 2003, pp. 359–360.
Knowles, P.F. “Safflower.” Oil crops of the world: Their breeding and utilization, edited by G. Robbelen et al., McGraw-Hill, 1989, pp. 363–374.
Bergman, J.W. “Safflower genetic improvement for yield and value-added traits for the United States northern Great Plains.” Proceedings of the 4th International Safflower Conference, June 1997, pp. 229–231.
Rudra Naik, V. et al. “Selection strategy for yield improvement in safflower involving spiny and non-spiny types.” Proceedings of the 7th International Safflower Conference, November 2008.
Zhang, Z. and Y. Chen. “Studies on adaptability of safflower germplasms in Xinjiang, China.” Proceedings of the 6th International Safflower Conference, 2005, pp. 132–139.
Esendal, E. et al. “Effect of winter and spring sowing on yield and plant traits of safflower.” Proceedings of the 7th International Safflower Conference, 2008.
Weiss, E.A. “Safflower.” Castor, sesame and safflower, Barnes and Noble, 1971, pp. 529–744.
Fernandez-Martinez, J. et al. “Survey of safflower germplasm for variants in fatty acid composition and other seed characters.” Euphytica, vol. 19, nos. 1–2, 1993, pp. 115–122.
Oelke, E.A. et al. “Safflower.” Alternative Field Crops Manual, University of Wisconsin–Madison, 1992.
Velasco, L. and J.M. Fernandez-Martinez. “Breeding for oil quality in safflower.” Proceedings of the 5th International Safflower Conference, July 2001, pp. 133–137.
Mendez, E. et al. “Comparison of rancimat evaluation modes to assess oxidative stability of fish oils.” Journal of the American Oil Chemists’ Society, vol. 64, no. 3, 1997, pp. 331–332.
Barbi, J.H.T. et al. “Digestibilidade de gorduras e óleos na alimentação de aves.” XI Congreso de la AMENA y I del CLANA, 2003, pp. 159–177. Cited in Baião, N.C. and L.J.C. Lara. “Oil and fat in broiler nutrition.” Brazilian Journal of Poultry Science, vol. 7, no. 3, 2005, pp. 192–241.
