
+91 6002993949
submission@iarconsortium.org
Open Access
ISSN (Print) : 2708-5090
ISSN (Online) : 2708-5104
A study was carried out to assess the performance of the Kapenta (Limnothrissa miodon) fishing industry on Lake Kariba fishery covering the period 2010-2018. The aim of the study was to assess the effects of the lunar moratorium on catch per unit effort and the research objectives were to; establish the catch per unit during the four (04) years before and four (4) years after the implementation of the lunar moratorium, determine seasonal influence on catch levels, and assess stakeholder perceptions on the effects of lunar moratorium on catch levels. To thoroughly examine these areas of concern, we conducted a detailed literature review of the topic focusing on; physical environment, eco-biology, harvesting system, and livelihoods/socioeconomics. Such an approach helped us to eliminate factors that may, based on the understanding of fishers and the fishing communities on the shores of the lake, be considered to be responsible for the subsisting decline in catches. Data were collected from Kapenta rig owners operating on the Zambian side of Lake Kariba fishery, Department of Fisheries and the Local District Council. All rig owners are required by law to submit monthly statistics with details on landings (catches) and number of nights fished for each rig. The data collected was verified from the returns kept at the DOF local office and from local council office. Data with details on fishing nights per month, Kapenta wet weight in kilogrammes, number of hauls per fishing night, fishing month and year, fishing zone and rig identity number were collected covering a period from 2010 to 2018. The data were analyzed using descriptive and inferential statistics. Mann-Whitney U test in SPSS version 23 was used on data that did not meet the requirements for a parametric test. One-Way ANOVA and independent samples t-test were used on data that fulfilled the fundamental assumptions of a parametric test such as normality and homogeneity. Other tests used were Kolmogorov-Smirnov and Levene’s test. Results obtained showed that the effect of lunar moratorium was not significant. It was concluded that effective management of the lake Kariba fishery required multiple strategies covering the ecology and socioeconomics. To improve Kapenta catches in Lake Kariba, the fishing ban should be supported by other management strategies as outlined in the fisheries Act and recommendations from various scholars. More research is required relating to the impact of climate change on the eco-biology of Kapenta.
Kapenta (Limnothrissa miodon) was introduced from Lake Tanganyika into the man-made Lake Kariba, in and to occupy the pelagic habitat that had been created after the construction of a dam at Kariwa and the consequent formation of a manmade lake. This was based on recommendations earlier made. This man-made lake now forms the basis of commercial fisheries yielding more than 20,000 metric tons per year from Zambia and Zimbabwe combined (1). It has been documented in many parts of the world that the introduction of fish species into fresh waters where empty niches exist is a common practice. Examples of successes and failures have been recorded. Well-defined successes particularly of the Limnothrissa miodon include introduction into Lake Kivu in Tanzania as well as Lake Kariba itself and the involuntary introduction in Lake Cahora Bassa, Mozambique and a more recent one in Lake Itezhi-tezhi.
Contentious successes include, Nile perch, (Lates niloticus), into Lake Victoria or tilapia into Sri Lanka in Asia while abject failures are for instance, ruffe, (Gymnocephalus cernuus), into the Great Lakes of North America and carp, (Cyprinuscarpio) into Australia), (2).
From the perspectives of success therefore, we by implication articulate that the construction of the dam produced vast pelagic waters, which created an empty niche and it was assumed at the time, that this pelagic habitat would remain un-colonized because the extant species present in the Zambezi River had evolved in a riverine habitat and would therefore, based on the ecological understanding of aquatic systems only inhabit the shallow littoral zones and the pelagic habitat remaining un-utilized. On the basis of the adage ‘nature abhors vacuum’ the existence of a newly created pelagic habitat undoubtedly aroused scientific interest and according to. a number of studies were carried out to identify suitable candidate species to introduce into the lake to fill up the unoccupied ecological niche. It was on the positive scholars’ scientific findings and recommendations that the small pelagic clupeid, was successfully introduced. The government of the Republic of Zambia through the Department of Wildlife, Fisheries and National Parks introduced Kapenta from Lake Tanganyika into Lake Kariba between. This introduction was one of the resounding successes in the region and continent and, although the colonial Rhodesian (now Zimbabwean) government was not informed about the introduction, the researchers at the Lake Kariba Fisheries Institute (Zimbabwean side) observed the widespread presence of the species.
Studies were subsequently carried out in the 1970s to investigate the distribution, abundance and spawning of Kapenta and to determine the potential for commercial exploitation (3). Surprisingly, the Lake Kariba Fisheries Research Institute in Rhodesia which in fact was not involved in the introduction of the species, pioneered the carrying out of experiments using traditional techniques used on Lake Tanganyika and in July 1973, the first commercial fishing enterprise was formed, starting with purse seine and square lift net techniques. It was first issued a temporary licence, that was later converted to a fishing permit
From 1978, the fishery started to expand along the Rhodesian shoreline while Zambia the country which had introduced the species only started in 1981, a year following the independence of Zimbabwe. From that humble beginning, the Kapenta fishing grew into a multi-million-dollar industry, with between 20 -30 000 t landed annually, vastly outstripping the inshore fishery, and with theoretical potential for further expansions (4). In fact, the Kapenta fishery alone, through its profitability, is according to. directly responsible for most of the infrastructural development that has occurred on the Zimbabwean shoreline. gave a detailed account of the development of this fishery in Zimbabwe until the mid-1980s. From the early 1990s no new licenses were issued in Zimbabwe and the effort development seemed also to stabilize in Zambia around this time with a corresponding stabilization in catch rates of 150-200 kg per rig per night in both countries. From 1998 for instance, the decline in catches suddenly took hold and has continued to this day.
Several management efforts including the lunar moratorium have been used to regulate the sector so that catches can increase but to no avail. The two riparian states have often accused each other of being responsible for the alleged overharvesting and hence low catches, but this often ends up with various print and electronic media outlets with no matching efforts on the ground.
To thoroughly examine these areas of concern, we conducted a detailed literature review of the physical environment, eco-biology, harvesting system, and community livelihoods/ socioeconomics. Such an approached helped us to eliminate factors that may, based on the understanding of fishers and the fishing communities on the shores of Lake, be considered as being responsible for the subsisting decline in catches. We also wish to mention that in this report, the phrase fishing ban was synonymous to lunar moratorium.
Physical environment
Historical background of the fishery
The construction of the Kariba dam wall between 1955 and 1959 on the mighty Zambezi River bordering Zimbabwe and Zambia produced a vast man-made lake that changed the region. The primary objective for constructing Lake Kariba was to harness water for hydroelectricity supply mainly for the copper mines in Zambia as well as to support the emerging agricultural and industrial sector in Zimbabwe.
The lake stretches for 320km with an average width of 19.4km although the widest portion is 40km. The total area 5,364 km², and the shoreline is approximately 2,164km. At maximum height, the lake holds 157million cubic metres of water with an average depth of 29m and is 486m above sea level. The general features of the topography and hydro biography of the lake can be summarized as follows: Altitude is 665m at average high-water level, water temperatures at surface: 22 – 35 ˚ C; air temperatures are, 22.5˚ C to 28 ˚ C at the surface.
It was the largest man-made reservoir in the world at the time of construction, and is today the second largest reservoir in Africa by volume. The catchment area covers 663 817 km2 extending over parts of Angola, Zambia, Namibia, Botswana and Zimbabwe. The dam wall (128 x 580 m) was completed in 1960 and the filling phase up to September 1963 when the water reached the mean operation level around 485 m a.m.s.l. The lake is naturally divided into 5 basins and is shared as follows; 55% Zimbabwe and 45% Zambia.
The water levels fluctuate annually from 1 to 5 m (mean = 2.9 m) as a function of inflowing floods between December and June and continuous drawdowns through the turbines and, before 1981, spillage through the sluice gates. Since 1982 the lake levels have declined due to a series of droughts and the lowest levels recorded was in December 1992 and January 1997 at 476 m . Since 1997 the lake levels have again risen rapidly and the sluice gates were opened again for the first time in 19 years in April 2000.
The limnological and various biological characteristics of Lake Kariba are well described elsewhere (see e.g., Coche 1968, Balon and Coche 1974, Marshall 1984, and Moreau 1997 for comprehensive reviews.
Nutrient flow
The main source of nutrients in the oligotrophic lake Kariba is the run off of rivers draining directly into the lake. As a result of the rainy season input of nutrients, biological production in the epilimnion increases. Since the lake is stratified then the production in March is still limited by nutrients that sink to the bottom of the lake.
Between May and July, the stratification in the lake breaks down and nutrients are released to the surface waters resulting once again in increased biological production similar to an oceanic upwelling. From September up to summer, stratification intensifies resulting in loss of nutrients to the bottom and hence fish production starts to decline.
Eco-biology
Research carried out in the 1990s examined key biological parameters including estimates of growth parameters (linear and weight), reproduction rates, fishing mortality and natural mortality (SADCC/NORAD/DANIDA, 1992; Working Group Assessment, 1996).
It was found that mean fish length varied according to the season due to the seasonal difference in nutrient availability. Thus, the mean size of fish in catches was variable. This could explain some of the difficulties of using length frequencies for growth rate estimation. The team concluded that growth parameter estimates should be based on otolith readings. Since the last Working Group Assessment of Kapenta Stock in 1996, these growth parameters have not been updated. Apparently, no data has been collected from otolith readings, and there is no regular monitoring of length frequencies in the fishery.
Regarding size, it was found that the Lake Kariba Kapenta was smaller than the sizes observed for this species in the other lakes of the region (Tanganyika and Kivu) (Working Group Assessment, 1996). With respect to recruitment, the Kapenta stock has a huge recruitment potential as demonstrated during the introduction period in 1967 and 1968 when the population was able to grow from a very small parental population by developing a dense and lake wide population within four (4) years of its introduction (5-7). Recruitment appears to be unceasing, although there are peak periods of recruitment that are related to environmental factors such as the Lake turnover: June, July, August and also after the rainy season from December to February (5).
It was recorded that the species spawned twice a year in the Lake and developing from egg to adult in 5 to 6 months. The production potential for this fish is therefore high and this is why the fishery has been known to support high level yields (up to 60 kg/ha). Given effective management and regulation of the number of rigs in particular, such high levels are not expected to represent a threat to the viability of the stock due to the reproductive potential of the stock (Working Group Assessment, 1996). Additionally, the occurrence of larvae along most of the shoreline sampled implies that Limnothrissa miodon in Lake Kariba utilizes most of the shoreline as nursery grounds.
The natural mortality of Kapenta is high and includes predation mortality and other forms of mortality with the main predators being man (through fishing) and Tiger Fish (Hydrocynus spp) in that order, although other authorities suggest that there was no additional information available on Hydrocynus spp predation to Limnothrissa. It is therefore, unclear how much they affect natural mortality estimates (Working Group Assessment, 1996). It is also noted that cannibalism was not uncommon within the Kapenta species. In addition to man therefore, the other major parameter affecting natural mortality is food constraints. As Kapenta is located at the top of the trophic ladder, its natural mortality rate is mainly related to food constraints rather than predation.
Since Kapenta is inherently resilient, if fishing was well regulated it would support the industry sustainably, this is because the risk of recruitment versus overfishing in the fishery is very low due to the bio-ecological characteristics of Kapenta such as very high fecundity, rapid growth and a short lifespan, combined with the capacity to colonize the whole Lake from a very limited parental stock. With these collective inherent biological attributes, the stock can be said to be ecologically resilient and catch rates can recover rapidly when fishing effort is significantly decreased.
Impacts of climate change and selected environmental factors
In the last two decades scientists have expressed concern regarding the impact of climate change on the biology of aquatic species including Kapenta. It cannot be clearly stated with certainty what the ongoing global temperature rise would affect the species with respect to the productivity of Kapenta particularly in relation to their main source of food, phytoplankton blooms and zooplankton. For now, it is known that recruitment in the Kapenta fishery is highly dependent on these natural factors.
In this regard therefore, the role of environmental factors relating to the Kapenta stock size seems to be influenced by various environmental factors, including but not restricted to; the inflow of nutrients after rains and the hydrology of the lake. These consequential environmental factors affect productivity and the abundance of Kapenta as was also reported by Marshall (1982). He related Kapenta catches to the inflow regimes of selected tributaries in the lower catchment area and he demonstrated a relationship between catches and the flow of the major rivers feeding the lake. Such a relationship underscores the dependence of the Kapenta population on weather conditions. According to Marshall, (1982) climatic conditions were a factor that must be considered when planning management policies. Karenge and Kolding (1995) published an analysis of the relationship between Kapenta and environmental parameters in which they also related the fishery to the general hydrology of the lake.
(8) further showed the relationship between environmental factors, and the variability in catch rates (CPUE). They concluded that Lake Kariba was an allotropic riverine lake where productivity was largely driven by nutrient pulses carried by annual floods (river inflow and changes in water levels).
During the Working Group Assessment (Working group assessment 1996), it was demonstrated that there were seminal and critical links between environmental factors and CPUE. Results of the Working Group showed a significant correlation between the CPUE and inflow. The flow was separated into two components, the upper catchment inflow (Zambezi River only above Victoria Falls) and the lower catchment inflow plus rainfall (below Victoria Falls). The relationship between inflow from the lower catchment and fish production was strong, implying that despite a lower contribution to the total inflow, its influence on the fishery was still strong. This was reported to probably be due to the higher nutrient load of the inflow drawn from its catchment area. Therefore, droughts are expected to negatively affect Kapenta production since the main nutrients for Kapenta are a result of river flows. More recent research. also confirmed that both climate (maximum temperature in particular) and nutrients, which are influenced by water levels, are the primary determinants of Lake Kariba's Kapenta production. With ecological factors being optimum, one would expect a highly resilient Kapenta stocks. So, then, what could be the main reason for declining catches? This question remains largely unanswered and was the main thrust of this article. One would expect lower catches after a drought and vice versa, but this is not the case. It would therefore make ecological sense to explore other causes. for instance, cognitively suggested that since the influence of environmental factors on the fishery is also recognized as having a significant impact on the Kapenta fishery production, and that the influences of abiotic factors on the productivity of the Kapenta stock are exogenous and therefore, they cannot be controlled by external (human) management measures. Thus, the environmental factors that influence Kapenta production should be considered as a constraint to management systems and be taken into account in risk evaluations when planning management policies. Hence, it was also suggested that if weather forecasts were made available, they would be of great use when planning the allocation of fishing effort in the fishery.
During the period, September to March, Kapenta sardines move inshore to protected waters to spawn and the open water population is depleted. Commercial catches rise again after March as the adults return to the open water. Sales of Kapenta appear to be particularly high during holidays and the month of December (Christmas), when a lot of people return to rural areas
We argued in this paper that although the abiotic and biotic factors alluded to by various researchers were critical in sustaining stocks, the human component particularly the overharvesting could be the leading factor responsible for the declining catches, which is why this study was important.
Harvesting system
The current practice of dip net fishery, from pontoons or rigs at night with lights, began in 1976 in Rhodesia and in the 1980s on the Zambian side.
The rig design is more or less standard because they are produced by a limited number of shipyard companies around the Lake. Differences only occur in the quality of the rig construction with the cheapest having the least powerful engines and also have shorter lifespan (approximately 5 years) and thereafter, must be replaced. The rig size is generally about eight (8) to 12 meters long and approximately seven (7) meters wide (Figure 1) and are powered with an engine although some among the fleet are not mobile and have to be towed to the fishing areas but generally, they are all powered by engines which vary in horsepower from one company to another.
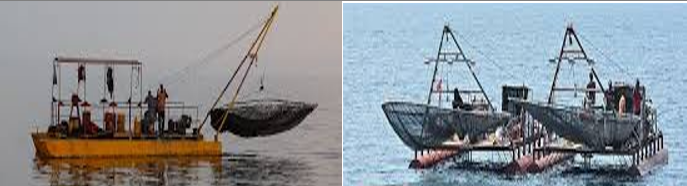
Figure 1: Basic construction and appearance of a Kapenta fishing rig (Source: kapentafacebook.com).
Fishing gear on the Lake consists of large circular dip nets with lighting systems to attract the fish. The dip net is raised and lowered by manual, mechanical, or hydraulic winches (see Figure 1). The type of winch used usually affects the number of hauls during a fishing shift as well the minimum crew size. The mesh size of the net’s ranges from four (4) to 12 mm although regulations allow for eight (8) mm. Mercury light bulbs are used both above and under the water surface. ‘Fish finder’ devices to locate schools of Kapenta, to define the profile of the lake bottom and to select fishing areas are used. In Zimbabwe, over 52 percent of the fishing vessels identified (n = 244) were fitted with fish finding devices (Frame Survey, 2011). The majority (68 percent) of the fishing rigs with the fish finding devices were located in basin five (5). In Zambia, 91.5 percent of the rigs use fish finding devices when fishing (Frame Survey, 2011).
With respect to the importance of Kapenta in the fishing industry on Lake Kariba, the Bioeconomic Modelling of Kapenta fisheries on Lake Kariba showed that the clupeid was the main fishery accounting for an average of 90 percent of the total catches (Frame Survey, 2011; (9-11), forming a single species fishery. As a single-species fishery there are very few interactions with gillnet artisanal fisheries that usually operate in the inshore areas of the Lake. Bycatch species caught by the Kapenta fishery in offshore areas include; tiger fish (Hydrocynus vittatus), squeaker (Synodontis zambezensis), bottle fish, cornish fish; mudsuckers; burble fish; and bream (Economic Survey, 2013). Reported quantities of bycatch per rig and per night fished are very low (1 to 2 Kg), except for some companies that report a few dozen kilos of bycatch per night fished. Results of the 2013 Economic Survey showed that, in both Zimbabwe and Zambia, any bycatch is kept by the crew and is not sold which further underscores the importance of kapenta. Implying therefore, that the dominant species is Kapenta and as such, it is also politically controlled. Consequently, issuance of licences and monitoring on the part of the Department of Fisheries which is at best both understaffed and underfunded is obviously severely compromised.
On the other extreme, the exploitation of the, Limnothrissa miodon, has been an area of controversy between the two riparian states particularly on the lack of compliance on the number of rigs each country is required to maintain on the lake. It was previously agreed, under the auspices of the Zambia/Zimbabwe SADC Fisheries Project, that management of the Kapenta fishery be conducted jointly with agreed harvest levels . Based on the results obtained during the 1997 study for instance, it was concluded that the maximum sustainable yield of the Kapenta was 25,000t and that the stock was 30,000t. Based on these stock levels the Zambia/Zimbabwe SADC Fisheries Project set a maximal limit of 500 Kapenta fishing rigs for the Lake in order to allow fishing to continue at a sustainable level, with this number divided on a 45: 55 ratios, giving Zambia 230 rigs and 270 for Zimbabwe.
By 2011 however, the Zambian side had increased by more than 200% from 230 to 632 rigs the increase of which was largely attributed to inadequate monitoring and policing. The number 632 was said to be on the lower ebb as there were no comprehensive records of the actual number of vessels licensed on the Zambian side of the Lake. Anecdotal reports suggested that there were a number of unlicensed rigs operating side by sided with licensed vessels. An improvement in the monitoring of Kapenta off-takes was expected after the establishment of a Kapenta Fishermen’s Association (KFA) which was anticipated to ensure and guide sustainable utilization of fisheries resources but failed largely due to lack of support and a lack of policing of their policies by the Department of Fisheries (12).
There is no doubt therefore, that although, the harvesting is based on licensing procedures administered through the Department of Fisheries in Chilanga, which is also supposed to regulate the number of rigs based on the agreed number between thew two countries, the system is largely defective. And so, the anecdotal reports which suggested that since mid-2000 fishing capacities (number of rigs) and fishing effort (nights fished per rig) have increased dramatically could be undeniably true. In fact, there could be a large number of rigs on the Lake operating without licenses which further exposes fragility in the management system particularly on the Zambian side of the lake.
Operators further claim (based on catches per unit effort) that, production levels have been experiencing a downward trend since the early 1990's (13) and suggest that the main causes for such declines largely unexplained, but could be, based on the experience of operators perhaps be largely attributed to, overexploitation, influence of climate conditions on resource productivity, just to name a few (14). According to (15-16) however, there are strong indications that confirm an economic overexploitation of the fishery and wide dissipation of its wealth potential related to the rent of the resource.
The persistence of the supposed over harvesting to the present time doubtlessly put the Kapenta fishing industry in a risky environment and cause those with fishing licenses to be more exploitive with resources. Because of that, a bioeconomic study of the Kapenta fishery on Lake Kariba became inevitable as was reported. This study was recommended to assess the optimum economic rent with the model, and discuss the possibility of using the Maximum Economic Yield (MEY) as a management target. It was believed that such a study would essentially examine distinct management scenarios with regard to fishing effort allocation and to offer advice on the optimum number of rigs that should be licensed in Zambia and Zimbabwe.
The results of this survey also revealed overfishing of Kapenta that was most prominent on the Zambian 45 percent share of the of Lake. The number of rigs were now reported to exceed 1,000 on the Zambian side of Lake Kariba alone. This was four times the number of vessels estimated to keep fishing at the original maximum sustainable yield.
Livelihoods and socio-economics
Even though there are not any recent studies on consumption patterns, it appears from all evidence that dried Kapenta is popular because refrigeration is not required for conservation. According to a study carried out by Sen. It was shown that dried Kapenta was the second most consumed fish in rural areas of Zimbabwe, and the third most consumed fish in urban areas. Dried Kapenta is recognized and appreciated by consumers for its taste and affordability. There is, however, a need to update these markets studies to better assess the role of Kapenta in food security and poverty alleviation. In addition to its affordability, it is also very nutritious as both the bones and flesh are consumed. In rural areas where protein sources are limited, it can address cases of malnutrition. Studies carried out by (17) on concentrations of some nutrients in Kapenta showed kapenta to be a rich source of nutrients. This study by (17) compared Kapenta and Norwegian fish powder by examining the composition of some amino acids, vitamins and minerals in 100 grams Kapenta, fish powder and maize flour, and the estimated daily requirement of these nutrients in a 2-year-old child (weighing 12 kg). This study and its results support the importance of Kapenta in the diets of many Zambians and Zimbabweans alike (Table 1, Table 2; Figure 2).
Table 1: Concentrations of some nutrients in Kapenta and Norwegian fish powder
Nutrient Kapenta Fish Powder Unit | ||||||||||||||||||||||||||||||||||||||||||||||||||||||||||||||||||||||||||||||||||||||||||||||||||||
|
Table 2: The composition of some amino acids, vitamins and minerals in 100 grams Kapenta, fish powder and maize flour, and the estimated daily requirement of these nutrients in a 2-year-old child (weighing 12 kg) (Source: Haug et al., 2010)
Nutrient | Kapenta | Fish powder | Corn flour whole grain, white Estimated requirement in children 2 years (12 kg) b | |
Water g | 6.5 | 4.8 | 10.9 |
|
Protein g | 72.9 | 72.8 | 6.9 | 12.6 g/day |
Amino acids: |
|
|
|
|
Cysteine g/100g | 0.75 | 0.82 | 0.13 |
|
Methionine g/100g | 2.13 | 2.07 | 0.15 | 0.32 (met+cys) g/day |
Aspartate g/100g | 6.32 | 6.8 | 0.48 |
|
Threonine g/100g | 2.78 | 2.75 | 0.26 | 0.34 g/day |
Serine g/100g | 2.70 | 2.88 | 0.33 |
|
Glutamine g/100g | 9.38 | 10.29 | 1.30 |
|
Proline g/100g | 2.45 | 3.10 | 0.61 |
|
Glycine g/100g | 4.07 | 4.59 | 0.28 |
|
Alanine g/100g | 4.28 | 4.66 | 0.52 |
|
Valine g/100g | 3.71 | 3.84 | 0.35 | 0.40 g/day |
Isoleucine g/100g | 3.03 | 3.45 | 0.25 | 0.32 g/day |
Leucine g/100g | 5.11 | 5.41 | 0.85 | 0.69 g/day |
Tyrosine g/100g | 2.26 | 2.44 | 0.28 |
|
Phenylalanine g/100g | 2.80 | 3.07 | 0.34 | 0.59 (phe+tyr) g/day |
Histidine g/100g | 2.66 | 1.74 | 0.21 | 227 g/day |
Ornithine g/100g | 0.04 | <0.01 |
|
|
Lysine g/100g | 5.59 | 5.88 | 0.20 | 0.64 g/day |
Arginine g/100g | 4.03 | 4.39 | 0.35 |
|
Hydroxyproline | <0.01 | <0.01 |
|
|
Tryptophan g/100g | 0.82 | 0.83 | 0.05 | 0.09 g/day |
Taurine g/100g | 0.67 | 0.59 |
|
|
Minerals and vitamins: |
|
|
|
|
Iron mg | 7.2 | 7.2 | 2.38 | 7 mg/day |
Zinc mg |
| 6.0 c | 1.73 | 3 mg/day |
Iodine ug |
| 300 c |
| 90 ug/day |
Selenium ug |
| 200 c | 15.4 | 20 ug/day |
Calcium mg |
| 3000 c | 7 | 500 mg/d |
Phosphorus mg |
| 2000 c | 272 | 460 mg /d |
Potassium mg |
| 1300 c | 315 | 1800 mg/d e |
Magnesium mg |
| 220 c | 93 | 1.2 mg /d |
Vitamin B12 ug | 28 | 36 | 0.00 | 0.9 ug/day |
a USDA National Nutrient Database for Standard Reference [21]. b RDA, children, 2 years 12 kg [42]. c Reported by the producer of the fish powder product. e Dietary Guidelines 2005 [22].
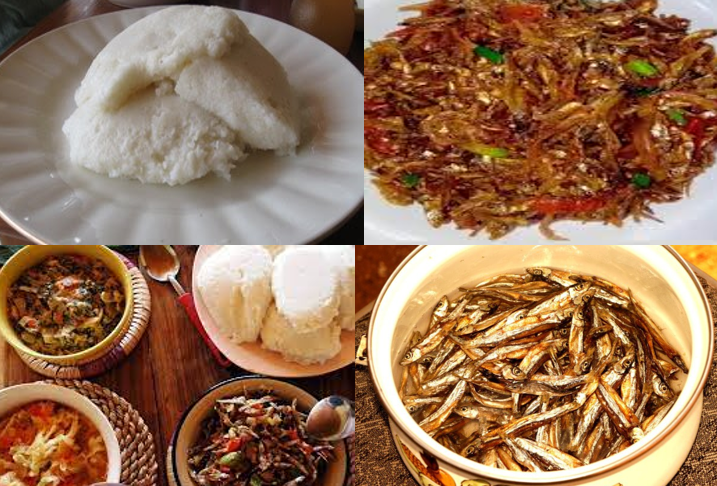
Figure 2: Nshima and Kapenta (small sardine family fish), whatever animal-based source on the nshima menu vegetables are almost always served on a typical Zambian meal.
(Source: ifisashi and facebook, com; images, Zambian.com; the culture.com; nshimaaliveinafrica.com; Wikimedia.common).
Notes: Nshima or Nsima is a maize or cornmeal product and a staple food in Zambia and Malawi. It is made from ground maize (corn) flour known locally as mealie-meal and as Unga in Zambian languages. Nshima is called ugali in East Africa, Sadza in Zimbabwe, Pap in South Africa and Fufu in West Africa.
Study Area Location and Description
This study was conducted in the Lake Kariba area which is located on the Zambezi River between Latitudes 16°15' to 18°04'S and Longitudes 26°42' to 29°03'E and is one of the largest man-made reservoirs in the world (Figure 3).
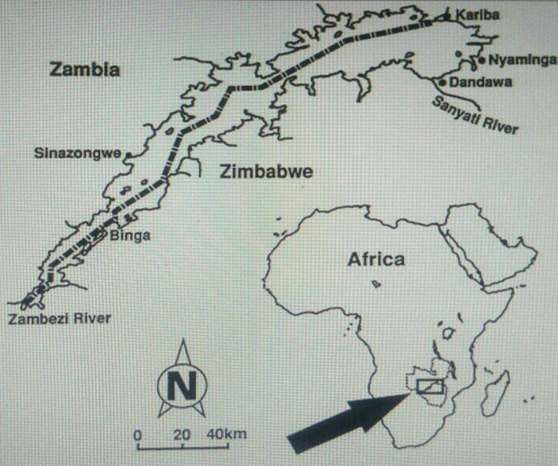
Figure 3: Location of Lake Kariba Fishery on the Zambia - Zimbabwe international boundary.
Description of the study area
Lake Kariba fishery supports two commercial capture fisheries namely the inshore fishery and the pelagic (Kapenta) fishery. The inshore fishery exploits Tilapia species and other larger fish species, caught largely by use of gillnets. The fishery supports livelihoods of thousands of fishers in Zambia and Zimbabwe. The pelagic fishery is based on the exploitation of a freshwater sardine (Limnothrissa miodon), locally known as Kapenta, which dominates the pelagic zone of the lake.
For management purposes, Lake Kariba is divided into four Strata or three (03) zones. The zones are distributed according to district administrative boundaries. Zone I is located in Sinazongwe district covering stratum I and II and starts from the Devil’s Gorge to Jongola stream (Figure 4). It has the most fishing activities as it comprises the largest share of the lake on the Zambian side; Zone II (covering stratum III) is in Gwembe district and stretches from Jongola stream to Henga steam. Zone III (covering stratum IV) is located Siavonga district and stretches from Henga stream to the dam wall (18).
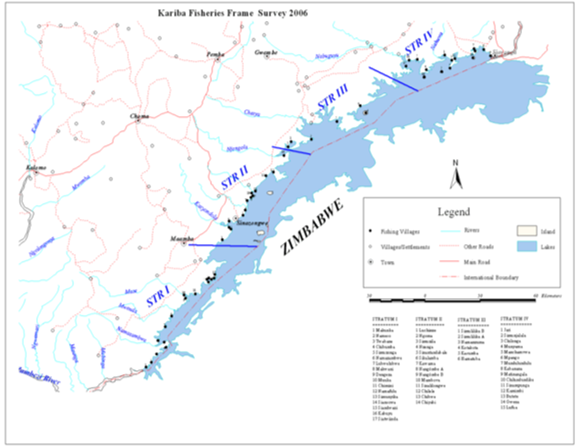
Figure 4: The zonation of Lake Kariba Fishery (Source: Lake Kariba Frame survey, 2011)
Human population and livelihoods
The Zambian side has three districts along the shores of Lake Kariba: Sinazongwe, Gwembe and Siavonga. The trio are situated in the Gwembe valley, occupied by mostly the valley Tonga-speaking ethnic group. In 2010 the three districts had a combined population of 234,181 inhabitants; Sinazongwe; 98, 240, Gwembe; 50,130 and Siavonga; 85,811. More than 10,000 people along the shores of Lake Kariba are known to depend on Kapenta directly or indirectly for their livelihoods.
Data capture techniques
In this study, we focused mainly on Kapenta fishing rig owners operating on the Zambian side of Lake Kariba fishery. For the purpose of the study, a fishing rig was defined as a boat mounted with a net used to capture Kapenta by light attraction in the night (see Figure 1). The boat is equipped with a generator for lighting during fishing at night. All rig owners that submitted catch and effort data from 2010 to 2017 for the whole Lake Kariba were considered and this constituted the target population.
Sample selection and data collection
The target population for this study consisted of seventy-one (71) registered rig operators (companies) located in Stratum I and Stratum II (Zone I) of the Lake Kariba Fishery. The list of the 71 Kapenta rig companies and 422 licensed rigs was obtained from the local office of the Department of Fisheries. Proportional random sampling was used, whereby two (2) strata were first purposively selected and then 14 Kapenta rig companies and two (2) rigs per Company were randomly selected from Stratum I and Stratum II for the survey, resulting in a total of 28 rig owners and 56 rigs. The data collected covered the period 2010 up to early 2018. Additional data were collected from the council barrier check point where companies are also required declare their catches.
Effect of the fishing ban on fishing nights and catch per unit of effort of Kapenta
Time series data on Limnothrissa miodon were collected from the Department of Fisheries which is the main regulatory authority of the fisheries of Lake Kariba. The department collects Kapenta data declared by Kapenta fishers. All rig owners are required by law to submit monthly statistics with details on landings (catches) and number of nights fished for each rig. The data were therefore collected from the returns kept at the DOF local office. Data with details on, fishing nights per month, Kapenta wet weight in kilogrammes, number of hauls per fishing night, fishing month and year, fishing zone and rig identity number were collected covering a period from 2010 up to early 2018.
Kapenta fishers’ and government officers’ perception on fishing ban
Face-to-face personal interviews using semi-structured interview guide was used to engage Kapenta rig owners and government officers. Data collected from Kapenta fishers contained perception ratings of fishing ban, Kapenta company profile and awareness about fishing ban. Data on government officers’ view of the performance of the fishing ban were collected from two (02) district officers from Sinazongwe, one (01) provincial officer from Choma and two (02) National officers from Chilanga.
Data Analysis
Data collected from this survey went through exploratory steps, in which data were checked, explored, coded, cleaned and transformed. Descriptive statistics was performed to obtain measures of central tendency, and frequency distribution patterns before advancing into inferential statistics. Mann-Whitney U test in SPSS version 23 was used on data that did not meet the requirements for a parametric test (see Table 3; 4) below.
Table 3: Tests of normality
Variable | Kolmogorov-Smirnov | ||
Statistic | df | Sig. | |
Nights | 0.14466 | 21971 | 0.001 |
Weight | 0.27143 | 21971 | 0.001 |
CPUE | 0.27725 | 21971 | 0.001 |
Kapenta catches declared | 0.24624 | 811 | 0.001 |
Table 4: Test of homogeneity of variances
Variable | Levene's Test | |||
Statistic | df1 | df2 | Sig. | |
Nights | 824.122 | 1 | 21969 | 0.001 |
Weight | 175.431 | 1 | 21969 | 0.001 |
CPUE | 85.086 | 1 | 21969 | 0.001 |
Kapenta catches declared | 150.580 | 1 | 809 | 0.001 |
One-Way ANOVA and Independent Samples t-test were used on data that fulfilled the fundamental assumptions of a parametric test such as normality and homogeneity.
Other tests used were Kolmogorov-Smirnov and Levene’s test.
Ethical Considerations
All participants in this study were rightfully informed about the purpose of the research and assurance of confidentiality of their identity and responses they gave. Respondents were not coerced to participate in this study in any way because only those willing were interviewed. The respondents further assured that their responses cannot lead to any civil or criminal proceedings, and as such, individuals were given code numbers instead of names.
The results below provide a succinct account of the findings on the effects of lunar moratorium on; fishing effort, catch per unit effort, and stakeholder perceptions on the effect of lunar moratorium,
Effect of’ lunar moratorium on fishing nights
Time series data showed a steady decline in fishing effort (night fished) from 2010 to 2017 (Figure 5). The average monthly effort reduced from 22 nights-fished per rig before the fishing ban to 18 nights fished per rig after the fishing ban. Annual fishing nights decreased from an average of 72,000 nights fished before the fishing ban (2010-2013) to an average of 65,000 nights fished after implementing the fishing ban (2014-2017).
The results of the Mann-Whitney U test showed that fishing nights (effort) was significantly greater before the fishing ban (Mean Rank = 12,811.60) than after the fishing ban (Mean Rank = 8,286.52), U = 3416238, z = -52.09, p < 0.001 (Table 5).
Table 5: Mann-Whitney U Test for Fishing Nights
Variable | U value | Z | p-value | Mean Rank Scores | |
Before FB | After FB | ||||
Fishing Nights | 34162038 | -52.09 | 0.001** | 12811.60 | 8286.52 |
** Significant at 1% level of significance.
See also Figure 5 below which shows fishing effort variation from over the period 2010 - 2017
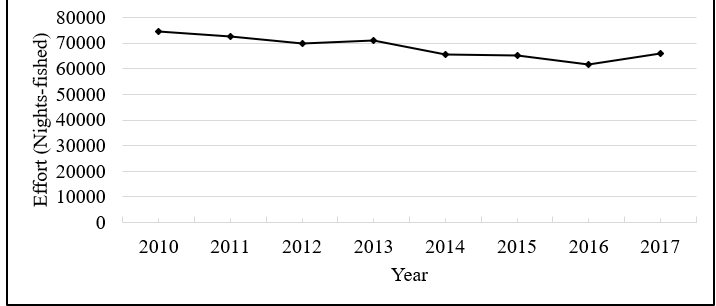
Figure 5: Fishing effort variation from 2010 to 2017
The reduction in effort was estimated to be 10 percent or 7,000 nights /year-1 . Figure 6 below shows monthly differences in fishing effort from January to December before and after the fishing ban. During the period 2010 – 2013 which was before the lunar moratorium, the nights fished were 24,000, which declined by 13 percent to 21,000 fished nights during the period 2014 – 2017 the period covered by the lunar moratorium.
Fishing pressure reduced towards the end of the years from October to December before the fishing ban but remained stable after the fishing ban.
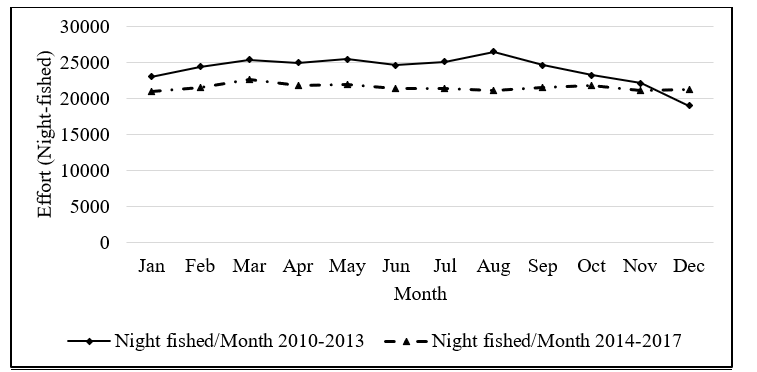
Figure 6: Fishing night variations before and after the fishing ban
Effect of’ lunar moratorium on Catch per Unit Effort
Comparison of the data on catch per unit effort before and after the implementation of a lunar moratorium showed a significant difference. Mann-Whitney U test showed that Kapenta catch per unit effort was significantly greater for before the fish ban or lunar moratorium (Mean Rank = 11734.65) than for after the fish ban (Mean Rank = 9878.99), U = 48277669, z = -21.28, p < 0.001 (see Table 6) for the values.
Table 6: Mann-Whitney U Test for Catch Per Unit Effort
Variable | U value | Z | p-value | Mean Rank Scores | |
Before FB | After FB | ||||
CPUE | 48277669 | -21.28 | 0.001** | 11734.65 | 9878.99 |
** Significant at 1% level of significance.
The catch per unit effort before the fishing ban was higher than the after the ban was implemented. The CPUE before the fishing ban, averaged 0.08 tonnes per rig per night-fished (t/r/n) from January to July, then increased from 0.08 t/r/n to 0.09 t/r/n from July to September and declined from 0.09 t/r/n to 0.06 t/r/n from September to December. After implementing the fishing ban, CPUE declined significantly about 0.065 tonnes per rig per night fished from January to 0.07 tonnes per rig per night fished from January to May, then reducing from 0.07 tonnes per rig per night fished to 0.06 tonnes per rig per night fished from January to July, then increasing to 0.075 tonnes per rig per night fished in August and reducing again to 0.045 tonnes per rig per night fished in December (Figure 7).
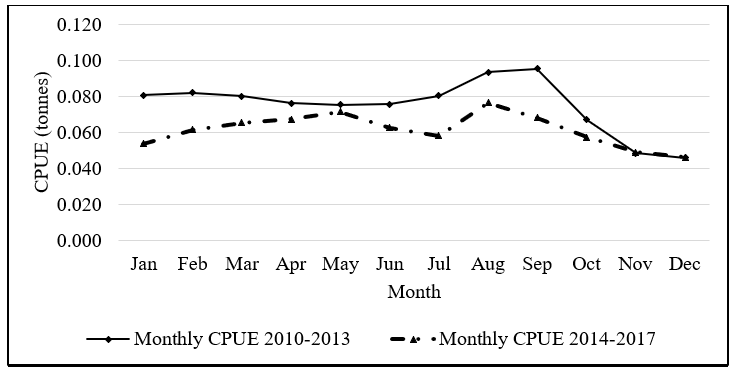
Figure 7: Variations in catch per unit effort before and after the lunar moratorium
Interaction of fishing effort, Catches and catch per unit effort
The interactions amongst fishing nights (effort), Kapenta catches and CPUE from 2010 to 2017 shows that, before the fishing ban (2010-2013), Kapenta catches averaged 5,500 tonnes wet weight per year. After the implementation of the fishing ban, catches reduced to an average of 4,000 tonnes wet weight per year representing a 28 percent reduction (Figure 8).
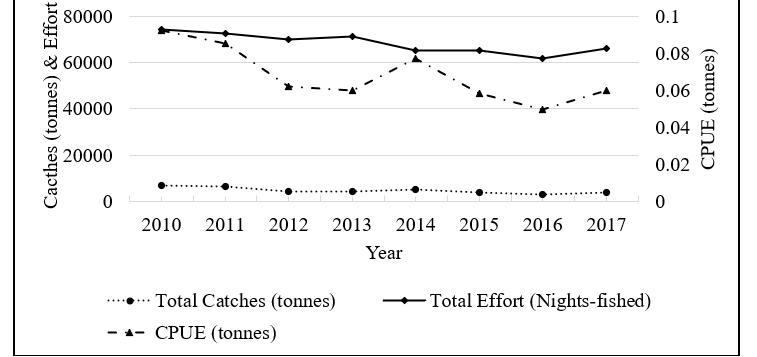
Figure 8: Interactions of fishing effort, catches and CPUE from 2010 to 2017
There was a steady decline in CPUE from 0.09 tonnes per rig per night fished to 0.06 tonnes per rig per night fished from 2010 to 2013, and then, 0.07 tonnes per rig per night fished in 2014 after which it declined steadily to 0.05 tonnes per rig per night fished in 2016 and then increasing to 0.06 tonnes per rig per night fished in 2017.
The fishing effort (night fished) showed a continuous decline from 74,500 nights fished in 2010 to 66,000 nights fished in 2017.
Mann-Whitney U test showed that Kapenta catches were significantly greater before the fishing ban (Mean Rank = 12,059.94) than for after the fishing ban (Mean Rank = 9,397.99), U = 44014093, z = -30.52, p < 0.001 (Table 7).
Table 7: Mann-Whitney U Test for Kapenta Catches
Variable | U value | Z | p-value | Mean Rank Scores | |
Before FB | After FB | ||||
Kapenta Catches | 44014093 | -30.52 | 0.001** | 12059.94 | 9397.99 |
** Significant at 1% level of significance.
Results obtained after performing a test using Whitney U test on data obtained from the council barrier also showed that Kapenta catches declared at council barrier were significantly greater before the fish ban (Mean Rank = 478.82) than after the fish ban (Mean Rank = 333.36), U = 52722.50, z = -8.84, p < 0.001 (Table 8).
Table 8: Mann-Whitney U Test for Kapenta Catches Declared at Council Barrier
Variable | U value | Z | p-value | Mean Rank Scores | |
Before FB | After FB | ||||
Kapenta Catches | 52722.50 | -8.84 | 0.001** | 478.82 | 333.36 |
** Significant at 1% level of significance.
The survey results showed that all stakeholders were aware of the lunar moratorium regulations, but of these, 84% had apperception that the lunar moratorium was not effective, while only 6% thought that it was effective. The remaining 10% were undecided.
The 84% who thought that the moratorium was not effective, did not experience a significant increase in catches after the moratorium, while the other 10% experienced high catch level throughout the fishing period after the fishery was opened to fishing and attributed the increase to the lunar moratorium.
In fact, 63% of the respondents had the opinion based on their catches that catch levels were high before the ban than after the ban, while only 10% confirmed improved catch levels after the ban while the remaining 27% were undecided with the view that Kapenta Catch levels were high after the fish ban.
This section dealing with perceptions, apparently did not yield consistent results from stakeholders, as those directly involved in the operations seemed to reject the notion that the lunar moratorium was effective while those serving under regulatory institutions such as the Council and DOF were either undecided or subtly agreed that it was effective.
The relationship between fish catches and the effort required to achieve them is crucial in the management of fisheries. In fish stock assessment, surplus production models are used to determine the effort that produces the maximum sustainable yield without affecting the long-term sustainability of the stock. These models have proved useful in assessing the economic development of the Kapenta fishery and identifying population dynamics of the fish. In 1997 for instance, a bio-economic assessment using the Beverton-Holt model was undertaken, to estimate the levels of fishing effort for sustainable exploitation of Kapenta in Lake Kariba. The study concluded that the maximum sustainable yield of Kapenta stood at 25,000 tonnes corresponding to 500 fishing rigs or 110,000 fishing nights (8). The 1997 bio-economic study has since been supported by a number of scholars (9-10) who used the surplus production models and concluded that the Kapenta fishery was overfished due to increased fishing effort.
The management practices implemented on Kariba fishery did not yield any positive results. The licensing system and other regulations did not work to limit the number of Kapenta entrants into the fishery and reduce the fishing effort. In 2013, reported another bio-economic assessment carried out in 2013 of the Kapenta fishery using the fox surplus model after observing a continuous increase in fishing pressure and reduced catch per unit effort.
The Catch per Unit Effort is often used as a proxy of abundance with a major assumption that the time series catch and effort data spans for a long period of time. The results of the study were that the fishing effort of 170,000 fishing nights were above the maximum sustainable yield of 110,000 fishing nights. The excess of the fishing effort relative to the effort needed to achieve the MSY was approximately 40 percent. A recommendation was made to limit access to the fishery by reducing fishing effort in at the level of capacity (fishing rigs) and intensity (fishing nights). With consultations with the fishing community and other interested and affected parties, the fisheries authorities implemented the monthly 10-day lunar moratorium with the aim of reducing fishing pressure. A move that was hoped to increase Kapenta yield and sustain the fishery.
Studies by Kinadjian (2013), as earlier reported showed that the fishing effort in Lake Kariba fishery was 40 percent above that needed for exploiting the Kapenta resource at a maximum sustainable yield. The 10 percent reduction in fishing effort observed in this study after the implementation of the fishing ban is therefore not adequate to reduce access to the fishery. The fishery is still operating at an effort above that needed for maximum sustainable exploitation of the Kapenta resource. Although the fishing ban regulation helped to reduce the fishing effort it should be backed by other management strategies. This later reason explains the dismal achievement recorded in this study.
Secondly, there was non-implementations of most of the working group resolutions shown in Table 9 below. This could also be testimony underscoring the failure to achieve increased catches after the fish ban.
Table 9: Implementation status of 2014 bio-economic working group resolutions
S/N | Actionable Item | Implementation Status | Comment |
1. | Non-issuance of new Kapenta fishing licenses | Done | No new licences, only renews |
2. | Reduction of fishing licenses by 50 each starting 2014 | Not done | Stakeholder engagement needed |
3. | Artisanal boats to stop navigating the lake from 06pm to 06 AM | Not done | Stakeholder engagement needed |
4. | District staff to recommend for license renews | On-going | Capacity being built in districts |
5 | Breeding area demarcation for no fishing | Not done | Inadequate resources |
6 | Removal of all illegal fishing rigs | Not done | Stakeholder engagement needed |
7 | Decentralize licensing to provincial or district level | Not done | Limited capacity at lower structures |
The bio-economic survey was conducted in 1997 estimated levels of fishing effort that would yield optimum economic return to the industry. The survey recommended a maximum number of 500 rigs for the whole Lake to be shared between Zambia and Zimbabwe according to the proportional size of the Lake (45% for Zambia and 55% for Zimbabwe). With this proportionality, 230 rigs were to fish on the Zambian side and 270 on the Zimbabwean side of the Lake. The findings from the economic modelling also indicated that any increase in the number of rigs beyond 500 rigs would not lead to large increases in catches. The results further indicated that increase in effort would only lead to decrease in catch per unit effort (CPUE) and increased cost per rig of catching a given weight of fish. This prediction has turned out to be accurate and accounts to a large extent the declining levels of Kapenta catches being experiences as confirmed by this study. As early as 2011, the frame survey conducted in that year revealed that there were 632 fishing rigs on the Zambian side alone which was already beyond the recommended limit.
By 2013, the number of rigs had increased from 632 to 960 rigs on the Zambian side alone (19), far outstripping the recommended total of 500 rigs for the whole lake. With such high levels of resource abuse, it is doubtful and untenable to expect improved catches from a 10-day lunar moratorium, which is why results from the stakeholders regarding the impact of the fish ban had mixed responses of both negativity and positivity and indication that the intended target was not achieved. Indeed, if the fishing effort is already 40 percent higher than the expected level, implementation of the fishing ban which resulted in10 percent reduction in fishing effort cannot be expected to yield significant results.
The poor stakeholder’s response on the effectiveness of the lunar moratorium, can be deciphered from the high expectations at the time it was implemented that it would achieve significant results, and perhaps operators were disappointed with the dismal results after a long wait. This may explain the high-level of undecidedness from stake holders.
Additionally, most past studies on the Lake Kariba fishery have recommended the optimal number of fishing rigs to be 500 on both sides of the lake in Zambia and Zimbabwe. The optimal number of fishing rigs of 500 is the maximum number required to sustainably exploit the Kapenta resource and ensure a stable ecosystem that will support the fishing community and traders. This number been by far exceeded, particularly on the Zambian side of the lake. As such, fishing pressure has continued to rise (20-21). The increase in the fishing effort obviously has resulted in the decrease of catch per unit of effort (CPUE), and so implementing lunar moratorium alone is inadequate to increase catch levels.
Conclusion
In this study, it can be concluded as follows:
That the fishing ban reduced the average fishing nights from an average of 22 nights fished per month before the fishing ban to an average of 18 nights fished after implementing the fishing ban. This implied each fishing rig reducing fishing effort from 264 nights per rig per year before the fishing ban to 216 nights fished per rig per year after the fishing ban resulting into an annual reduction of 48 nights fished for each rig
Even with the reduction in nights fished per month, the expected objective that there would be an increase in Kapenta catches after the lunar moratorium was not achieved.
The fishery was still operating with fishing effort above the maximum sustainable yield level and most of the fishers indicated that the lunar moratorium was not showing good results in terms of improved catches because the number of fishing rigs in the lake was still high more than 400 percent higher than the recommended quota of 230 rigs (for the Zambian side of the lake), and the fisheries authorities indicated that they issue on average 500 licenses per year.
It was also shown that in addition to the number of rigs, it was still inevitable to consider other factors such as climate variability and its multifaceted influence on Kapenta production in lake Kariba fishery as also reported by other scholars (34-3532,36). Environmental factors such as, increased temperature levels, erratic and reduced rainfall and increased evaporations could have an effect on Kapenta production as these factors seem to affect nutrient availability in the Lake. They stated that from 1964 to 2008 for instance, temperatures (thermal dynamics) increased by 1.5°C, pan evaporation rate increased 25% with rainfall declining by 21.1 mm at an average rate of 6.3 mm per decadal since 1964.
Most prominent influence of climate variability is the effects on lake water levels, which had reduced at an average rate of 9.5 meters in the past 15 years. Reduced lake water levels (Figure 8) have been associated with reduction in primary productivity, which reduces the availability of phytoplankton. The variation in Phytoplankton affects zooplankton availability, which serves as the main food for Kapenta thereby affecting its productivity.
The lunar moratorium alone without reducing the number of fishing rigs and other measures may not yield sufficient results to guarantee a sustainable Kapenta fishing industry.
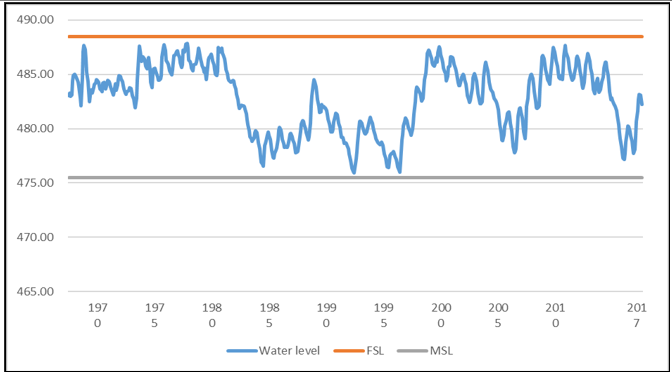
Figure 9: Water Level Variations from 1970 to 2017
Therefore, the reduced catch per unit of effort in addition to increased number of rigs could also be linked to environmental factors as the lake Kariba experienced low water levels from 2013 to 2016 due to the dry spells that were experienced in the same period. Reduced water levels could have resulted into reduced nutrient availability thereby affecting Kapenta productivity.
Recommendations
On the basis of the major finding of this study, we provided the following recommendations;
A reduction in the number of rigs to align it with the recommended quota of 500 (230 for Zambia) agreed upon by the two riparian states.
Monitoring of fishing activities should be strengthened so that un licensed rigs are removed from the water body.
The monthly 10-day fishing ban should be supported by other management strategies enshrined in the fisheries act to firmly regulate access to the fishery.
Stakeholder involvement is important in achieving the objective of reducing the fishing effort and improving the catch per unit effort.
Research is required to address the various aspects arising from the impact of climate change on the ecology of the lake and how this would affect productivity.
The DOF should carry out frame surveys and other stock assessments at designated time frames to update the data and improve decision making related to the Kapenta industry.
Acknowledgements
We thank most sincerely all colleagues who reviewed the article and provided useful comments.
Conflict of interest
The authors declare that the research was conducted in the absence of any commercial or financial relationships that could be construed as a potential conflict of interest.
Funding: No funding sources
Losse, G. F. The Small-Scale Fishery on Lake Kariba in Zambia. Wiesbaden, Germany, 1998.
Cowx, I. G. "Introduction of fish species into European fresh waters: Economic successes or ecological disasters?" Bull. Francais De La Peche Et La Pisciculture, no. 344-45, 1997, pp. 57-77.
Begg, G.W. "The distribution of fish of riverine origin in relation to the limnological characteristics of the five basins in Lake Kariba." Hydrobiologia, vol. 44, 1974, pp. 277-285.
Kolding, J. On the ecology and exploitation of fish in fluctuating fresh water systems. Department of Fisheries and Marine Biology, University of Bergen, Norway, 1994.
Mtsambiwa, M. Some management aspects of pre-recruitment ecology of the freshwater sardine Limnothrissa miodon in Lake Kariba. PhD RMES, 1996.
Marshall, B. E. Small pelagic fishes and fisheries in African inland waters. Food and Agriculture Organization of the United Nations, 1984.
Gillies, C. J. Kariba into the Millennium. New works, 1999. http://www.fishbase.org/manual/fishbaseyieldperrecruit_analyses.html
Karenge, L.P., and J. Kolding. "The relationship between hydrology and fisheries in man-made Lake Kariba, central Africa." Bergen, Norway, 1995.
Pella, J. J., and P. K. N. A. Tomlinson. "Generalized stock production model." Bull. Inter. Amer. Trop. Tuna Comm., vol. 13, 1969, pp. 421-496.
Reed, W E. "Optimum Age-specific harvesting in a nonlinear population model." Biometrics, vol. 36, 1980, pp. 579-593. Zambia/Zimbabwe SADC Fisheries Project (Lake Kariba), Project No. 50.
Horemans, B. "Report of the Sub-regional Workshop on Fishery Bioeconomic Modelling, 17-21 February 1992, Kariba, Zimbabwe." UNDP/FAO Regional Project for Inland Fisheries Planning (IFIP), RAF/87/099-TD/43/92 (EN), 1992.
Paulet, G. "Kapenta Rig Survey of the Zambian Waters of Lake Kariba." SF, 2013.
Maunder, M. N., et al. "Interpreting catch per unit effort data to assess the status of individual stocks and communities." ICES Journal of Marine Science, vol. 63, 2006, pp. 1373-1386. DOI: 10.1016/j.icesjms.2006.04.011
Subhandu, D. FAO Code of Conduct for Responsible Fisheries. Central Institute of Fisheries Education, Kolkata Centre, India, 2009.
Kinadjian L., et al. "Report on the Bioeconomic Modelling of Kapenta Fisheries on Lake Kariba." Smart Fish Programme of the Indian Ocean Commission, FAO Fisheries Management component, Ebene, Mauritius, 2014.
FAO. "Lake Kariba Fishery Frame Survey Report Zambia (draft)." Ministry of Agriculture and Livestock Department of Fisheries, 2011.
Haug, A., et al. "Use of dried Kapenta (Limnothrissa miodon) and Stolothrisaa tanganicae and other products based on whole fish complementing maize-based diets." African Journal of Food Agriculture Nutrition and Development, vol. 10, no. 5, 2010.
DOF. "Survey Report– Agriculture and Environment Division; Central Fisheries Research Institute, Lusaka," 2011.
Anonymous. "Working Group on the Bio-economic Assessment of Kapenta in Lake Kariba and Zimbabwe." Zambia/Zimbabwe SADC Fisheries Project, Report N°50. Kafue River Motel, 1997.
Madamombe, L. The Economic Development of the Kapenta Fishery in Lake Kariba (Zambia/Zimbabwe). MSc Thesis, 2002.
