+91 6002993949
submission@iarconsortium.org
Open Access
ISSN (Print) : 2708-5090
ISSN (Online) : 2708-5104
Fish species composition is an important indicator of ecological health. This study aimed at assessing fish species composition and diversity along Buguma Creek, Rivers State, Nigeria. The study was conducted for six months (January-June, 2020) from three sampling stations. Water quality parameters and fish samples were collected and analyzed monthly. Fish species composition was determined with simple percentages. Ranking method was used to ascertain the most abundant species. Fish diversity was evaluated using various diversity indices. The results indicated that all the water quality parameters (temperature, DO, pH, salinity, ammonia, nitrite, nitrate and water hardness/alkalinity) were not significantly different (p>0.05) in all three stations. Twenty (finfish species (belonging to 14 families out of which 11 were mono-specific) were identified in Buguma Creek, with the Sarotherodon melanotheron as the dominate species accounting for 39.42% (3304 individuals) of the total stock. For all diversity indices measured Station 3 recorded highest values followed by station 1 then station 2. Values at the three stations were: Shannon-Weiner index, H’ (S1 = 2.44; S2 = 1.94 and S3 = 2.50); Pielou's index of evenness J, (S1 = 0.83; S2 = 0.65 and S3 = 0.85); Simpson's Diversity index D, (S1 = 0.88; S2 = 0.77 and S3 = 0.89); Margalef Species Richness index, M, (S1 = 2.76; S2 = 2.13 and S3 = 3.06); Menhinick Species richness Index, d (S1= 0.73; S2 = 0.23 and S3 = 1.00).The dendrogram and diversity profiles showed that station 2 was different from stations 1and 3. However, the bootstrapping and diversity profiles showed that all the stations were similar. In conclusion, Buguma creek showed species diversity and with S. melanotheron being most abundant. In terms of bio-monitoring, the abundance of S. melanotheron might be an indication of presence of environmental stressors.
Fish species composition serves as an indicator of a balanced or healthy ecosystem. Distribution and abundance are important variables of fish population dynamics studies that will help in evaluating the effect of fishing on a fishery resources as a basis of fishery management decisions [1]. Nigeria fresh and brackish water bodies are the richest in West Africa in terms of fish distribution [2] and Buguma creek in the Niger Delta region of Nigeria support a rich and diverse assemblage of fish [3,4]. The decline of Fish and fisheries resources in the coastal waters of the Niger Delta, due to over exploitation and inadequate management cannot be over emphasized [5].
Fish is an important food for many Nigerians, especially those living in the rural areas, contributing essential proteins, minerals and micronutrients to their diets [6]. Odusanya [7] reported that over 270 fish species are endemic in Nigeria numerous fresh and brackish water bodies, making it the richest in fish diversity in West Africa. Information on the number of fish is necessary to determine the effects of fishing and other activities on any changes in the population [8]. Domination of introduced fish species could alter the composition of fish assemblage and lower fish diversity [9] and can also be a sign of pollution [10]. Therefore, it is necessary to gather information on the structure of fish assemblage in order to provide an effective management and conservative plans for fisheries ecosystem [11]. Fish is a sensitive indicator of physical and chemical habitat degradation, environmental contamination, migration barriers and overall ecosystem productivity. However, the ever-increasing anthropogenic impacts on fish biodiversity have greatly stimulated the need for using taxonomic inventories to understand the diversity patterns [12].
The biological community is characterized by species diversity. Species diversity of specific ecosystem indicates a stable and healthy environmental condition. Fish are use as bio-indicator organisms for bio monitoring in aquatic systems [13]. Fish is a sensitive indicator of physical and chemical habitat degradation, environmental contamination, migration barriers and overall ecosystem productivity. Information on the number of fish in a population is necessary to determine the effect of fishing, other activities or natural climate variation to detect any changes in the population [14,8]. Fishing not only reduces fish stocks, but excessive fishing pressure can also cause the collapse of fish populations and destabilization of the ecosystem and many of the fishes become vulnerable, endangered, or critically endangered [15]. Fishery-dependent data collection is one of the most valuable tools available to fishery managers to determine the catch estimates for both target species and any by catch involved in the fishery, or of all species in a multi-species fishery [16].
The Study Area and Sampling Stations
The study was carried out along Buguma Creek, located Southeast of the Niger Delta between longitude 6°47'E and 6°59'E and latitude 4°36'N and 4°59'N in Asari-Toru Local Government Area of Rivers State [3]. The Creek system consists of the main creek channel and associated interconnecting creeks such as Ido canal and Jordan creek (local name) which interconnect and surrounds Buguma and Ido community.
Three sampling stations located in the Creek were established for the study Figure 1. Station 1 (Latitude 4°44'42.6"N; Longitude 6°51'22.7"E) was located north of the NIOMR/Buguma brackish water fish farm, where the creek branches to Ido, (Ido canal). Activities such as fishing of shrimps and mining of sand locally usually takes place during ebb tide. Station 2 (Latitude 4°44'38.1N; longitude 6⁰51'27.4"E) in the recruitment pond of the NIOMR/Buguma brackish water fish farm. During high tide bring different types of fish directly to the recruitment pond from the Amayanabo Okolo through the Jordan creek. Station 3 (Latitude 4°44'32.6"N; Longitude 6°51'38.2"E) was located south of the fish farm at the main sluice gate, a portion of the creek called Jordan Creek by Buguma indigenes. Here, swimming activity usually takes place during high tide. It is also a landing site for sand and mangrove Woods etc.
Fish Sample Collection and Identification
Fish samples were caught during ebb tide at the different stations with (cast net, drag net and some fishing traps) within a period of six months (January to June, 2020). The fishes caught were removed from the nets or traps and transferred into pre-labeled (according to stations) large plastic bowls and were taken to the laboratory for species identification. Fishes were sorted and identified up to species levels using identification keys [17,18,19,20,21] and online through Fish Base.
Figure. 1. Map of the study area showing the sampling stations (Stations 1, 2 and 3)along Buguma Creek, Asari-Toru Local Government Area, Rivers State, Nigeria.
Determination of Physico-chemical parameters
At the point of fish sample collection, water quality parameters were also monitored. Temperature (°C) was taken using mercury in glass thermometer; pH was determined by the use of a pH meter (Model HI 9812, Hannah Products, Portugal); Salinity(‰)was determined using a hand held Refractometer (Model RE 6783, Atago , Portugal). Dissolved oxygen was evaluated using the Winkler method (APHA, 1998). Nitrite, nitrate and ammonia were determined using the LaMotte Water Quality kits for salt water (Aquaculture test kit Code 3635-05).
Data Analysis/ Diversity indices
Percentage compositions were calculated using simple percentages (Amachree and Arimieari, 2021). Biodiversity indices such as species diversity, richness, evenness were calculated following the standard Formula of Shannon-Wiener diversity Index H’ [22], Simpson diversity index D [23], Margalef richness index, M [24], Pielou’s evenness index J [25], Menhinick Species Richness Index, d [26]. Dendogram and booth strapping were used to measure similarity among the stations. Abundance score were estimated using a ranking method [27,28]. The abundance range uses percentage, key ranking and score as follows: 0.1-3.0%, 1 (Rare); 3.1-5.0%, 2 (Few); 5.1-9.0%, 3 (common); 9.1-30%, 4 (Abundance); 31% - above, 5 (Dominant).
Physico-chemical Characteristics of the Water in the Creek During the Sampling Period
The spatial variations in the physicochemical characteristics of the water across the three sampling stations during the study period are presented in Table 1. The results indicated that there was no significant difference between stations for all the parameters measured. On the other hand, there were significant differences (p<0.05) between the months for all parameters measured apart from pH, Do, and nitrate Table 2. Temperature was highest (29.00 ±0.00°C) in the months of January and February while the lowest (26.00±0.00°C) was in April. The highest salinity ranges (15.00-16.00) were observed between the months of January and April, while lower values of 12.00±1.73 and 13.00±0.00 ‰ were observed in the months of May and June respectively. The values of ammonia across the sampling months were the same (0.06±0.00) except in the month of March, which was significantly higher (0.12±0.00). The values of water hardness significantly varied (p<0.05) across the sampling months, with the highest (65.33 ±1.15) observed in the month of April and lowest (34.67 ±2.31) in January Table 2.
Percentage Composition of Fishes along Buguma Creek
The spatial variations of percentage composition of fishes across the three sampling stations are presented in Table 3. The results indicated that there are seven orders, 14 families and 20 species of fish in the study area during the sampling period. In station 1, the highest percentage composition (24.74%) was recorded for Neogobius melanostomus, while was Sphyraena guachanchowas not present (0.00%). In station 2, Sarotherodon melanotheron had the highest percentage composition (43.03%), while Periophthalmus barberus recorded the lowest value of 0.01%. Also, in station 3, Sarotherodon melanotheron had the highest percentage composition (21.23%), while the lowest (0.28%) was observed for Sphyraena guachancho. Overall, the highest total number of fish species (7341) was recorded in station 2, followed by station 1 (683), while the lowest (358) was recorded in station 3. The monthly variations of percentage composition of fishes across the three sampling stations are presented in Table 4. The results showed that S. melanotheron consistently had the highest percentage in all the sampling months,while Lutjanus goreensis and Monodactylue sebae recorded the lowest value of 0.08% in the month of January. In the month of February, the specie Megalops atlanticus recorded the lowest value of 0.05%, while Periophthalmus barberus had the lowest value of 0.08% in the month of March. Moreover, in April, three species namely; Chrysicthys nigrodigitatus, Lutjanus goreensis and Sphyraena guachancho recorded the lowest value of 0.14%.
Table 1: Spatial Variation in the Physico-chemical Characteristics along Buguma creek
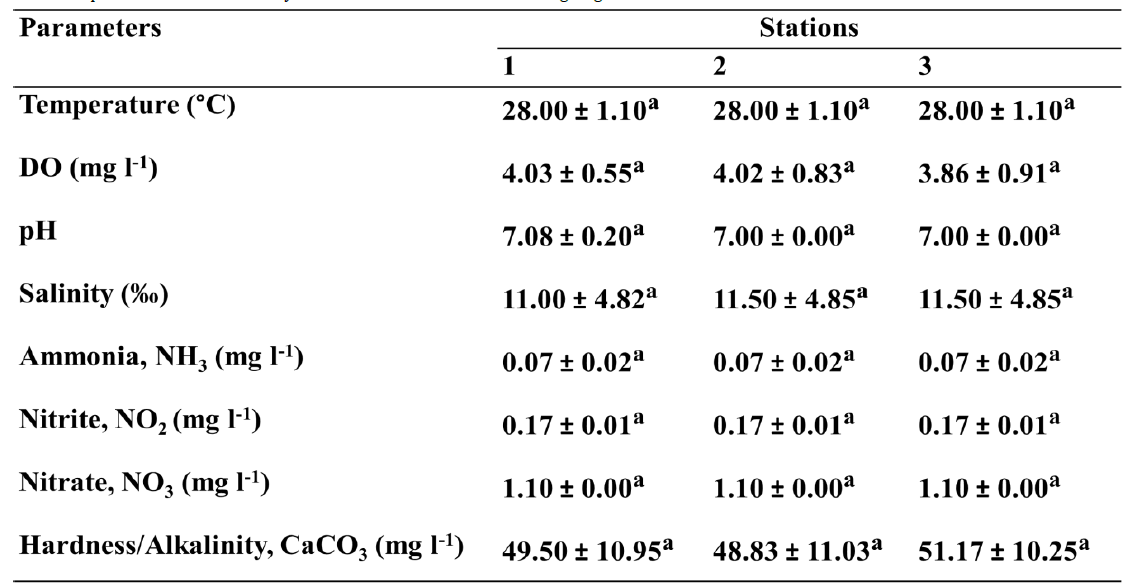
Data are mean ± SD for n=3. Different letter between rows indicates statistically significant difference (ANOVA, p<0.05)
Table 2: Monthly Variations in Physicochemical Characteristicsalong Buguma creek
Data are mean ± SD for n=3. Different letter between rows indicates statistically significant difference (ANOVA, p<0.05)
Table 3: Spatial Variation of Percentage Composition and number of individuals in bracket of Fishes along Buguma creek
In addition, M. sebae and P. barberus had the lowest values of 0.14% and 0.009% in the month of May and June respectively (Table 4). The pooled data for the number of species, percentage composition and abundance scale during a six-month sampling period in the study area are presented in Table 5. The results indicated that on the whole, 20 different species with the total number of 8382 were recorded during the six months sampling period. The highest number of specie (3304) and percentage composition (39.42%) was recorded in the specie
Table 4: Monthly Variation of Percentage Composition and number of individuals in bracket of Fishes along Buguma creek
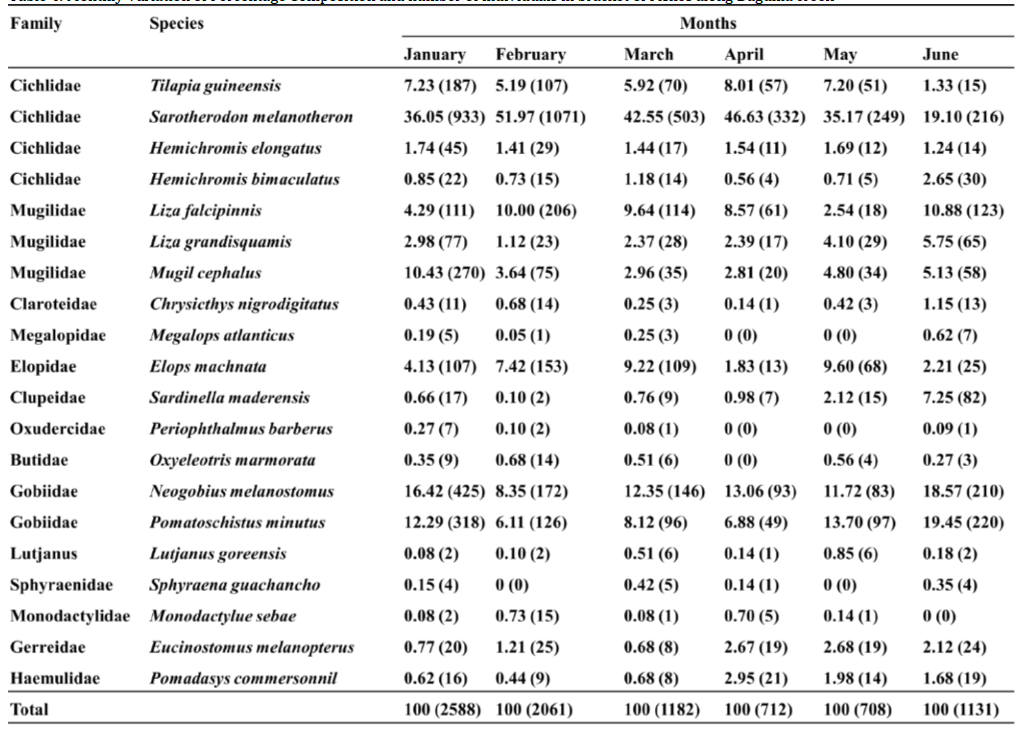
Table 5: Number of Individual, Percentage Composition and Abundance Scale of Pooled Data during a Six Month (January-June 2020) Sampling Period along Buguma creek
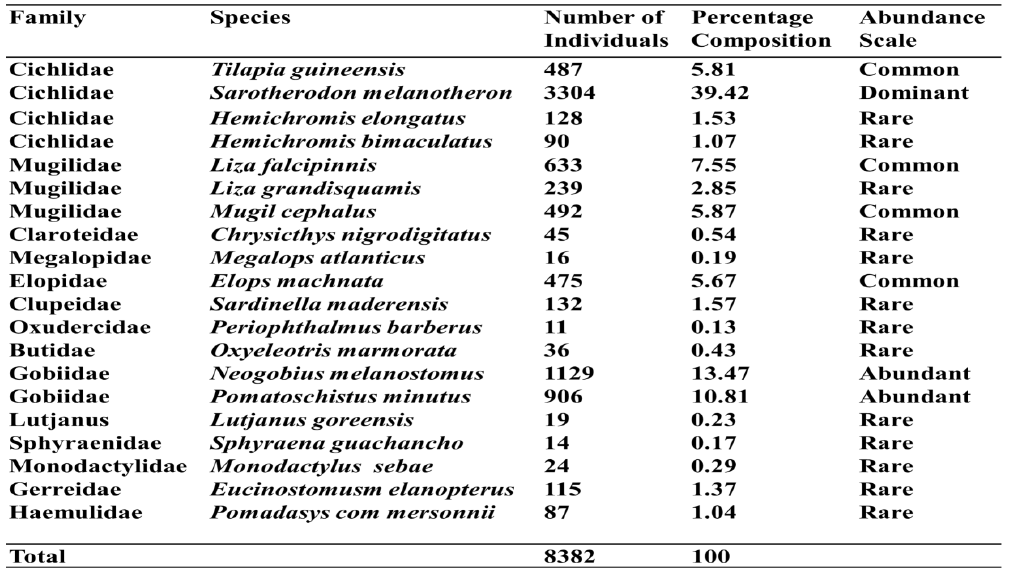
Table 6 Summary of Spatial Species Taxa and Diversity Indices of Fishes during Six Months Sampling Period
Figure 2: (A) Dendrogram with Euclidean distances showing similarities in fish composition between stations; (B)Saturation curves (with 95% confidence intervals after 9,999 bootstraps and (C) Diversity profiles (95% confidence, after 9,999 bootstraps), for the community diversity of fish in the three stations during the study period.
S. melanotheron, while the specie P. barberus recorded the lowest number of specie (11) and percentage composition (0.13%). On the abundance scale, only one specie S. melanotheron, was classified as dominant, two species; N. melanostomus and P. minutus as abundant, while four species namelyT. guineensis, L. falcipinnis, M. cephalus and E. machnata were classified as common while the remaining 13 species were classified as rare Table 5.
Summary of Species Taxa and Diversity Indices of Fishes during Six Months Sampling Period
The summary of spatial species taxa and diversity indices of fishes during six months sampling period in the three stations are presented in Table 6. From the results the total number of fish sampled in descending order were 7341 (station 2) >683 (station 1) >358 (station 3). Values of the diversity indices at the three stations were: Shannon-Weiner index, H’ (S1 = 2.44; S2 = 1.94 and S3 = 2.50); Pielou's index of evenness J, (S1 = 0.83; S2 = 0.65 and S3 = 0.85); Simpson's Diversity index D, (S1 = 0.88; S2 = 0.77 and S3 = 0.89); Margalef Species Richness index, M, (S1 = 2.76; S2 = 2.13 and S3 = 3.06); Menhinick Species richness Index, d (S1 = 0.73; S2 = 0.23 and S3 = 1.00).
The dendrogram with Euclidean distances showed that only station 2 was considerably different from stations 1and 3 Figure 2A. However, our bootstrapping procedure showed that all the stations were similar, with its saturation curve reaching a plateau phase and converged Figure 2B. Likewise, diversity profiles showed a relative similarity across sampling stations in relation to the alpha values Figure. 2C.
Physico-Chemical Parameters in the Study Area
The values of the physico-chemical parameters measured within the stations were similar. Values were within the range previously reported in Buguma creek [3] and within the acceptable limits for fish production in the brackish water environment [17].
Species Composition and Abundance
The species composition (20 species) recorded in present study were lower than those reported earlier (34 species) in the same creek [3,4]. Acording [29,30] lower number of fish species over time in a particular waterbody can be attributed it to extinction, pollution, overfishing and anthropogenic activities,which might be the case of the present study. Also, some of the species recorded in the present study were not found in the study of Oribhabor 10-12 years ago [3,4] and vise visa. According to Abowei, [31], fishes inhabiting lagoon environments and estuaries, especially if close to the channels of communication with the ocean, are usually heterogeneous and unstable. It is likely that the same instability could characterize Buguma creek fish communities as well.
The Creek was found to be inhabited by three types of fish, brackish water, fresh water and marine species. It appears that some fresh water fishes moved into the Creek. These include Chrysichthys nigrodigitatus. These fishes exhibited tolerance of the brackish water and are probably euryhaline in nature. The typically brackish water fishes at the Creek included Sarotherodon melanotheron and Tilapia guineensis, Edoghotu [32] noted that some of these species are probably stenohaline fishes and may have moved only within narrow limits of salinity changes. Edoghotu [32] also noted that species living the estuary comes from three sources which include: the freshwater stenohaline species which enter the zone during the flood, marine stenohaline species which enter inland at dry season and the euryhaline species of marine origin which live within the zone permanently. Edoghotu [32] listed the euryhaline fishes of marine origin to include the families: cichlidae, clupeidae, mugilidae, lutjanidae, and carangidae. All these families were found in the study area. The occurrence of both fresh water and marine fishes at the creek was probably due to wide variations in salinity. Some of the marine species could move long distances in the creek. This probably accounts for the presence of such marine fishes as Sphyraena guachancho and Lutjanus goreensis, a typical marine species, they could have move into the creek during flood tide. This is consistent with the report of Moses [33], who noted that during flood, some fish species could move to another aquatic habitat with different characteristics.
The most abundant species in the present study was S. melanotheron which was different from those reported earlier [4]. Previously S. melanotheron was one fewest speciesrepresenting 0.69% (n = 8) of the total fish species composition (N = 1149) of the creek. In the present study, S. melanotheron represented 39.42% (n=3304) of the total fish population (N = 8382), the result is in line with Amachree and Arimieari [27] and Yoboue, who reported S. melanotheron as the most abundant species. This might be as a result of the species been able to thrive in polluted areas. As recorded early, Buguma creek is associated with several activities such as sand mining, dredging, oil trading, waste disposal and artisanal oil refineries. These activities can affect the overall health of the creek. Yoboue in their study on genetic ecotoxicology of S. melanotheron, reported that the species S. melanotheron can survive and be maintained in areas high in environmental stressors especially polychlorinated biphenyls (PCBs) and Polybrominated diphenyl ethers (PBDEs)
Spatial and Monthly Variations in Fish Community Composition
In this study, data on spatial and monthly variations in fish compositions were within the same range in the different stations. This may be affected by several factors, such as fishing gears that were deployed to capture fishes [34]. Despite the above-mentioned considerations, the slight differences between station 2 and the other two sampling stations can be explained by other factors such as changes in the bottom of the area due to desilting. According to Laë [35], habitat greatly influences biotic interactions and several vital functions such as reproduction, feeding and shelter. Station 2 has much more abundant aquatic vegetation than the other stations, hence its habitat should be much more heterogeneous which might consequently reduce interspecific competition and contribute to a higher diversity of species.
Observations from this study indicated that the majority of marine species such as Lutjanus goreensis, Megalops atlanticusand Sphyraenagu achancho occurred mostly during the dry season. The dry season (January-March) was typically the period of the highest fish abundance, highest catches, highest species richness and species composition. The present study showed that a large number of marine species are migrating to the creek because of the elevated levels of salinity. This result agrees with the findings of Emmanuel and Osibona [36] who reported that dry season as the period of the highest fish abundance and species richness in Lekki Lagoon.
Like other brackish-water species, some of the species found occurring throughout the year in the Lagos Lagoon reported by Fagade and Olaniyan [37] were also reported in this study. These species include, Sarotherodon melanotheron, Tilapia guineensis, Hemichromis fasciatus, and Elops lacerta which were able to tolerate variations in salinity and other physical features. Due to the relationship between the sea and inland waters, the creek is characterized by environmental unpredictability. The creek supported a high diversity of fish species of fresh, brackish and marine water origins. The fish species must have had ability to adapt and cope with the variable conditions (salinity and temperature) of the lagoon. The interaction between fish and its habitat (physical as well as biological characteristics) might be factors in predicting changes in overall abundance, breeding population size and other aspects of population structure [38]. In all the stations, the catches were dominated by Sarotherodon melanotheron individuals; all of these dominant species were herbivores, thus confirming that herbivore species tend to dominate West African assemblages of fishes [39].
The most diverse fish families in the study area were Cichlidae (four species), Mugilidae (three species) and Gobiidae (two species). While the other families were each represented by one species. The absence of Sciaenidae an important brackish water species [33] in the catch might be explained by the low salinity of the creek water during the study period, according to Lévêque and Paugy, there is no Sciaenidae in waters with low salinity.
Summary of Species Taxa and Diversity Indices of Fishes during Six Months Sampling Period
For all diversity indices measured Station 3 recorded highest values followed by station 1 then station 2. Values at the three stations were: Shannon-Weiner index, H’ (S1 = 2.44; S2 =1.94 and S3 = 2.50); Pielou's index of evenness J, (S1 = 0.83; S2 = 0.65 and S3 = 0.85); Simpson's Diversity index D, (S1= 0.88; S2 = 0.77 and S3 = 0.89); Margalef Species Richness index, M, (S1 = 2.76; S2 = 2.13 and S3 = 3.06); Menhinick Species richness Index, d (S1 = 0.73; S2 = 0.23 and S3 = 1.00). The dendrogram and diversity profiles showed that station 2 was different from stations 1and 3. However, the bootstrapping and diversity profiles showed that all the stations were similar. The species richness may be attributed to the fact that Buguma creek is linked to Atlantic Ocean through New Calabar River estuary, hence the presence of some intrusive species [18].
In conclusion, Buguma creek showed species diversity with twenty (20) finfish species (belonging to 14 families out of which 11 were mono-specific). Sarotherodon melanotheron was recorded as the dominate species accounting for 39.42% (3304 individuals) of the total fish stock.In terms of bio-monitoring, the abundance of S. melanotheron might be an indication of presence of environmental stressors.
Alex, N. Forn et al. "Length-Weight Relationship and Condition Factor of Tilapia Species Grown in Marine and Fresh Water Ponds." Agriculture and Biology Journal of North America, vol. 4, no. 1, 2012, pp. 117–124.
Olusola, O.K., and G.O.A. Arawomo. "Preliminary Observations on Fish Species in a Newly Impounded Osinmo Reservoir." Turkish Journal of Fisheries and Aquatic Science, vol. 8, 2008, pp. 289–292.
Oribhabor, B.J., and A.E. Ogbeibu. "The Ecological Impact of Anthropogenic Activities on the Predatory Fish Assemblage of a Tidal Creek in the Niger Delta, Nigeria." Research Journal of Environmental Sciences, vol. 4, no. 3, 2010, pp. 271–279.
Oribhabor, B.J., and A.E. Ogbeibu. "The Food and Feeding Habits of Fish Species Assemblage in the Niger Delta, Mangrove Creek, Nigeria." Journal of Fisheries and Aquatic Sciences, vol. 7, no. 2, 2012, pp. 134–149.
Lawson, O.E., and M.O. Olusanya. "Fish Diversity in Three Tributaries of River Ore, South-West, Nigeria." Journal of Fish Science, vol. 2, no. 6, 2010, pp. 524–531.
Balogun, J.K. Basic Fisheries Biology and Management for Tertiary Institutions. Ayo-Sule (NIG) Printers & Publishers, 2006, pp. 3–33.
Odusanya, A.S. Fisheries Livelihood in Ogun State. Seminar Report, Department of Aquaculture and Fisheries Management, University of Agriculture Abeokuta, 2008.
Jalal, K.C.A. Forn et al. "Diversity and Distribution of Fishes in Tropical Estuary Kuantan, Pahang, Malaysia." Pakistan Journal of Biological Sciences, vol. 15, 2012, pp. 576–582.
Growns, I. "The Influence of Change to Freshwater Fish in Regulated Rivers of the Murray-Darling Basin." Hydrobiologia, vol. 596, no. 1, 2008, pp. 203–211.
Yoboué, A.N. Forn et al. "Diversité et Structure Génétique de Sarotherodon melanotheron (Pisces: Cichlidae) Révélées par les Microsatellites." European Scientific Journal, vol. 10, 2014, pp. 299–311.
Fischer, J.R., and M.C. Quist. "Characterizing Lentic Freshwater Fish Assemblage Using Multiple Sampling Methods." Environmental Monitoring and Assessment, vol. 186, no. 7, 2014, pp. 4461–4474.
Mira, G.S. Forn et al. The Diversity of Fishes. Blackwell Science, 2008.
Linde-Arias, A.R. Forn et al. "Multibiomarker Approach in Fish to Assess the Impact of Pollution in a Large Brazilian River, Paraiba do Sul." Environmental Pollution, vol. 156, 2008, pp. 974–979.
Carppo, M., and I.W. Brown. Evaluating of Sampling Methods for Reef Fish Populations of Commercial and Recreational Interest. Technical Report No.6, CRC Reef Research Centre Ltd., 1996.
Allison, M.E. Forn et al. "The Fish Assemblage of Elechi Creek, Rivers State, Nigeria." Niger Delta Biological Science Journal, vol. 2, 1997, pp. 53–61.
Fafioye, O.O., and O.A. Oluajo. "Length-Weight Relationship of Five Fish Species in Epe Lagoon, Nigeria." African Journal of Agricultural Research, vol. 4, 2005, pp. 42–46.
FAO. FAO Yearbook of Fishery Statistics. FAO, 1990, pp. 1–70.
Lévêque, C.O. Forn et al. The Fresh and Brackish Water Fishes of West Africa. vol. 1, Musée Royal de l’Afrique Centrale, 1991.
Lévêque, C.O. Forn et al. The Fresh and Brackish Water Fishes of West Africa. vol. 2, Musée Royal de l’Afrique Centrale, 1992.
Olaosebikan, B.D., and A. Raji. Field Guide to Nigeria Freshwater Fishes. Federal College of Freshwater Fisheries Technology, 1998.
Idodo-Umeh, G. Freshwater Fishes of Nigeria: Taxonomy, Ecological Notes, Diet and Utilization. Idodo Umeh Publishers, 2003.
Shannon, C.E., and W. Wiener. The Mathematical Theory of Communication. University of Illinois Press, 1949.
Simpson, F.H. "Measurement of Diversity." Nature, vol. 163, 1949, p. 688. https://doi.org/10.1038/163688a0.
Margalef, R. "Temporal Succession and Spatial Heterogeneity in Phytoplankton." Perspectives in Marine Biology, edited by Buzzati-Traverso, University of California Press, 1958, pp. 323–347.
Pielou, E.C. "The Measurement of Diversity in Different Types of Biological Collections." Journal of Theoretical Biology, vol. 13, 1966, pp. 131–144.
Menhinick, E.F. "A Comparison of Some Species-Individuals Diversity Indices Applied to Samples of Field Insects." Ecology, vol. 45, 1964, pp. 859–861.
Amachree, D., and S.B. Arimieari. "Landed Fish Composition Along the Lower Reaches of Aleto (Oku’lu) Creek, Eleme Local Government Area, Rivers State, Nigeria." Delta Agriculturist, vol. 13, no. 2, 2021, pp. 133–144.
Ezekiel, E.N. Comparative Studies of the Floodplains and Major Rivers in Odiokwu–Ekpeye, Riverstate, Nigeria. M.Sc. Thesis, University of Port Harcourt, 2002.
Akani, G.C. Forn et al. "Aspects of Community Ecology of Reptiles in the Swamp Forests of the Upper Orashi Forest Reserve (Niger Delta, Nigeria)." African Journal of Ecology, vol. 53, no. 3, 2014, pp. 278–286.
Nwadiaro, C.S. "The Longitudinal Distribution of Macro-Invertebrate and Fish in Lower Niger Delta (Sombreiro River), Nigeria." Hydrobiology Bulletin, vol. 18, 1984, pp. 133–140.
Abowei, J.F.N. Aspects of the Fisheries of the Lower Nun River. Ph.D. Thesis, Rivers State University of Science and Technology, 2000.
Edoghotu, J.A. Fishes and Fishers of Kugbo Creek. Ph.D. Thesis, University of Port Harcourt, 2015.
Moses, B.S. Introduction to Tropical Fisheries. Ibadan University Press, 1992. —. Niger Delta Environmental Survey (NDES): Environmental and Socioeconomic Characteristics. vol. 1, NDES Press, 1998, p. 658.
Ekpo, I.E., and J.P. Udoh. "Species Richness and Diversity of Ichthyofaunal Communities of the Lower Cross River Flood Plain Nigeria." International Research Journal of Environment Sciences, vol. 2, no. 7, 2013, pp. 5–14.
Laë, R. "Climatic and Anthropogenic Effects on Fish Diversity and Fish Yields in the Central Delta of the Niger River." Aquatic Living Resources, vol. 8, 1995, pp. 43–58.
Emmanuel, B.E., and A.O. Osibona. "Ichthyofauna Characteristics of a Tropical Low Brackish Open Lagoon in South-Western Nigeria." International Journal of Fisheries and Aquaculture, vol. 5, no. 6, 2013, pp. 122–135.
Fagade, S.O., and C.I.O. Olaniyan. "Seasonal Distribution of the Fish Fauna of the Lagos Lagoon." Bulletin de l'I.F.A.N.T., ser. A, vol. 36, no. 1, 1974, pp. 244–252.
Koutrakis, E.T. Forn et al. "Seasonal Changes in Distribution and Abundance of the Fish Fauna in the Two Estuarine Systems of Strymonikos Gulf (Macedonia, Greece)." Belgian Journal of Zoology, vol. 130, no. 1, 2000, pp. 43–50.
Amadi, N. Forn et al. "Freshwater Fishes of Lower Guinean Forest Streams: Aquaculture Heavily Impacts the Structure and Diversity of Communities." Acta Oecologica, vol. 94, 2019, pp. 66–102.
