+91 6002993949
submission@iarconsortium.org
Open Access
ISSN (Print) : 2708-5090
ISSN (Online) : 2708-5104
A survey to determine the ecological character focusing on the condition and vegetation structure of the dambo wetland eco-system in the upper sub-catchment of the Chongwe River, central Zambia was carried out focusing on five dambos and associated forests in Kanakantapa area. Line intercept method was used to evaluate herbaceous cover which also included shrubs and forbs, while woody plants were assessed using Point Centred Quadrat (PCQ) method and species importance values. Results of the study showed that dambos were largely dominated by Loudentia simplex (Nees) Hubbard (30.5%), Digitaria milanjiana (Rendle) Stapf (21.7%), Setaria ciliolata (26%) and Setaria anceps Stapf ex Massey (20.0%). Important woody plant species were Julbernardia globiflora (97.56 IV), Monotes katangensis (66.91 IV), Julbernardia panniculata Tropin (57.33) Acacia sieberana DC. (52.39 IV), Pseudolachnostylis maprouneifolia (40.72IV), Brachystegia boehmii (35.99 IV) Albizia antunesiana (33.43 IV). All dambos studied showed shrub encroachment with relatively high number of shrub species in Kanakantapa and Mwiinde dambos ecosystems. Highest shrub canopy cover was observed in Kanakantapa dambo. It was concluded that dambos were largely at high risk of degradation due to mainly siltation influenced by deforestation, overgrazing and shrub encroachment. Further research is required to guide sustainable land use and future plans of possible catchment management as well as determining hydrological implication and possible ways of conservation of dambos.
Dambos are classified as palustrine wetlands but their definition has varied considerably, carrying different names varying with regions and local languages [1]. One of the critical arguments in discussing dambos has been the limited understanding of the linkage between ground and surface water, topography and underlying geology in a small headwater drainage, and that the role of vegetation on the character and life of a dambo has not been vigorously pursued. However, Mackel [2] seem to provide definition that is fairly comprehensive that “dambos are seasonally water logged, permanently grass covered, shallow, linear depressions in the head ward zone of rivers”. While this has brought in some elements of geomorphological, hydrological and ecological aspects of land forms [1,3,4], considered the definition to be over simplified. Nevertheless, in this study we define dambos as palustrine wetlands and while Wetlands are lands transitional between terrestrial and aquatic systems where the water table is usually at or near the surface or the land is covered by shallow water, a palustrine wetland system is a class of a wetland ecosystem recognized as marshes, swamps, bogs, springs and ponds or pans and characterized mainly by dominance of trees, shrubs persistent emergent macrophytes, and emergent mosses or lichens. In Zambia Chabwela et al. [5] documented that about 14.0% or 105 million hectares of the country is covered by dambos, making it an important ecosystem for the conservation of biodiversity and supporting socio-economic development.
Dambos are among the most productive ecosystems as they play a very significant role in acting as storage reservoirs, absorbing water during the rainy season and giving it up slowly during the dry season [6], and furthermore, wetlands provide numerous other ecosystem functions including river basins flood attenuation, water discharge as well as being an important in stream water purification. Since Zambia is predominantly rural, much of the economy is subsistence and fairly sustained by wetlands. The bulk of dry season agriculture as well as livestock grazing depend on wetland ecosystems. However, dambos are increasingly threatened with expanding human population and growing and competing demands for their resources. Overgrazing and excessive deforestation are singled out as among the main factors exacerbating dambo degradation and wide spread gully formation.
The main objective of this study therefore, was to determine the dambo wetland ecological character focusing on the condition and vegetation structure. The study was carried out during the growing season (January – March) in Kanakantapa sub-catchment of the upper Chongwe Catchment. The choise of the study area was influenced by the area’s proximity to Lusaka the capital and largest city of Zambia and which has experienced increasing human population in recent years. The study was guided by two compelling research questions of which the first question centered on what would be the vegetation structure of a head water dambo located at a river source, considering that Zambia was predominately a plateau country and largely a source of many rivers. The second question related to the condition of dambos because of the impending potential for land degradation, resulting from excessive deforestation and rapidly expanding agricultural activities. We approached this assessment using vegetation as an ecological indicator. This method has been widely used and quite appropriate in wetland ecosystem ecological investigations [7,8]. Plants are excellent ecological indicators of wetland condition for many reasons including their relatively high levels of species richness, rapid growth rates, and direct response to environmental change. Since plants are primarily immobile, they reflect the temporal, spatial, chemical, physical, and even biological dynamics of a system, they can indicate any long-term, chronic stress they can undergo.
The assumptions and predictions in this study were: (i) the abundance of emergent aquatic macrophytes would indicate high ground water discharge of long duration and that the dambo was in good condition, (ii) high presence of litter would signify heavy grazing and heavy anthropogenic disturbance, (iii) large presence of shrub or forbs would mean that the dambos is in poor condition and that water sources were limited, and (iv) the high presence of sedges signify long period of precipitation and ground and base flow discharge and that the dambos were in healthy condition.
Location and Description of the Study Area: Location
The Chongwe River catchment is located between latitude 14°55’40” to 15°43’19” S and longitude 28°13’53” to 29°21’24” E as shown in Figure 1 and 2 below. The catchment covers parts of Lusaka, Chongwe, Chibombo, Chisamba, and Kafue Districts of Lusaka and Central provinces. It also covers 45% of Lusaka Metropolitan City which is why this area was chosen for the study.
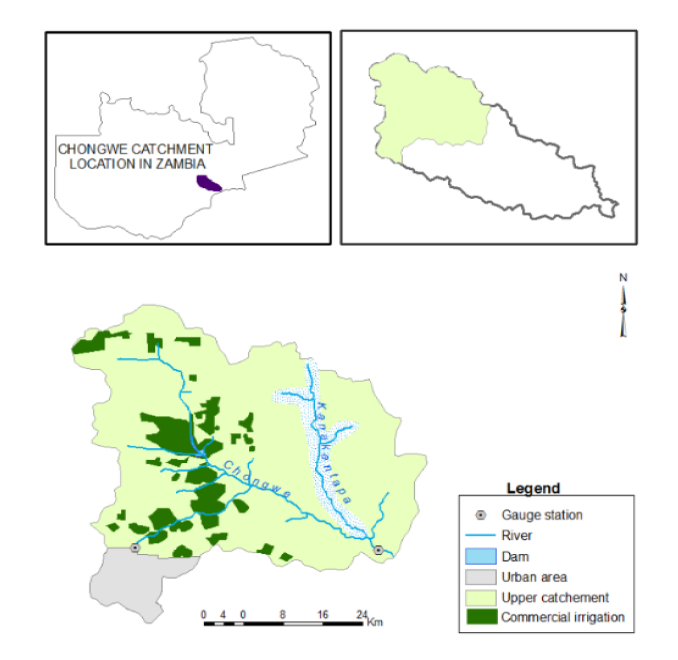
Figure 1: Location of Kanakantapa sub- catchment on the Chongwe River Catchment

Figure 2: Kanakantapa Dambo Systems and the Location of the Study Sites Above
Source: Adapted from [9]
Study Area Description
Climate
The climate in Zambia has three distinct seasons; (i) the wet season which extends from November to March, (ii) the cool dry season from April to August, and (iii) the hot, dry season extending from September to October [10].
The climate of Chongwe River catchment is described as humid subtropical, with dry winters and hot summers. The warmer wet season starts in mid-September and extends through May. Precipitation peaks high in December and January at around 232 mm/month. The colder dry season is from June through August with little or no precipitation and long dry spells (Table 1).
Geology and Soils
A comprehensive review of the geology of Chongwe Catchment has been well documented by Baumle et al. [11] and Nick, [12], which shows that the Kanakantapa study area is covered by lithologies of schists, quartzites and basement complex rocks (mainly gneiss and granite). Typically, the two major formations reveal the Chongwe catchment as having cheta schists and carbonates on the South – west of the catchments while the North-eastern is underlain by the basement complex with Muva quartzites and Schists [11-12].
With regard to soils, the detailed and well documented studies on soils in Zambia have been provided by Webster [13-15] and discussions by Baumle et al. [11] state three types of soils that occur in Chongwe river catchment, among them are vertisols. These soils are generally hydromorphic heavy clays with high content of organic matter. They occur in the poorly drained unconsolidated deposits areas.
The shallow leptosols occur in the hilly parts of Kanakantapa sub-catchment, while lixisols miombo soils cover much of the study area. Miombo soils are generally described as sandy, silicaceous and heavily leached [15].
Drainage and Hydrology
The Chongwe catchment is part of the middle Zambezi catchment and covers a total area of 5,150km2 [16]. The catchment is drained by six sub-catchments (Table 2), and the main sources of water in this catchment are typically precipitation, surface run off, subsurface and ground discharge. Based on water evaluation and planning report, [16] annual base flow of Chongwe catchment indicated 205.57m3 with minimum base flow of 54.76m3 in March and the minimum base flow volume of 0.77m3 occurs in October.
Vegetation and Land Use
The vegetation in Chongwe catchment area is predominantly miombo woodland dominated by the genus Brachystegia. This vegetation type has been studied and extensively documented elsewhere in Zambia [17-18,15]. Studies show that Zambia has a total of seven major vegetation types, however, the general vegetation of Chongwe catchment appear to be defined according to the topographic features as follows:
The miombo vegetation covers almost the entire Chongwe catchment. This includes escarpment and the plateau miombo. In general, miombo is characterized by the wide dominance of species in the genera Brachystegia and Julbernardia such as the B. spiciformis, B. bussei and B boehmii, and both Julbernardia paniculata a J. globiflora as co-dominants. Nevertheless, some of the key important plant species in this vegetation type include Albizia antunesiana, Pericopsis angolensis, Afzelia quanzensis, Combretum mechowiananum, Erythrophleum africana, Sclerocarya caffra and Terminalia sericea. The under storey is characterised by species such as Combretum ghasalense, Diplorhnchus condylocarpon, Markhamia obtusifolia, Piliostigma thonningii, Ziziphus mucronata, Pseudolachnostylis maprouneifolia and Syzygium guineense.
The lower Chongwe catchment on the tributary with Zambezi River is characterized by the dominance of Colophospermum mopane, Acacia tortilis, and Lonchocarpus capassa in association with Combretum thickets. Other co-dominant species include Ximenia, americana, Combretum obovatum, Euphorbia sp, Balanites aegytiaca, Commiphora spp. and Capparis tomentosa.
With respect to human population, an estimated number of 834,359 people were recorded to live in Chongwe River Catchment with about 45% of Lusaka City being within the Chongwe River Catchment [16]. Most of the people in the catchment depend on the Chongwe River and its main tributaries for their domestic, agriculture, industrial and socio-economic water needs [16]. However, Kanakantapa area is predominantly rural, and the land is under the traditional tenure system. The main land use activities in this area includes livestock grazing, subsistence agriculture, settlements, and forest conservation [16].
Table 1: Average Monthly Climate Values of Chongwe River Catchment 1965 – 2017
Months | Oct. | Nov. | Dec. | Jan. | Feb. | Mar | Apr. | May | Jun. | Jul. | Aug. | Sep |
Average perspiration (mm) | 18 | 98 | 212 | 232 | 201 | 9.3 | 2.8 | 5.0 | 0 | 0 | 0 | 2.0 |
Average air temperature (oC) | 17.8 | 17.7 | 16.6 | 14.6 | 11.4 | 8.7 | 8.2 | 10.3 | 14.1 | 17.4 | 18.2 | 18.0 |
Average RH (%) | 39.34 | 52.4 | 73.4 | 83.71 | 85.7 | 82.45 | 80.14 | 69.17 | 63.91 | 58.05 | 48.1 | 39.77 |
Average wind Speed (m/s) | 39.34 | 52.4 | 73.4 | 83.71 | 85.7 | 82.4 | 80.14 | 69.17 | 63.91 | 58.05 | 48.1 | 39.77 |
Cloudiness fraction | 0.5 | 0.3 | 0.1 | 0.1 | 0.1 | 0.3 | 0.4 | 0.4 | 0.9 | 1.01 | 1 | 0.7 |
Sourrce: Tewodos et al.
Table 2: Sub-catchments of Chongwe River Catchment and dominant land use pattern based on Tena et al, [16].
Sub-catchment | Area (Km2) | Dominant Land Use Pattern |
Upper Congwe | 1236 | Agriculture, Ranch (livestock production), irrigation |
Ngwere | 300 | Build-Up, Agriculture, Irrigation, Ranch, (Livestock Production) |
Kanakantapa | 485 | Agriculture, Forest and Settlement |
Middle Chongwe-Luimba | 1342 | Agriculture, Forest, Ranch (livestock production) |
Chalimbana | 674 | Agriculture, Build-Up, Forest, Irrigation |
Lower Chongwe | 1131 | Forest, Agriculture, Ranch (livestock production) |
Data Collection and Analysis
Sampling Design: Detailed vegetation studies were conducted during the peak growing season from January to March when most plants were in flower or fruit to optimize species identification and for characterization of species abundance. During the surveys we used maps of 1:250,000 and 1:50,000 to design the surveys and to carry out verification. Plant species identification was achieved by the use of field guide books and field manuals [20-22]. Samples of plants that were difficult to identify in the field were collected following standard herbarium procedures and taken to the herbarium at the University of Zambia for easy of identification.
Five dambos were selected as sample sites for this study and these were Katuba, Mpelekese, Mwiinde, Chamapepe and Kamwale. In addition, five distinct forests stands were also selected for assessment of woody plants and these were, Kanakantapa, Mwiinde, Katuba, Mperekese, and Chipilepile Forest Stands for woody structure assessment.
Sampling Herbaceous Plant Cover and Plant Composition
We used the Line-point intercept method for quantifying soil cover, including vegetation, litter, Bare ground, shrub, small tree. This required the use of Step-point of pace transect with a wire loop of 0.5cm diameter. Four transects of 100m long were positioned at 30m apart in each sample site and a total of 400 points were established on each transect in each dambo site. Basal cover was measured at every meter point using the wire loop of 0.5cm diameter, and if the base of the plant fell inside the loop, a hit at that point was recorded either as grass, forb, or shrub, otherwise the hit was recorded as bare ground, rock, or litter (dead plant material or faecal matter). Hits were expressed as a percentage of the total number of hits of each transect [23].
Measurement of Shrub Canopy Cover
To measure canopy cover of shrubs, cover in the dambos, we used the variable plot method [24-26]. Two transects were established at 100m apart in each dambo and a total of 60 count stations were done.
Woody Plants Assessment
For the purpose determining species composition and Importance Values, we measured basal area, the density, and dominance of each plant species to calculate the Importance Value. In general, importance values are a measure of how dominant a species was in each forest area. We sampled five sites in the woodland vegetation: Chipilepile protected forest, Katuba woodland, Mwiinde woodland, Mperekese woodland and Kanakantapa woodland. Woody vegetation structure was measured using the Point-Centred Quarter Method [27-29]. We laid transects in the North-South direction. The method involved establishing plots at 30-meter intervals along a compass line in each forest. A total of 30 stations in each sample area were established and diameter at breast height (DBH) of trees occurring in each plot was taken by using a cruising stick and a measuring tape.
Data Analysis
We defined dambo wetland condition as the ‘state’ of the wetland stability and sustainability of the vegetation structure supported by adequate and continuous supply of water while exhibiting wetland values as well as effectively carrying out and maintaining wetlands functions which include the stability and sustainability of the ecosystem to withstand environmental stress and the capacity of the ecosystem to support a diverse community of organisms and perform functions compared to that of a local unimpaired site.
Because dambo wetlands are important for agriculture and livestock grazing, we defined dambo condition indicators based on the approved classification by the Society of Rangeland Management [30]:
Bare ground (bare or bare soil): All land surface not covered by vegetation, rock, or litter as used in this document, visible biological crusts and standing dead vegetation are included in cover estimates or measurements and therefore are not bare ground (e.g., mineral soil)
Litter the uppermost layer of organic debris on the soil surface, essentially the freshly fallen or slightly decomposed vegetal material. In this study, it includes animal faecal matter
Grass: Members of the plant family Poaceae (Gramineae) standing as annual or perennial
Shrub: A plant that has persistent, woody stems and a relatively low growth habit, and that generally produces several basal shoots instead of a single bole. It differs from a tree by its low stature (generally less than 5 meters, or 16 feet) and non-arborescent form
Forb Herbaceous plant, usually with broad net-veined leaves. In general, any herbaceous plant other than those in the grass, sedge or brush families
Sedge -Any of numerous grass like plants of the family Cyperaceae, characteristically having solid three-sided stems, leaves arranged in three rows, and spikelets of inconspicuous flowers
Data analysis for the woody vegetation was based on the methods by Mueller-Dombois and Ellenberg [27], Mitchel [28] as follows:
Relative Dominance = Dominance of a species
_______________________
Total dominance of all species X 100
Relative Density = Number of individuals of a species
_________________________
Total number of individuals (all species) X 100
Relative Frequency = Frequency of a species
_________________________
Sum frequency of all species X 100
Importance Value = Relative Density + Relative Dominance + Relative frequency
Detailed analysis of forest structure included, stand diameter distribution, species relative dominance density, species basal area, species relative density, species relative frequency and the species Importance Value.
A total of 76 plant species was identified and quantified in our study sites, and the list of these plant species is given in Table 3. These included 48 woody species, 18 grass species and 10 species forbs and sedges.
Dambo Condition
The results based on percent occurrence of functional and indicator groups of the dambos as assessed in this study are summarized in Figure 3. Nearly all dambos showed high proportion of grass cover with highest occurring in Mperekese dambo (62%) followed by Kamwale dambo (54%) and Chamapepe dambo (49%). Mwiinde dambo recorded relatively low grass cover (25.5%). Litter accumulation in five dambos was revealed more litter in Mwinde dambo (42.5%) while in Kanakantapa (20%) and Chamapepe (19.0%) dambos gave similar results. The lowest litter accumulations were recorded in Kamwale (11.5%) and Mperekese (8%) dambos. Although bare ground was shown to be comparatively high in Mwiinde (21.7%) and Mperekese (19.5%) dambos, in general dambos indicated soil exposure to be relatively similar (Figure 3). The presence of sedge was for the most part relatively the same (8%) in four dambos although Mwiinde dambo recorded very low values (3%). The occurrence of forbs was highest in Kamwale dambo (18%) followed by Kanakantapa dambo (15%), and the other three dambos gave very low (Figure 3).
Dambo species Macrophytes and Functional Group Indicators
Dambo condition class was determined by using bare, litter, sedge, forb, grass spp., as ecological indicators of the five dambo ecosystems as shown in Table 3 below.
Chamapepe Dambo
In Chamapepe dambo the the most dominant grass species was Loudentia simplex (Nees) Hu (20.5%) followed by Digitaria milanjiana (Rendal) Stapt (14.5%), and the least was Eragrostis superba Peyr (7.0%). Sedge had low frequency (8.0%) as well as Forb (7.5%). Litter was (19.0%) and bare was (15.5%).
Mperekese Dambo
In this dambo dominant grass species were, Loundentia simplex (Nees) Hubbard (30% and Digitaria milanjiana (Rendle Stepf (14.5%). Forbs (3.0%) and Sedge plant groups (6.5%) which were low values. Bare ground had (19.5%), while litter accumulation had (8.0%).
Kamwale Dambo
The most common grass plant species in order of importance were, Digitaria milanjiana (Reddle) Stapf (33.0%) Loudentia simplex (Nees) Hubbard (14. %) and Eragrostis superba Peyr (9.0%) but other species present with lower values included Oryza barthii A chev (1.0%), Aristida adscensionis L (0.5%) and Panicum maximum Jacq (0.5%). The sedge group accounted for 5.0% while forbs occurrence was high at (18%). Both litter accumulation (11.5) and bare ground (11.5%) showed similar values.
Kanakntapa Dambo
In this dambo the dominant species of grass were Setania ciliolata Stepf and Hubbard (26.0%) Digitiria milanjiana (Reddle) Stapf (21.7%), and Seteria anceps (Stepf ex massey) (20.0%), while the sedge group had (8.3%), and litter (20%) with bare ground recording (18%).
Mwiinde Dambo
In general, this dambo gave low values of grass cover, and as shown in Figure 8, both litter (42.46%) and bare ground (33.94%) showed high proportion of occurrence. The results also revealed relatively fair values of Forb (6.32%) and Sedge (2.35%) while grass species were represented by Panicum maximum Jacq (7.3%) and Setaria anceps Stapt ex mssey (4.7%).
Dambo Canopy Cover
The results of canopy cover in five dambos are summarized in Table 4. A total of thirty (30) shrub and tree species were recorded as shown in Table 4, plants that showed canopy cover dominance included Syzygium guineense (willd) DC (12%), Afzelia quanzensis Welw (15%), Acacia sieberana DC (12%), Piliostigma thonningii (Shaum). Milne-Redh (26%) and Loncocarpus capassa Rolte (8%).
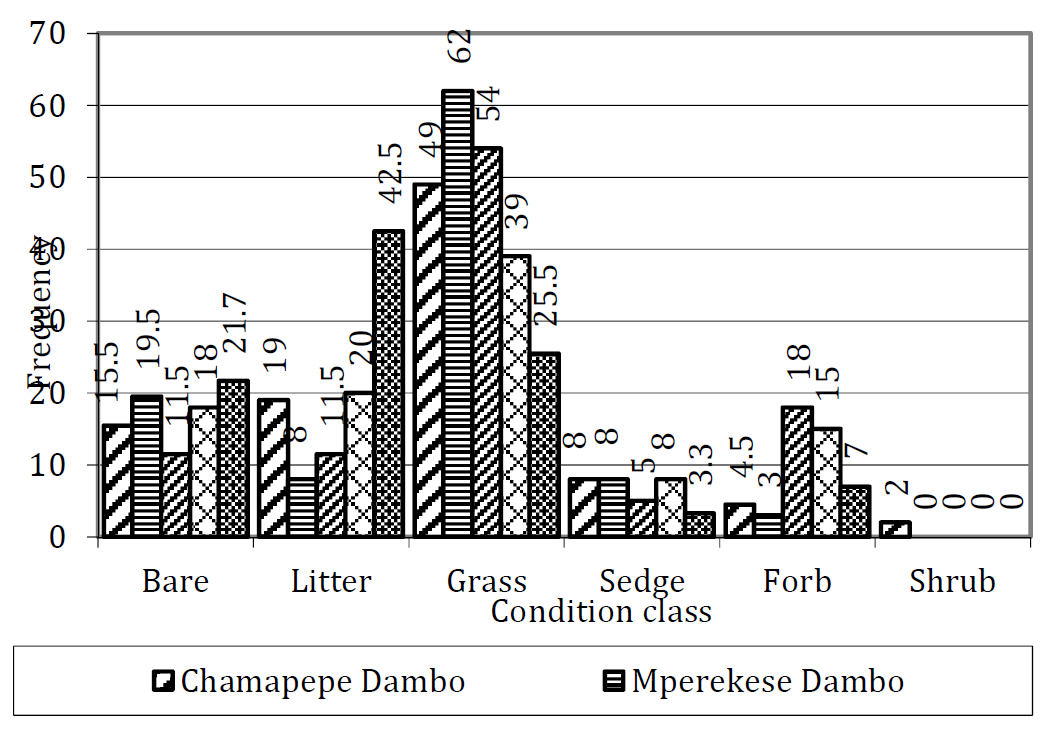
Figure 3: Functional Group Indicators of Dambo Condition in Five Dambos of Kanakantapa Dambos System
Table 3: Macrophytes as Functional Group Indicators of Dambo Ecosystem Condition
No | Dambo condition class (Bare, litter, sedge, forb, grass spp) | Percent (%) relative frequency |
Chamapepe Dambo | ||
1 | Bare | 15.50 |
2 | Chloris gayana Kunth | 1.50 |
3 | Sedge | 8.00 |
4 | Dactyloctenium aegyptium (L.) | 2.00 |
5 | Digitaria milanjiana (Rendle) Stapf | 9.05 |
6 | Eragrostis superba Peyr | 7.00 |
7 | Forb | 7.50 |
8 | Litter | 19.00 |
9 | Loudentia simplex (Nees) Hubbard | 20.50 |
10 | Panicum maximum Jacq. | 1.50 |
11 | Setaria anceps Stapf ex Massey | 1.50 |
12 | Setaria ciliolata Stapf and Hubbard | 5.05 |
13 | Shrub | 2.00 |
14 | Sporobolus pyramidalis Beauv. | 0.50 |
15 | Themeda triandra Forssk. | 0.50 |
Mperekese Dambo | ||
1 | Aristida adscensionis L | 2.00 |
2 | BARE | 19.50 |
3 | Brachiaria brizantha (Hochst.) Stapf | 0.50 |
4 | SEDGE | 6.50 |
5 | Digitaria milanjiana (Rendle) Stapf | 14.50 |
6 | FORB | 3.00 |
7 | Leersia hexandra Sw | 0.50 |
8 | LITTER | 8.00 |
9 | Loudentia simplex (Nees) Hubbard | 30.50 |
10 | Setaria anceps Stapf ex Massey | 4.00 |
11 | Setaria ciliolata Stapf and Hubbard | 1.00 |
12 | Sorghum verticilliflorum Landerss | 2.00 |
13 | Sporobolus pyramidalis Beauv | 8.00 |
Kamwale Dambo | ||
1 | Aristida adscensionis L | 0.500 |
2 | BARE | 11.50 |
3 | SEDGE | 5.00 |
4 | Digitaria milanjiana (Rendle) Stapf | 33.00 |
5 | Eragrostis superba Peyr | 9.00 |
6 | FORB | 18.00 |
7 | Leersia hexandra Sw | 0.50 |
8 | LITTER | 11.50 |
9 | Loudentia simplex (Nees) Hubbard | 14.00 |
10 | Oryza barthii A. Chev | 1.00 |
11 | Panicum maximum Jacq. | 0.50 |
Kanakntapa Dambo | ||
1 | Aristida adscensionis L | 1.00 |
2 | Bare | 18.00 |
3 | Sedge | 8.30 |
4 | Digitaria milanjiana (Rendle) Stapf | 21.66 |
5 | Echinochloa colona(L.) Link | 1.33 |
6 | Eragrostis ciliaris (All.) Lutati | 7.00 |
7 | Eragrostis superba Peyr | 9.66 |
8 | Litter | 20.00 |
9 | Microchloa indica (L.) Beauv | 3.00 |
10 | Forb | 18.00 |
11 | Setaria anceps Stapf ex Massey | 20.00 |
12 | Setaria ciliolata Stapf and Hubbard | 26.00 |
13 | Sorghum verticilliflorum L Anderss. | 5.50 |
Mwiinde Dambo | ||
1 | Eragrostis superba Peyr | 0.30 |
2 | Forb | 6.30 |
3 | Sedge | 2.33 |
4 | Leersia hexandra Sw | 1.00 |
5 | Litter | 42.46 |
6 | Microchloa indica (L.) Beauv. | 1.00 |
7 | Panicum maximum Jacq | 7.33 |
8 | Setaria anceps Stapf ex Massey | 4.66 |
9 | Sporobolus pyramidalis Beauv. | 0.66 |
10 | Eragrostis superba Peyr | 0.30 |
With regard to woody plants canopy cover, the highest percent cover occurred in Kanakantapa dambo (46%) followed by Kamwale dambo (31%) and Mperekese dambo (29%), while 7% cover was recorded in Mwiinde dambo.
Miombo Forest Stand Structure
Woody vegetation covered most of the Kanakantapa sub-catchment area of Chongwe catchment, and this vegetation was distinctly recognized as the Brachystegia - Julbernardia woodland vegetation types which in this study was generically referred to as the dry deciduous forest.
Stand Diameter Class Distribution
Stand diameter class (DBH) distribution of tree species were categorized as follows; saplings or small tree with stem diameter less than 5.1 cm occurred in Katuba stand (40.0%), diameter between 5.1cm - 10.0cm were common in Kanakantapa (46.7%), Mpelekese (44.4%) and Chipilepile (30.8%). The class diameter 10.1 cm – 15.0cm showed low values across the five forest stands. Diameters between 15.1cm - 20.0cm occurred in Mwinde Forest (45.7%), Chipilepile Forest (30.0%) and Kanakantapa Forest (20.0%). Stem diameters between 20.1cm - 30.0cm had the following values, Katuba Forest (33.3%), Miinde Forest (26.7%) and Chipilepile Forest (23.1%) (Figure 4 and Figure 5).

Figure 4: Woody Plant Species Frequency and Cover
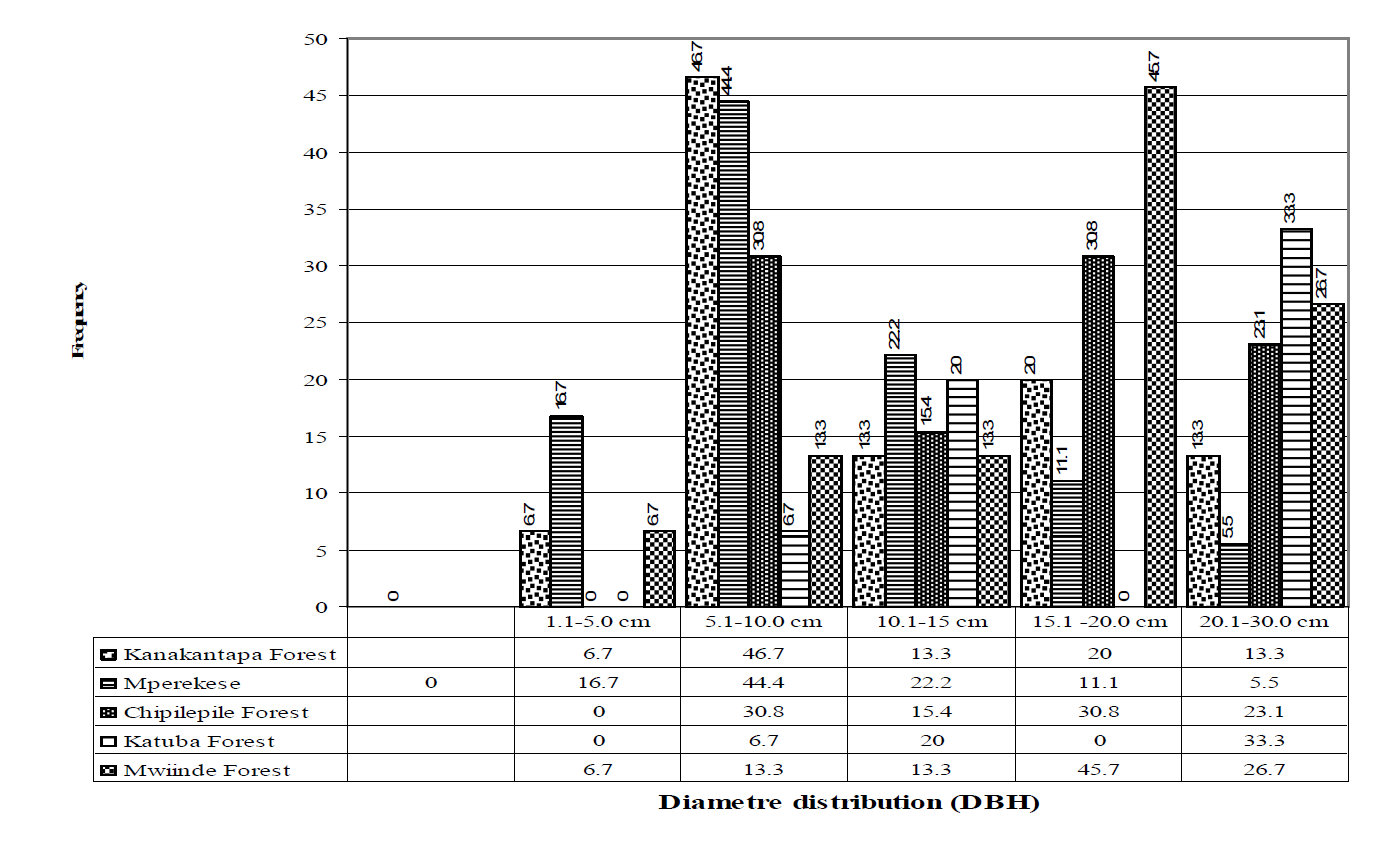
Figure 5: Summary of Diameter Distributions (5-Cm Classes) of Five Forest Stands as an Ecological Indicator of Forest Quality
Species Density, Dominance and Importance Values
Stand structure based on density dominance and species Importance Value in five forest stands were as follows; in Kanakantapa Forest stand Julbernardia globiflora Troupin (54.32IV) Julbernardia paniculata Troupin, (46.44IV),Pseudolachynostylis maprouneifolia (40.72IV) and Brachystegia boehmii (35.31 IV) were recorded. Among the same species Julbernardia paniculata Troupin had relative dominance of (26.5%) while Julbernardia globiflora Troupin showed high value of relative density of (31.92%) (Table 4).
In Mpelekese Forest stand species Importance Values were, Julbernardia paniculata Troupin (57.33IV) followed by Julbernardia globiflora (43.39IV), Albizia antunesiana Harms (25.8). With regard to relative dominance, Julbernardia paniculata Troupin had 28.17% (Table 5).
Species importance values at Chipilepile Forest stand were Julbernardia globiflora Troupin (96.56IV) followed by Branchystegia boehmii Taub. (35.99 IV) and Albizia antunesiana Harms (32.02IV). The most dominant species with regard to relative dominance was Albizia antunesiana 23.7% (Table 6).
Table 4: Species Dominance Based on Species Importance Values in Kanakantapa Forest Stand
| Species | Relative Frequency | Relative Dominance | Relative Density | Importance Value |
| Julbernardia globiflora Troupin | 20.33 | 2.07 | 31.92 | 54.32 |
| Julbernardia paniculata Tropin | 14.33 | 26.53 | 5.58 | 46.44 |
| Pseudolachnostylis maprouneifolia Pax | 10.47 | 14.34 | 15.96 | 40.72 |
| Branchystegia boehmii Taub | 12.5 | 3.66 | 19.15 | 35.31 |
| Ximenia caffra Sonder | 4.67 | 9.41 | 6.38 | 20.46 |
| Bobgunnia madagascariensis (formerly- Swartzia madagascariensis)Desv | 4.67 | 11.88 | 2.13 | 18.68 |
| Albizia antunesiana Harms | 6.25 | 9.92 | 0.25 | 16.42 |
| Parinari curatellifolia Planch. ex Benth | 6.25 | 2.53 | 4.79 | 13.57 |
| Pterocarpus angolensis DC. | 4.67 | 4.50 | 2.13 | 11.30 |
| Ziziphus mucronata Willd | 2.08 | 3.17 | 3.19 | 8.44 |
| Byrsocarpus orientalis (Baill.) Bak | 2.08 | 1.08 | 3.19 | 6.36 |
| Uapaca kirkiana Mull. Arg. | 2.08 | 2.47 | 1.59 | 6.14 |
| Terminalia sericea Burch. ex DC | 4.17 | 0.60 | 1.28 | 6.05 |
| Philenoptera violacea (Formerly-Lonchocarpus capassa) Rolfe | 2.33 | 1.81 | 1.59 | 5.73 |
| Albizia versicolor (Welw. ex) Oliv. | 2.33 | 3.17 | 0.45 | 5.45 |
| Acacia nilotica (L.) Wild. | 2.08 | 2.90 | 0.40 | 5.35 |
Table 5: Species Dominance Based on Species Importance Values in Mpelekese Forest Stand
| Species | Relative Frequency | Relative Dominance | Relative Density | Importance Value |
| Julbernardia paniculata Tropin | 14.58 | 28.17 | 17.64 | 57.33 |
| Julbernardia globiflora Troupin | 16.67 | 10.06 | 23.53 | 43.39 |
| Albizia antunesiana Harms | 6.25 | 13.31 | 5.90 | 25.81 |
| Pseudolachnostylis maprouneifolia Pax | 10.42 | 2.96 | 11.76 | 23.79 |
| Branchystegia boehmii Taub. | 6.25 | 8.42 | 5.90 | 20.92 |
| Byrsocarpus orientalis (Baill.) Bak. | 8.33 | 2.11 | 11.76 | 18.77 |
| Uapaca nitida Mull. Arg. | 6.25 | 4.04 | 5.90 | 16.54 |
| Pericopsis angolensis (Bak.) Ban Meeuwen | 4.17 | 4.65 | 5.90 | 12.98 |
| Diospyros senensis Klotzsch | 2.08 | 8.18 | 0.00 | 12.35 |
| Bobgunnia madagascariensis (formerly- Swartzia madagascariensis)Desv. | 4.17 | 3.56 | 5.90 | 11.89 |
| Piliostigma thonningii (Schum.) Milne-Redh | 2.08 | 6.29 | 0.00 | 10.46 |
| Terminalia sericea Burch. ex DC | 4.17 | 1.76 | 5.90 | 10.09 |
| Ximenia caffra Sonder | 4.17 | 1.40 | 5.90 | 9.73 |
| Strychnos spinosa Lam. | 2.08 | 1.99 | 0.00 | 6.15 |
| Protea angolensis Welw | 2.08 | 1.35 | 0.00 | 5.51 |
| Monotes katangensis (De Wild.) De. Wild. | 2.08 | 0.69 | 0.00 | 4.85 |
| Dichrostachys cinerea (L.) | 2.08 | 0.62 | 0.00 | 4.78 |
| Syzygium guineense (Willd.) DC. | 2.08 | 0.44 | 0.00 | 4.61 |
Table 6: Woodland vegetation structure at Chipilepile protected forest based on species Importance values
| Species | Relative Frequency | Relative Dominance | Relative Density | Importance Value |
Julbernardia globiflora Troupin | 43.75 | 9.37 | 44.44 | 97.56 |
Branchystegia boehmii Taub. | 16.67 | 2.65 | 16.67 | 35.99 |
Albizia antunesiana Harms | 4.17 | 23.70 | 5.56 | 33.43 |
Syzygium guineense (Willd.) DC. | 8.33 | 2.60 | 11.11 | 22.04 |
Terminalia sericea Burch. ex DC | 4.17 | 8.87 | 5.56 | 18.60 |
Pericopsis angolensis (Bak.) Ban Meeuwen | 4.17 | 8.30 | 5.56 | 18.03 |
Parinari curatellifolia Planch. ex Benth | 2.08 | 13.53 | 0.00 | 15.61 |
Pseudolachnostylis maprouneifolia Pax | 4.17 | 4.69 | 5.56 | 14.42 |
Combretum molle (R. Br. ex G. Don.) | 2.08 | 11.91 | 0.00 | 13.99 |
Diplorhynchus condylocarpon (Mull-Arg) Pichon | 4.17 | 0.92 | 5.56 | 10.65 |
Terminalia sericea Burch. ex DC | 2.08 | 6.70 | 0.00 | 8.78 |
Brachystegia spiciformis Benth | 2.08 | 5.96 | 0.00 | 8.04 |
Lannea discolor (Sond.) Engl. | 2.08 | 0.80 | 0.00 | 2.88 |
Table 7: Woodland Vegetation Structure at Katuba Based on Species Importance Values
| Species | Relative Frequency | Relative Dominance | Relative Density | Importance Value |
Monotes katangensis (De Wild.) De. Wild. | 29.17 | 4.41 | 33.33 | 66.91 |
Julbernardia globiflora Troupin | 12.5 | 15.82 | 16.67 | 44.99 |
Pseudolachnostylis maprouneifolia Pax | 14.58 | 0.54 | 16.67 | 31.79 |
Julbernardia paniculata Tropin | 6.25 | 18.21 | 5.55 | 30.01 |
Albizia antunesiana Harms | 12.5 | 0.54 | 16.67 | 29.71 |
Pterocarpus angolensis DC | 2.08 | 17.07 | 0.00 | 19.15 |
Parinari curatellifolia Planch. ex Benth | 2.08 | 15.96 | 0.00 | 18.04 |
Diplorhynchus condylocarpon (Mull-Arg) | 2.08 | 13.60 | 0.00 | 15.68 |
Bobgunnia madagascariensis (formerly- Swartzia madagascariensis)Desv. | 4.17 | 5.00 | 5.55 | 14.72 |
Branchystegia boehmii Taub | 4.17 | 0.20 | 5.55 | 9.92 |
Ozoroa nigricans R. et A. Fern | 2.08 | 5.47 | 0.00 | 7.55 |
Pericopsis angolensis (Bak.) Ban Meeuwen | 2.08 | 1.43 | 0.00 | 3.51 |
Dichrostachys cinerea (L.) | 2.08 | 0.73 | 0.00 | 2.81 |
Uapaca nitida Mull. Arg. | 2.08 | 0.59 | 0.00 | 2.67 |
Flacourtia indica (Burm. f.) Merr | 2.08 | 0.44 | 0.00 | 2.52 |
Table 8: Woodland Vegetation Structure at Mwiinde Forest Based on Species Importance Values
| Species | Relative Frequency | Relative Dominance | Relative Density | Importance Value |
Acacia sieberiana DC. | 2.08 | 47.19 | 3.12 | 52.39 |
Bauhinia petersiana Bolle | 16.67 | 1.30 | 15.62 | 33.59 |
Markhamia acuminata (Klotzsch) K. Schum | 14.58 | 2.72 | 12.50 | 29.80 |
Piliostigma thonningii (Schum.) Milne-Redh | 14.58 | 2.65 | 12.50 | 29.73 |
Lonchocarpus capassa Rolfe | 12.5 | 4.18 | 12.50 | 29.12 |
Terminalia sericea Burch. ex DC | 6.25 | 11.47 | 6.25 | 23.97 |
Combretum ghasalense Engl. et Diels | 10.41 | 1.13 | 9.37 | 20.91 |
Albizia antunesiana Harms | 2.08 | 6.98 | 3.12 | 12.18 |
Euphorbia candelabrum Tremaux ex Kotschy | 2.08 | 6.59 | 3.12 | 11.79 |
Combretum mossambicense(Klotzsch) Engl. | 4.17 | 3.20 | 3.12 | 10.49 |
Sclerocarya caffra Sond | 2.08 | 4.49 | 3.12 | 9.69 |
Ziziphus mucronata Willd.Phoenix | 2.08 | 3.09 | 3.12 | 8.29 |
Bobgunnia madagascariensis (formerly- Swartzia madagascariensis)Desv. | 4.17 | 0.67 | 3.12 | 7.96 |
Diplorhynchus condylocarpon (Mull-Arg) Pichon | 2.08 | 2.59 | 3.12 | 7.79 |
Pericopsis angolensis (Bak.) Ban Meeuwen | 2.08 | 1.47 | 3.12 | 6.67 |
Dichrostachys cinerea (L.) | 2.08 | 0.26 | 3.12 | 5.46 |
In Katuba Forest the most important plant species were Monotes katangensis (De Wilde) (62.91IV) followed by, Julbernadia globiflora Troupin (44.99IV) and Pseudolachynostylis maprouneifolia (31.79IV) (Table 7).
At Mwiinde Forest stand, species importance values were, Acacia sieberana DCas had (52.39IV) followed by Bauhinia petersiana Bolle (33.59 IV), Markhamia acuminata (Klotzsch) K. Schum (29.80iv), Piliostigma thornningiis (schum) (29.80IV) and Loncocarpus capassa Rolfe (29.12IV). The relative density value showed that Bauhinia petersiana Bolle had the highest value (15.62%) (Table 8).
This study attempted to highlight understanding of wetland condition using ecological indicators and as such providing information necessary for their effective management, in particular dambos which have been subjected to various anthropogenic activities with negative consequences yet largely ignored. It was only recently that Zambia put in place a wetland policy [31], although its implementation remains questionable in the absence of substantial ecological data. Secondly, the study assessed the dambo palustrine wetland ecological character focusing on ecological condition and structure of the vegetation associated with the dambo ecosystem. The wetland ecological character as defined by the wetland RAMSAR refers to “the structure and the inter-relationship between the biological, chemical and physical components of the wetland. These derive from the interaction of individual processes, functions, attributes and values of the ecosystem (s)”.
Wetland Condition
Wetland condition is defined in the context of ecosystem health and wetland ecological character Kentula and Paulsen, [32-34] and as such, wetland condition is understood to refer to “a state of the wetland including biological, physical and chemical component of a wetland ecosystem”. It is the health of the ecosystem, and it includes the stability and sustainability of the ecosystem to withstand environmental stress. It further describes wetland condition as an ecosystem having the capacity to support a diverse community of organisms and to perform functions compared to that of a un-impaired site [8]. In this study we based our theoretical understanding of wetland condition on this definition. Secondly functional indicators used in this study were drawn from the range management indicator groups, a rating score card developed by the US Rangeland society. This rating score card was adjusted as proposed by Chabwela et al.
Grass Cover Dominance
The dominance of grass plant species in all dambos studied confirms earlier research characterizing dambos. However, the high presence of Loudetia simplex, Digitaria milanjiana, Setaria ancept, S. ciliolata, Eragrostis superba suggests that Kanakantapa dambos are restricted to low rainfall region and probably with short duration of surface and subsurface water discharge. These plant species are prevalent in dry regions. We base our interpretation of wetland condition on the understanding that a typical dambo is characterized by the presence of for instance, Echinochloa colona, E. pyramidalis, Phragmites sp, as well as large species of sedges and emergent hydrophytes [8].
Litter Accumulation
Litter occurrence in all dambos studied was less than 50% which did not indicate that dambos were at risk. However, in this study, we did not include litter depth and as such our view remains inconclusive of the significance of our findings. Nevertheless, Stoker and Reylea, Pellant et al., Pellant et al., Atkirison and Cairns, Magee, Xiong et al., underscored the need to carry out detailed studies covering various aspects of litter structure and function including litter cover, decomposition, accumulation, litter depth and litter ecosystem as they are critical in defining wetland ecological condition. Results in this area of study have drawn conclusions of the significance of litter in rangelands and wetlands such that litter is important not only as soil cover, but also important for soil formation and moisture retention. It is our view that further research in this and other dambo research sites should focus on all aspects of litter.
Shrub and Forb Species Encroachment
The high occurrence of woody plants as shown in Table 4, is an indication of woody plant encroachment in the dambo grassland ecosystem. Eldridge et al., provided detailed account on shrub proliferation of woody plants and encroachment as a major concern in wetland and rangeland management. Zedler and Kercher [35] also pointed out that wetlands particularly depressional wetlands behave as sinks that accumulate material that results from terrestrial and wetland disturbances. Since wetlands are subjected to flood pulses and materials from surface water flows, it is highly probable that these areas are major habitats of shrubs, trees and forb species.
The presence of Combretum ghasalense, Lonchocarpus capassa, Ziziphus mucronata and Cassia abbreviata are plant species usually predominantly occurring in mainly drought prone areas receiving 800mm and less. The presence of Diospyros mespiliformis and Kigelia africana however, suggest high alluvial content. We remain inconclusive of the presence of other woody plant species in the dambos studied, although we would postulate that their occurrence could be attributed to bush fires and related anthropogenic activities.
Forest Structure
Comprehensive studies and well documented findings on Miombo structure, species composition, diversity and dynamics by have been done by several authors including Gonçalves et al., [37]. Variations in structure and composition is for the most part attributed to each species having different ecological needs as well as environmental changes caused by slash-and-burn agriculture, logging particularly for charcoal production and construction [37-40]. Our findings in this study of the five forest stands showed mixed structures of the diameter distribution and this may suggest severe disturbance through excessive land use. Obviously, the lack of recruitment of the young tree species shown in Chipilepile and Kanakantapa forest stands in the diameter range of 1-5.1 cm may strongly suggest human disturbance through selective logging for poles and construction materials while the diameter distribution structure in Katuba and Mwiinde may suggest strong presence of slash and burn agricultural practices.
The dominance of Julbernardia globiflora Troupin and Julbernardia paniculata Tropin is typical of the Miombo and a confirmation of the soil type and topography of the area [15,17-18]. However, the high presence of species such as Monotes katangensis (De Wild.) De. Wild. and Acacia sieberana DC in this type of vegetation of the area require a different interpretation. While we remain inconclusive on this, we can however hypothesize that the area was subject to logging of large and useful trees for charcoal production.
The high occurrence of Combretum ghasalense Engl. et Diels, Pseudolachnostylis maprouneifolia Pax, Diplorhynchus condylocarpon (Mull-Arg) Pichon, Markhamia acuminata (Klotzsch) K. Schum and Terminalia spp may indicate high land use pressure [37] and since these species are understory and to some extent fire resistant, fires might have strong influence on the forest ecology of the area.
Dambo Recharge Function: The Sponge Hypothesis
The sponge hypothesis advanced by researchers and proponents [41-43] proposed that “wetlands function as a natural sponge that trap rainwater and flood water during the rainy season and releases this slowly during the dry season.” Based on our findings, using vegetation characteristics, suggest evidence of prolonged duration of water flow in these dambos. The presence of Kylinga rotunda, Cyperus esculentus and Polyganum spp, could not substantiate the character of typical dambo as for the most part they are represented by key plants such as Echinochloa colona, Phragmites spp, Typha spp, Skirpus spp and emergent hydrophytes.
Some results presented in recent empirical studies suggest that the sponge hypothesis is not significantly valid [4,44]. In general, findings in these studies showed water flow in the dambos investigated followed a flow curve of high peak during the middle of rainy season and declined towards the end of the rainy season. Further, such studies also revealed that the inflow and outflow in these dambos were indistinguishable meaning that the accession that a dambo wetland can retard flood could not be confirmed. Thus, the general conclusion was that sponge hypothesis could not be validated.
The inability of a wetland to perform the discharge function, in particular, small wetlands has been explained elsewhere [45-46]:
Wetland Water Storage Capacity
Dambos have been described as small, narrow, linear, shallow and for the most part, they are hanging or perched wetlands [2,47]. These small wetlands are known to have limited storage capacity [45], and consequently are not capable to sustain water discharge throughout the year. Studies by Gleason et al., [48] and Krasnostein and Oldham [49] provided illustrations for the behaviour of small wetlands in relation to the size of the catchment. Their studies showed strong relationships between interception area and the wetland basin, and in addition, wetland area was very much related to wetland volume for water storage. Such studies are important to our results and the argument on why dambos may not carry the discharge function as usually predicted.
Land Use and Land Cover Change
The relationships between water and forests have been well investigated and comprehensively discussed. It is now a well-known and fully established science [50-52]. Forests are an integral component of the landscape, and maintaining their functional integrity is fundamental for the sustaining of the ecosystem, and while our argument may be conjectural, we maintain that deforestation around dambos in Kanakantapa sub-catchment has a negative effect on water storage in these wetlands. As shown in the results of this study the diameter distribution of forests around Kanakantapa dambos suggests clear disturbance of the forests of this area. Our findings are supported by Tena et al., [16] who reported a rapid decrease of forest land in Chongwe catchment between 1984 and 2017 by 14.26% and concluded that this reduction was attributed to the conversion of the forest land to built area and farmland as well as the high demand for the forest products such as wood products and charcoal production. Extensive studies on the effect of land use on stream hydrology have been done and well documented elsewhere [53-57]. The main findings in their studies showed strong relationship between change in vegetation cover and increased water yield and that stream flow increased in areas which were cleared for agricultural purposes. These and many other studies are significant and may explain why dambos may appear to be limited in carrying out the recharge function as expected.
The main goal of this study was to determine vegetation structure and condition of head water dambos by using vegetation data. Results in this investigation highlighted invasion of woody plants which is an indication of the physical disturbance and gradual transformation of dambos. The limitation of this study however, is that the data, was from a short period, and thus the study required additional indicator variables and extended time scale.
Recommendations
Our recommendations are based on the core findings of this study and we recommend the following:
Management of Dambo Wetlands
For nearly four decades of Ramsar Convention in Zambia, management of wetlands has not received much attention at either policy or conservation levels. As wetlands remain poorly understood, their significance is heavily contrasted with continued accelerated depletion of their resources such as fisheries, wildlife and water. For this reason, our study aimed at stimulating research on wetlands so as to guide planners and managers towards effective management of wetland ecosystems in the country. Chutterjee et al., Sullian et al., pointed out that management of ecosystems require understanding of their structure and how they function, and in the absence of information, effective implementation of policies and plans is largely questionable. We present these recommendations also with the view of the wetland policy recently put in place, and we recommend that management of dambos should include among other things the following:
Promote and ensure good partnership governance with all stakeholders and land users of dambos
Promote awareness of the risks of deforestation, unplanned settlements, and invasive species
Highlight the importance of best land use practices as one of the ways of guaranteeing their long-term survival and biological integrity
Promote water management in dambos by reducing flood risks and conserving dambo resources in general
Wise use of dambo wetlands
As stated earlier in this report, wetlands in general have been neglected, poorly understood and largely not managed in accordance with the Ramsar wise use principles. The ecological significance of dambos in particular seem not to have been well reflected in the effort of conservation. Wise use of wetlands requires maintenance of their ecological character which can be achieved through the implementation of ecosystem approaches within the context of sustainable development [58], and in the context of sustainable development, wise use is expected to recognize that while some wetlands developments can be facilitated in sustainable ways by approaches elaborated under the convention, it also important that it is not appropriate to imply that development is an objective for every wetland [58].
Chongwe river catchment for instance, has been experiencing changes in land use/ land cover and in its hydrology. According to Tena et al., [16], in the last 33 years the Chongwe river catchment has experienced a sharp increase in built up area, irrigated agriculture, and also rapid increase in rain fed agriculture. While grassland area had increased, forest land cover had drastically decreased during the same period. It is obvious therefore that, the current loss of soil cover arising from increased levels of deforestation, there is a risk of drying of the dambo wetlands and loss of biodiversity and ecological services they provide.
Dambo Wetland Catchment Management
We recommend the management of dambos to protect the land and water including other resources within the catchment. Dambo catchment management refers to a form of land use practice and water management practice to protect and improve the quality of the water and other natural resources within a catchment by managing the land and water resources in an integrated way.
Integrated management of wetland resources is inevitable in securing and ensuring a sustainable supply of water for domestic and industrial use. As human populations increase so will the demand for water which will trigger water stress. Invariably, this has already been reported by Chisola and Kuraz and Tena et al. [16] in Chongwe district arising mainly from the expansion of Lusaka city.
Acknowledgements
We wish to thank most sincerely Mr. Chilufya and James Banda who assisted greatly in data collection. Mr. James Banda was particularly useful in the identification of woody plant species in local languages. We also extend our thanks to Mr. and Mrs. Sibanda Mupupuni Sigogo and Sibongile Sibanda for their generosity in accommodating us and allowing us to use their farm during the entire period of the study. We also thank those individuals who were willing to be interviewed and who gave us information about the local knowledge of the area. We thank them all.
Conflict of interest
The authors of this article declare no competing professional or personal interests to affect the results/ findings or the validity of this research publication.
Whitlow, R. “A review of dambo gullying in South-Central Africa.” Zambczia, vol. XVI, no. II, 1989, Michigan State University Library, http://digital.lib.msu.edu/projects/Af ricanjournals/.
Whitlow, R. “A survey of dambos in Zimbabwe.” Zimbabwe Agricultural Journal, vol. LXXXI, 1984, pp. 129–138.
Mäckel, R. “Dambos: A study of morphodynamic activity on the plateau regions of Zambia.” Catena, vol. 1, 1974, pp. 327–365.
McCartney, M.P. et al. “Use of deuterium to understand runoff generation in a headwater catchment containing a dambo.” Hydrology and Earth System Sciences, vol. 2, no. 1, 1998, pp. 65–76.
Riddell, E.S., et al. “The hydrological characterization and water budget of a South African rehabilitated headwater wetland system.” Water SA, vol. 39, no. 1, 2012, https://doi.org/10.4314/wsa.v39i1.8.
Chabwela, H.N. et al. Status of wetlands of Zambia: Management and conservation issues. Environmental Council of Zambia, 1994.
Chang, M. Forest hydrology: An introduction to water and forests. 3rd ed., CRC Press, 2013, https://doi.org/10.12 01/b13614.
Balek, J. Hydrology and water resources in tropical Africa. Elsevier Scientific Publishing Company, 1977.
Kantrud, H.A. and Newton, W.E. “A test of vegetation-related indicators of wetland quality in the prairie pothole region.” Journal of Aquatic Ecosystem Health, vol. 5, 1996, pp. 177–191.
Chabwela, H. et al. “The habitat structure of Lukanga Ramsar Site in Central Zambia: An understanding of wetland ecological condition.” Open Journal of Ecology, vol. 7, 2017, pp. 406–433, https://doi.org/10.4236/oje.2017.7 6029.
Chisola, M.N. and Kurá, M. “Patterns and implications of hydrologic regime change in Chongwe River, Zambia.” Journal of Geography and Geology, vol. 8, no. 3, 2016, https://doi.org/10.5539/jgg.v8n3p1.
Handlos, W.L. “Introduction to the ecology of the Kafue Flats.” Proceedings of the national seminar on environment and change, edited by G.W. Howard and G.J. Williams, University of Zambia, 1982.
Bäumle, R.A. et al. Groundwater resources of the Mwembeshi and Chongwe catchments including the Lusaka Region. Department of Water Affairs and Federal Institute for Geosciences and Natural Resources, 2012.
Nick, A. The Chongwe catchment: A hydrological, hydrogeological and hydrochemical characterization for the establishment of a catchment management plan. Federal Ministry for Economic Cooperation and Development, 2015.
Webster, R. “A catena of soils on the Northern Rhodesia plateau.” Journal of Soil Science, vol. 16, 1965, pp. 31–43.
Brammer, H. Soils of Zambia. Department of Agriculture, 1974.
Trapnell, C.G. and Clothier, J.N. The soils, vegetation, and traditional agriculture of Zambia. Vol. I, Redcliffe Press, 1996.
Tena, T. et al. “Hydrological modelling and water resources assessment of Chongwe River catchment using WEAP model.” Water, vol. 11, 2019, p. 839, https://doi.org/10.33 90/w11040839.
Cole, M.M. “Vegetation and geomorphology in Northern Rhodesia.” Geographical Journal, vol. 129, 1963, pp. 290–310.
Fanshawe, D.B. The vegetation of Zambia. Forest Research Bulletin No. 7, Government Printer, 1971.
Perera, N.P. “The ecology of wetlands (dambos) of Zambia and their evaluation for agriculture.” International Journal of Ecology and Environmental Sciences, vol. 8, 1982, pp. 27–38.
Harker, K.W. and Napper, D. An illustrated guide to the grasses of Uganda. Government Printer, 1966.
Fanshawe, D.B. Checklist of vernacular names of the woody plants of Zambia. Forest Research Bulletin No. 3, 1965.
Palgrave, K.C. and Drummond, R.B. Trees of Southern Africa. Struik Publishers, 1990.
Ruyle, G. and Dyess, J. Monitoring and the Parker 3-step method. University of Arizona, 2010.
Hyder, D.N. and Sneva, F.A. “Bitterlich’s pilotless method for sampling basal ground cover of bunch grasses.” Journal of Range Management, vol. 13, 1960, pp. 6–9.
Held, M.E. and Wistendahl, W.A. “The use of the Bitterlich sampling technique in an Athens County, Ohio forest.” Ohio Journal of Science, vol. 78, no. 1, 1978, pp. 26–28.
Barker, P. A technical manual for vegetation monitoring. Department of Primary Industries, 2001.
Mueller-Dombois, D. and Ellenberg, H. Aims and methods of vegetation ecology. John Wiley and Sons, 1974.
Mitchell, K. Quantitative analysis by the point-centered quarter method. Hobart and William Smith Colleges, 2007.
Silva, L.B. et al. “Comparison of T-square, point-centered quarter, and N-tree sampling methods in Pittosporum undulatum invaded woodlands.” International Journal of Forestry Research, 2017, https://doi.org/10.1155/2017/2 818132.
Smith, L. et al. Principles of obtaining and interpreting utilization data on rangelands. University of Arizona Cooperative Extension, 2005.
Government of the Republic of Zambia. National policy on wetlands. Ministry of Lands and Natural Resources, 2014.
Kentula, M.E. and Paulsen, S.G. “The national wetland condition assessment: Overview and an invitation.” Environmental Monitoring and Assessment, vol. 191, 2019, pp. 325, https://doi.org/10.1007/s10661-019-7316-4.
Faber-Langendoen, D. et al. Ecosystem condition across landscape regions: A multi-metric approach. U.S. Environmental Protection Agency, 2012.
Papas, P. et al. Index of wetland condition: Conceptual framework and selection of measures. Department of Sustainability and Environment, 2005.
Zedler, J.B. and Kercher, S. “Causes and consequences of invasive plants in wetlands: Opportunities, opportunists, and outcomes.” Critical Reviews in Plant Sciences, vol. 23, no. 5, 2004, pp. 431–452, https://doi.org/10.1080/07352 680490514673.
Gonçalves, F.M.P. et al. “Tree species diversity and composition of Miombo woodlands in South-Central Angola.” International Journal of Forestry Research, 2017, https://doi.org/10.1155/2017/6202093.
Backéus, I. et al. “Tree communities and structural dynamics in Miombo woodland, Tanzania.” Forest Ecology and Management, vol. 230, 2006, pp. 171–178.
Isango, J.A. Stand structure and tree species composition of Tanzania Miombo woodlands. Miombo Project Proceedings, 2007.
Mbwambo, L. et al. “Structure and dynamics of Miombo woodland stands at Kitulangulo Forest Reserve.” Finnish Forest Research Institute, 2008.
Mwakalukwa, E.E. et al. “Floristic composition, structure, and species associations of dry Miombo woodland in Tanzania.” International Scholarly Research, 2014, https://doi.org/10.1155/2014/153278.
Sather, J.H. and Smith, R.D. An overview of major wetland functions and values. U.S. Fish and Wildlife Service, 1984.
Dugan, P.J. editor. Wetland conservation: A review of current issues and required action. IUCN, 1990.
Bullock, A. “Dambo hydrology in southern Africa: Review and reassessment.” Journal of Hydrology, vol. 134, 1992, pp. 373–396.
McCartney, M.P. and Neal, C. “Water flow pathways and the water balance within a headwater catchment containing a dambo.” Hydrology and Earth System Sciences, vol. 3, no. 4, 1999, pp. 581–591.
Jones, C.N. et al. “Estimating restorable wetland water storage at landscape scales.” Hydrological Processes, vol. 32, no. 2, 2018, pp. 305–313, https://doi.org/10.1002/hyp .11405.
Van der Kamp, G. and Hayashi, H.M. “The groundwater recharge function of small wetlands in the semi-arid northern prairies.” Great Plains Research, 1998.
Von der Heyden, C.J. and New, M.G. “The role of a dambo in the hydrology of a catchment and the river network downstream.” Hydrology and Earth System Sciences, vol. 7, no. 3, 2003, pp. 339–357.
Gleason, R.A. et al. Estimating water storage capacity of existing and potentially restorable wetland depressions. USGS, 2007.
Krasnostein, L. and Oldham, C.E. “Predicting wetland water storage.” Water Resources Research, vol. 40, 2004, https://doi.org/10.1029/2003WR002899.
Ward, R.C. and Robinson, M. Principles of hydrology. McGraw-Hill, 2000.
Hewlett, J.D. Principles of forest hydrology. University of Georgia Press, 1982.
Holechek, J.L. et al.Range management: Principles and practices. 4th ed., Prentice Hall, 2000.
Courtney, F.M. “Developments in forest hydrology.” Progress in Physical Geography, vol. 5, 1981, https://doi.org/10.1177/030913338100500203.
Chemura, A. et al. “The impact of land-use and land-cover changes on water balance of the heterogeneous Buzi sub-catchment, Zimbabwe.” Remote Sensing Applications: Society and Environment, vol. 18, 2020, pp. 1–11.
Gyamfi, C.J. et al. “Hydrological responses to land use and land cover changes in the Olifants Basin, South Africa.” Water, vol. 8, no. 12, 2016, p. 588, https://doi.org/10.3390 /w8120588.
Huang, J. et al. “Evaluation of the impacts of land use on water quality: A case study in the Chaohu Lake Basin.” Journal of Environmental and Public Health, 2013, https://doi.org/10.1155/2013/329187.
Kundu, P.M. and Olang, L.O. “The impact of land use change on runoff and peak flood discharges for the Nyando River.” WIT Transactions on Ecology and the Environment, vol. 153, 2011, https://doi.org/10.2495/WS110081.
Palamuleni, L.G. et al. “Evaluating land cover change and its impact on hydrological regime in Upper Shire River catchment, Malawi.” Regional Environmental Change, vol. 11, 2011, pp. 845–855, https://doi.org/10.1007/s10113-011-0220-2.
Ramsar Convention Secretariat. Wise use of wetlands: Concepts and approaches for the wise use of wetlands. Ramsar Handbooks, 4th ed., vol. 1, 2010.
